
The cost savings from outsourcing often lead to ________ for consumers and ________
for the outsourcing company.
A) lower prices; less output
B) lower prices; more output
C) higher prices; less output
D) higher prices; more output
Recall the Application about the government of Mexico City repainting highway lane
lines to transform a 4-lane highway into a 6-lane highway to answer the following
question(s).
If you use the midpoint method to describe the change in the number of lanes from 1 to
2, then the percent change you would calculate is:
A) 66 percent.
B) 50 percent.
C) 100 percent.
D) 33 percent.
The data presented in the text shows that in the period from 1930-2011, real GDP in the
United States has
A) increased substantially.

B) decreased in every year since 1930.
C) decreased only in recent years.
D) generally remained the same.
A flat tax which does not allow for deductions or credits is essentially a tax on
A) income.
B) consumption.
C) government expenditures.
D) education.
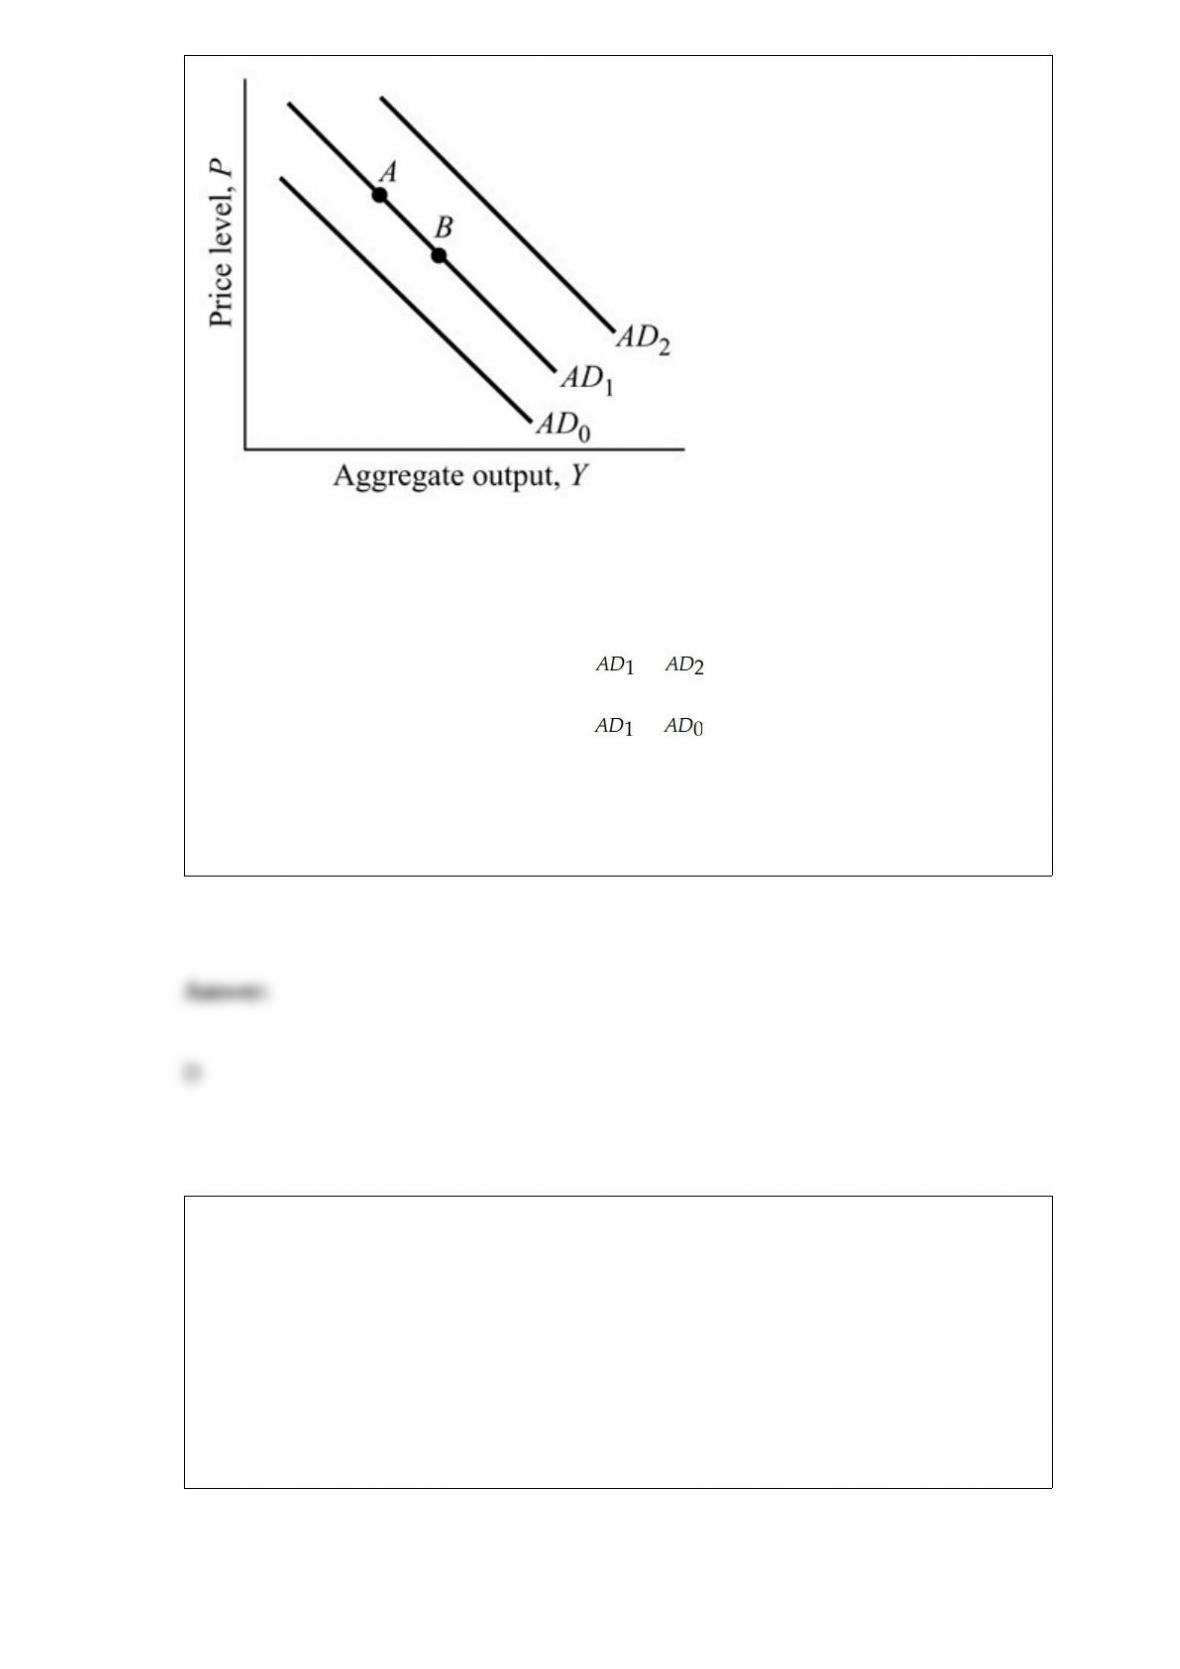
Figure 9.1
Refer to Figure 9.1. When the price level rises and causes lower consumption
expenditures, it is illustrated as:
A) an aggregate demand curve shift from to .
B) an aggregate demand curve shift from to .
C) a move from Point A to Point B, but not a shift of the aggregate demand curve.
D) a move from Point B to Point A, but not a shift of the aggregate demand curve.
When the price of apples goes up
A) the demand for apples will decrease, ceteris paribus.
B) the demand for apples will increase, ceteris paribus.
C) the quantity of apples demanded will decrease, ceteris paribus.
D) the quantity of apples demanded will increase, ceteris paribus.
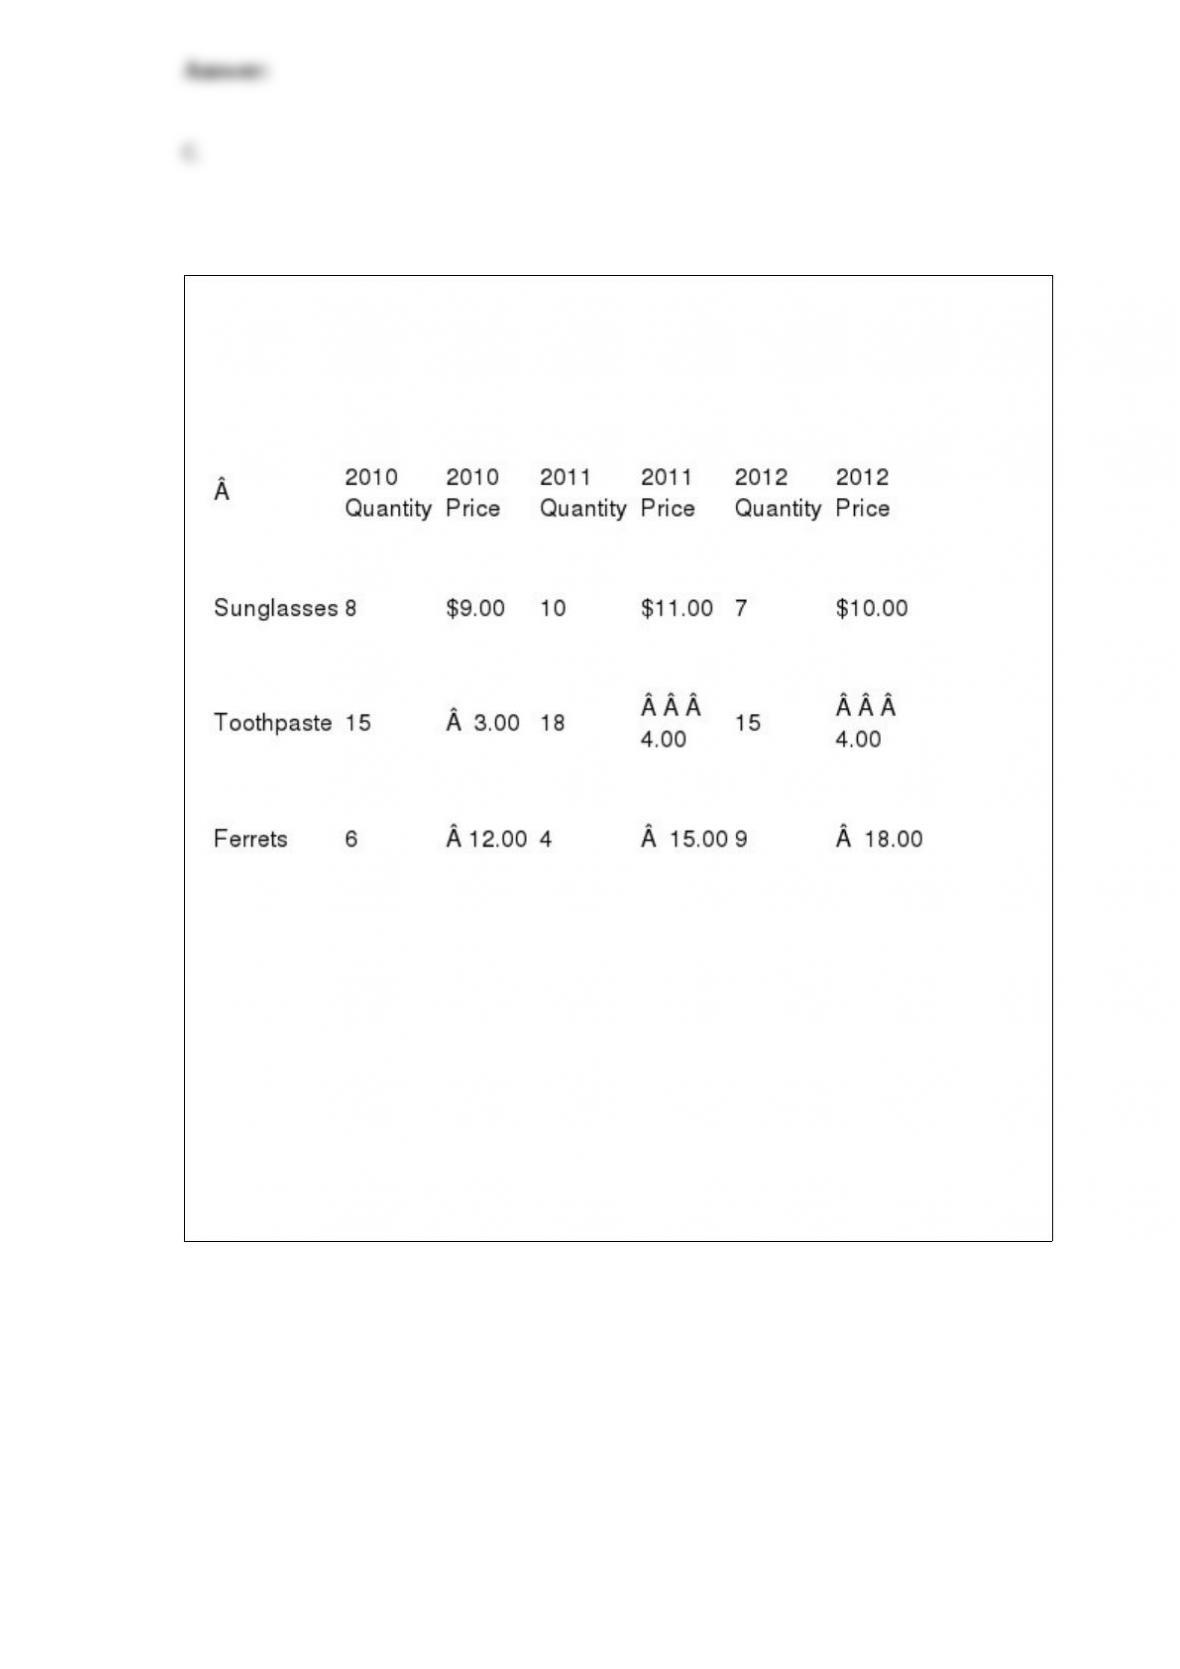
The following table lists the basket of goods in the
Consumer Price Index for the nation of Astro (Assume 2010 is the base year.)
Table 6.2
Using the information in Table 6.2, the Astro Consumer Price Index for 2012 is
A) 87.
B) 104.
C) 131.
D) 298.
What will happen to the equilibrium interest rate when both the money supply and real
GDP decrease?
A) The equilibrium interest rate increases.
B) The equilibrium interest rate decreases.
C) The equilibrium interest rate remains constant.
D) The impact on the equilibrium interest rate is ambiguous.
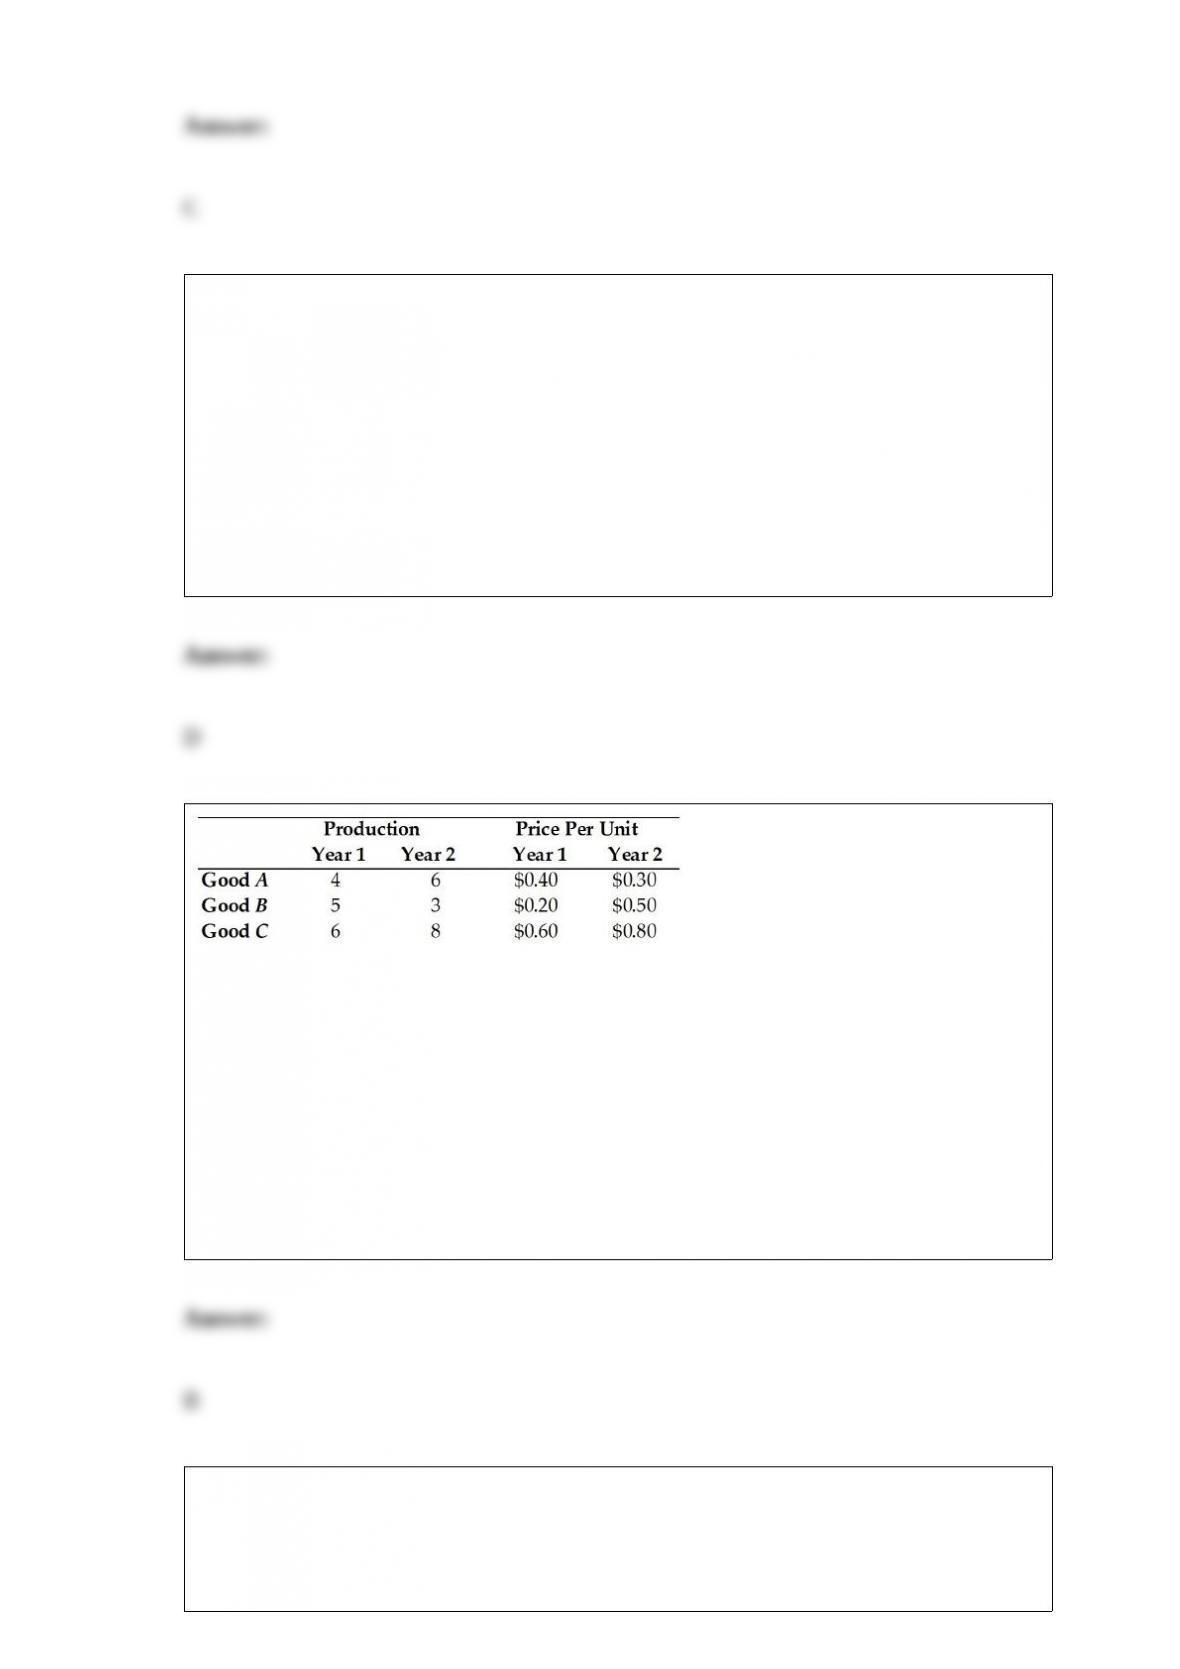
Table 5.2 Refer to Table 5.2.
Suppose this economy produces only the three goods A, B, and C. If we use year 1 as
the base year, then real GDP in year 2 is:
A) $6.20.
B) $7.80.
C) $8.50.
D) $9.70.
If a firm wants to finance a new project, it can obtain financing by
A) issuing and selling new shares of stock.

B) selling corporate bonds to the public.
C) using its retained earnings.
D) all of the above
Which of the following is a federal and state health program that benefits the poor?
A) Defense
B) Social Security
C) Medicare
D) Medicaid
According to the marginal principle, a rational individual should not undertake an
economic activity if the:
A) marginal benefit exceeds marginal cost.
B) marginal benefit is less than marginal cost.
C) marginal benefit equals marginal cost.
D) total benefit equals total cost.
If the price of airline tickets rises during holidays, what will happen to the demand for
flight attendants?

A) It will increase and the equilibrium wages paid to flight attendants will fall.
B) It will increase and the equilibrium wages paid to flight attendants will rise.
C) It will decrease and the equilibrium wages paid to flight attendants will fall.
D) It will decrease and the equilibrium wages paid to flight attendants will rise.