Unlock document.
This document is partially blurred.
Unlock all pages and 1 million more documents.
Get Access
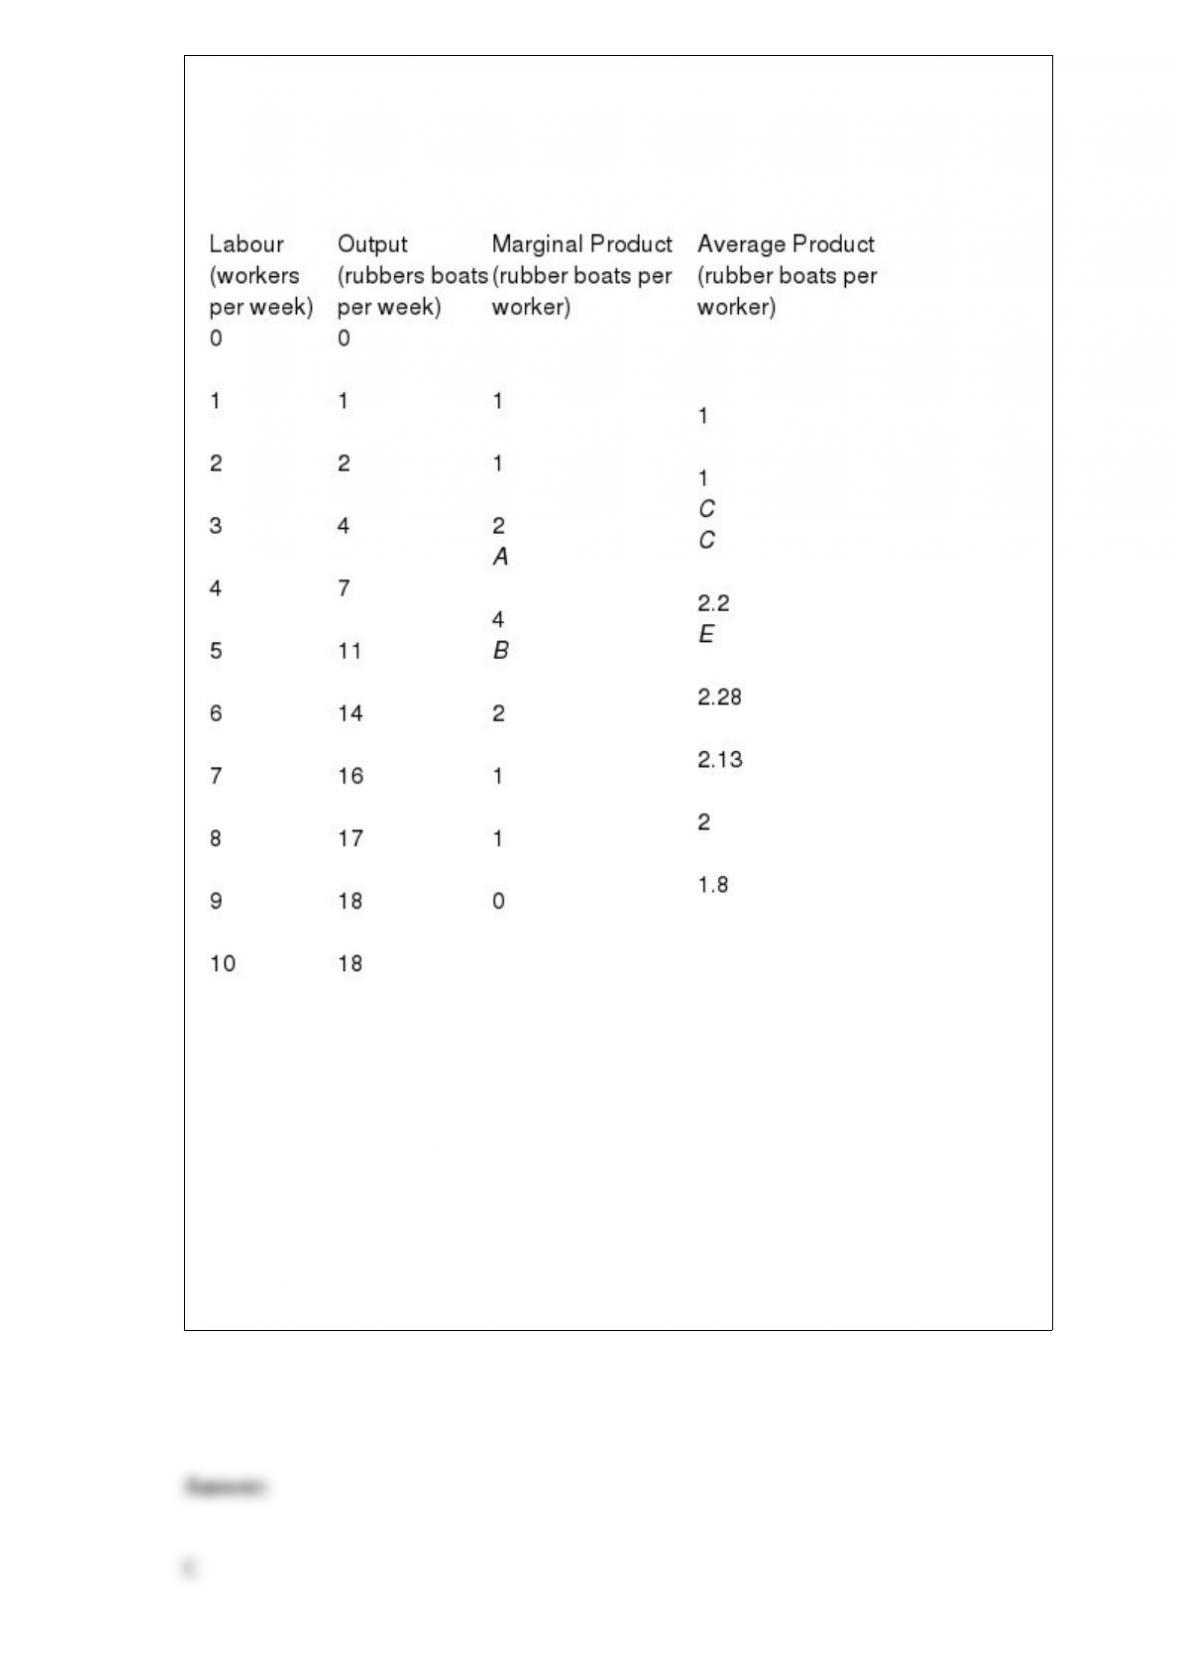
Use the table below to answer the following questions.
Table 11.2.3
Refer to Table 11.2.3. The value of A is
A) 1.75.
B) 2.
C) 3.
D) 7.
E) 4.
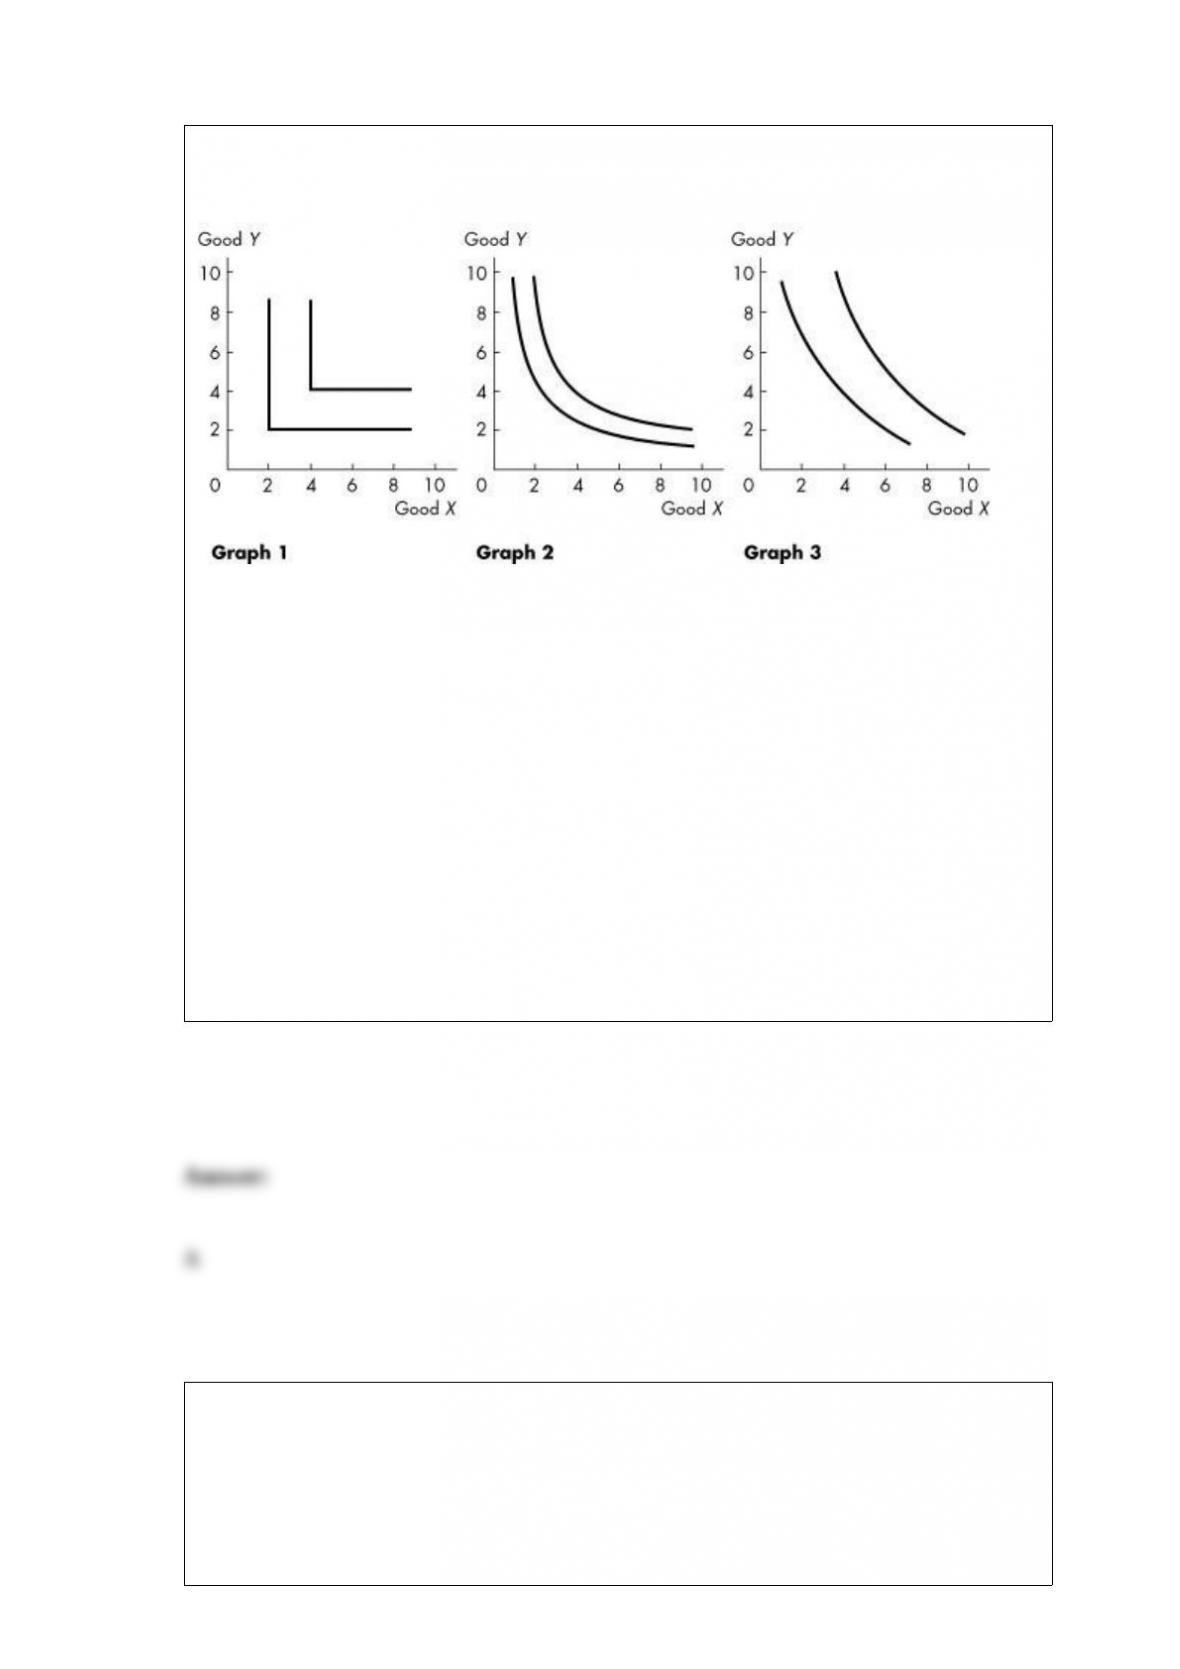
Use the figure below to answer the following question.
Figure 9.2.5
Refer to Figure 9.2.5. The graphs show indifference curves for various goods. Graph
________ best describes the pair of goods baseballs and baseball bats. Graph ________
best describes the pair of goods desktop computers and laptop computers.
A) 2; 3
B) 2; 1
C) 1; 1
D) 1; 3
E) 3; 2
Refer to Table 4.2.2. The income elasticity of demand for Jolt is
A) +0.67.
B) -0.67.

C) +1.5.
D) -1.5.
E) It cannot be calculated because the price of Coke is not constant.
Refer to the production possibilities frontier in Figure 2.1.3. The fact that less of X must
be given up when moving from D to C than when moving from B to A indicates
A) decreasing opportunity cost.
B) increasing opportunity cost.
C) comparative advantage in the production of X.
D) the consequences of technological improvement.
E) unemployed resources at D.
Use the figure below to answer the following questions.
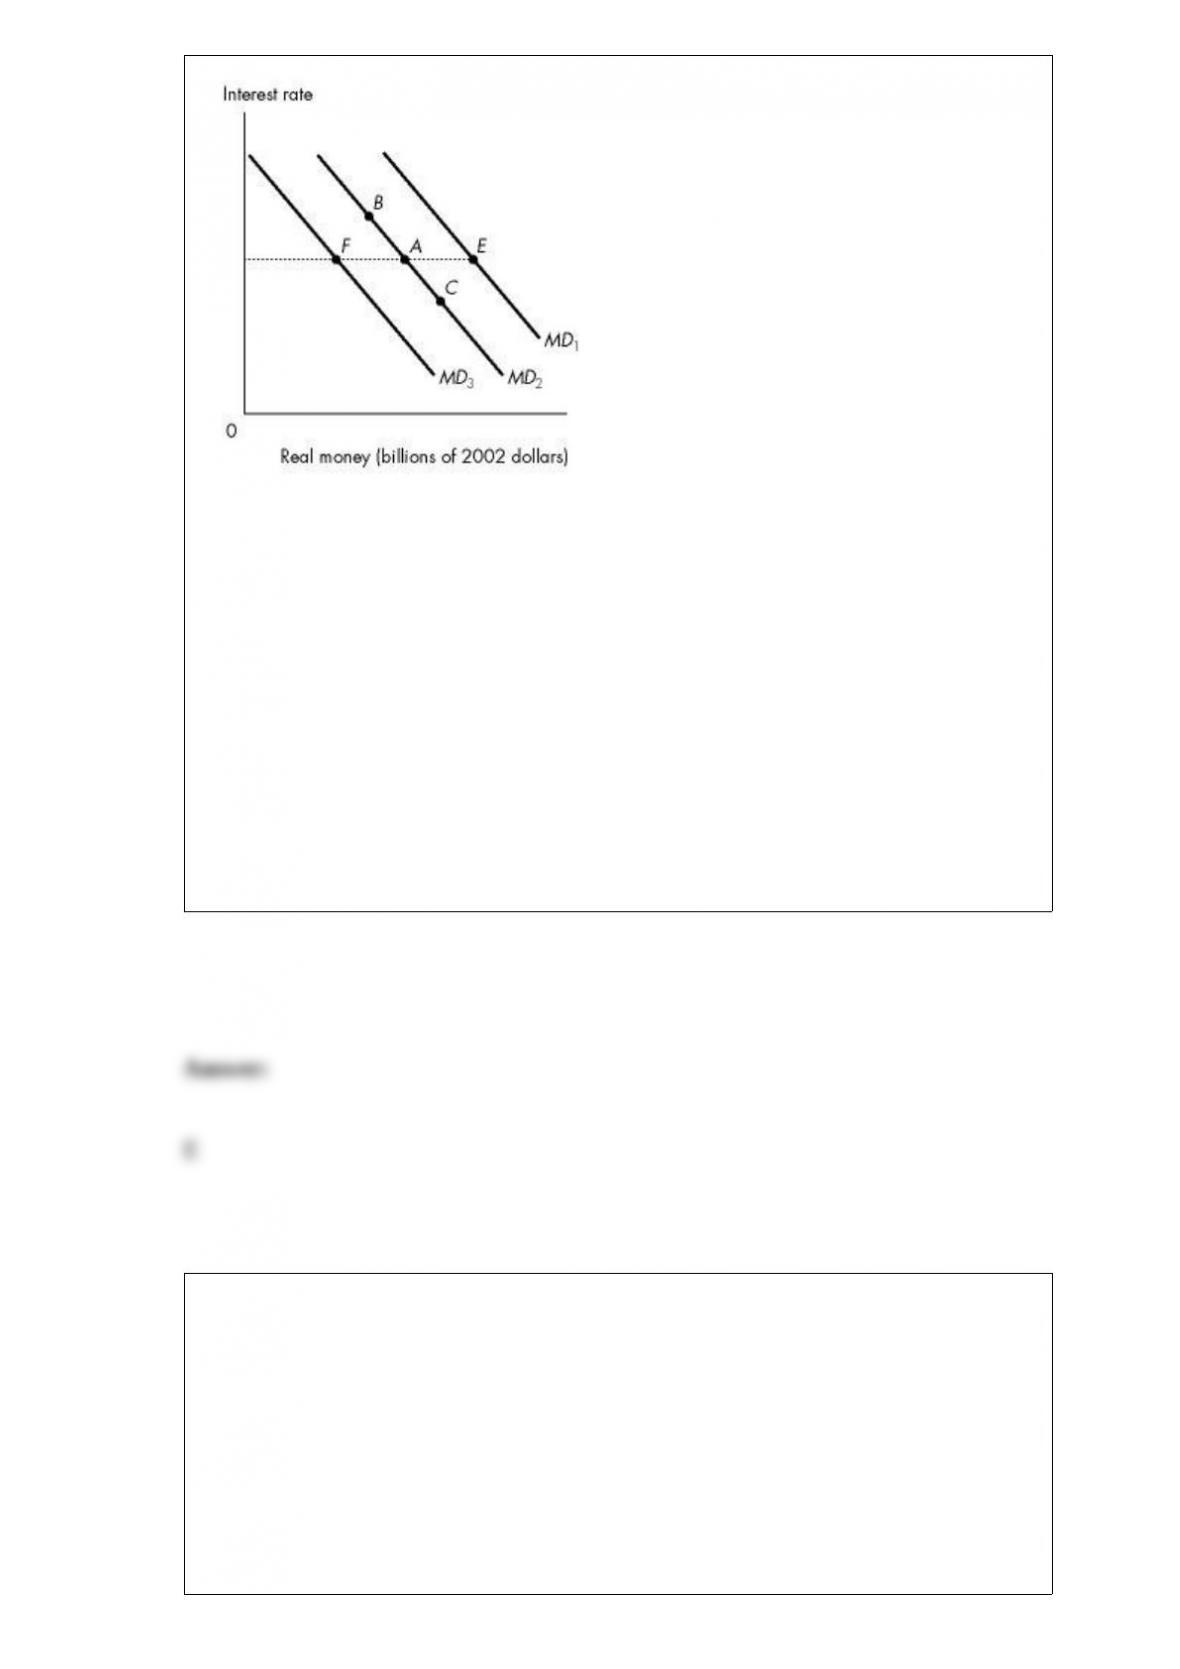
Figure 24.5.2
Refer to Figure 24.5.2. Which one of the following best describes the response to an
increase in real GDP?
A) Movement from A to F
B) Movement from A to C
C) Movement from E to A
D) Movement from B to A
E) Movement from A to E
Suppose the inflation rate is 3 percent and the output gap is -1 percent. Using the Taylor
rule, the Bank of Canada sets the overnight loans rate equal to
A) 5 percent.
B) 6 percent.
C) 4 percent.
D) 1 percent.

E) 5.5 percent.
Refer to Figure 3.2.2. If consumers' income increases,
A) the quantity of pizzas demanded increases.
B) the demand curve for pizzas shifts from D1 to D2 if a pizza is a normal good.
C) the supply of pizzas increases.
D) the quantity of pizzas supplied decreases.
E) a movement from point A to point B on D1 occurs.
Refer to the table below to answer the following questions.
Table 15.2.10
Refer to Table 15.2.10. Firm A and Firm B are the only producers of soap powder. They

collude and agree to share the market equally. The payoff matrix shows the game they
play. The equilibrium of the game is that Firm A ________ and Firm B ________.
A) complies; cheats
B) cheats; complies
C) complies; complies
D) cheats; cheats
E) makes an economic profit; incurs an economic loss
Refer to Fact 27.5.2. What is consumption expenditure in equilibrium in this economy?
A) 35.25
B) 62
C) 53.5
D) 77
E) 92
According to ________ growth theory, growth of real GDP per person comes to a stop
because a population explosion returns real GDP per person to the subsistence level.

According to ________ growth theory, growth of real GDP per person comes to a stop
when technology stops advancing.
According to ________ growth theory, growth of real GDP per person is unending.
A) classical; new; neoclassical
B) neoclassical; classical; new
C) new; neoclassical; classical
D) classical; neoclassical; new
E) new; classical; neoclassical
Offshore outsourcing occurs when a firm in Canada
A) hires foreign labour and produces in other countries.
B) buys finished goods, components, or services from other firms in other countries.
C) buys finished goods, components, or services from other firms in Canada.
D) hires Canadian labour and produces in Canada.
E) hires foreign workers who work in Canada.

Use the information below to answer the following questions.
Fact 14.3.2
Suppose that Tommy Hilfiger's marginal cost of a jacket is $100 (a constant marginal
cost) and at one of the firm's shops, total fixed cost is $2,000 a day. The
profit-maximizing number of jackets sold in this shop is 20 a day. Then the shops
nearby start to advertise their jackets. The Tommy Hilfiger shop now spends $2,000 a
day advertising its jackets, and its profit-maximizing number of jackets sold jumps to
50 a day.
Refer to Fact.14.3.2. If advertising decreases demand and makes demand more elastic,
the price of a Tommy Hilfiger jacket ________. If advertising increases demand and
makes demand less elastic, the price of a Tommy Hilfiger jacket ________. If price
falls, markup ________. If price rises, markup ________.
A) falls; rises; rises; falls
B) rises; falls; falls; rises
C) falls; rises; falls; rises
D) rises; falls; rises; falls
E) falls; rises; does not change; does not change
Refer to Figure 16.3.1. The figure shows the marginal private benefit curve, the
marginal social benefit curve, and the market supply curve. To promote an efficient
quantity the government could grant a subsidy equal to
A) zero.
B) P1.
C) P3 - P1.
D) P4 - P1.

E) P2 - P1.
The largest component of M1 is
A) currency outside banks.
B) personal chequable deposits.
C) non-personal chequable deposits.
D) fixed term deposits.
E) non-personal non-chequable deposits.
Refer to Figure 6.2.1. If the minimum wage is set at $2 per hour, what is the level of
unemployment in millions of hours?
A) 50
B) 40
C) 20
D) 10
E) 0

Product differentiation exists within an industry when
A) there are no substitutes for the product.
B) the firm can sell all it wants at the given price.
C) the market is a monopoly.
D) the market is perfectly competitive.
E) there are close but not perfect substitutes for the product.
In Figure 23.2.3, if the real interest rate is constant at 6 percent and expected profit
falls, the quantity of loanable funds demanded will be
A) less than $450 billion.
B) $450 billion.
C) between $450 billion and $600 billion.
D) greater than $600 billion.
E) zero.
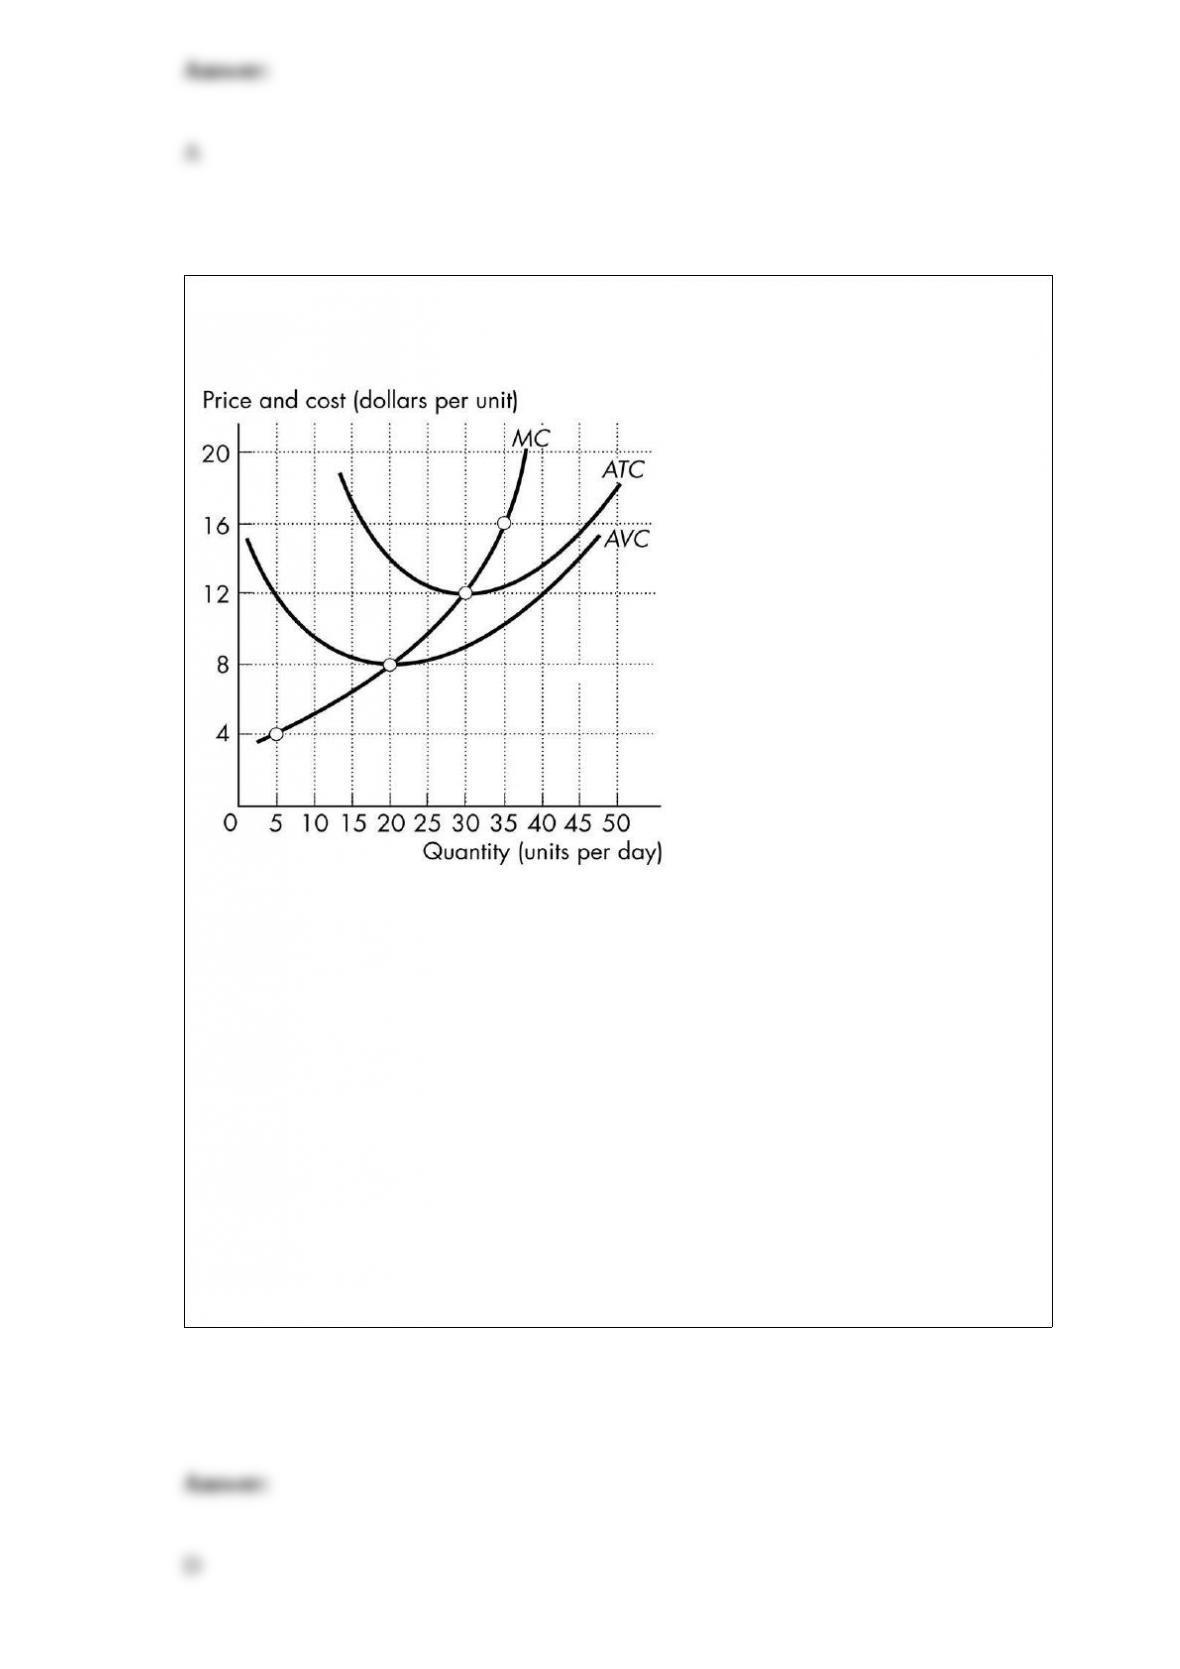
Use the figure below to answer the following question.
Figure 12.3.4
Refer to Figure 12.3.4, which shows cost curves of Paul's Picture Frames Inc. The
picture frame market is perfectly competitive and the market price is $12 a frame. Paul
produces ________ frames each week and makes ________ total revenue.
A) 20; $240
B) 20; $96
C) zero; zero
D) 30; $360
E) 30; zero
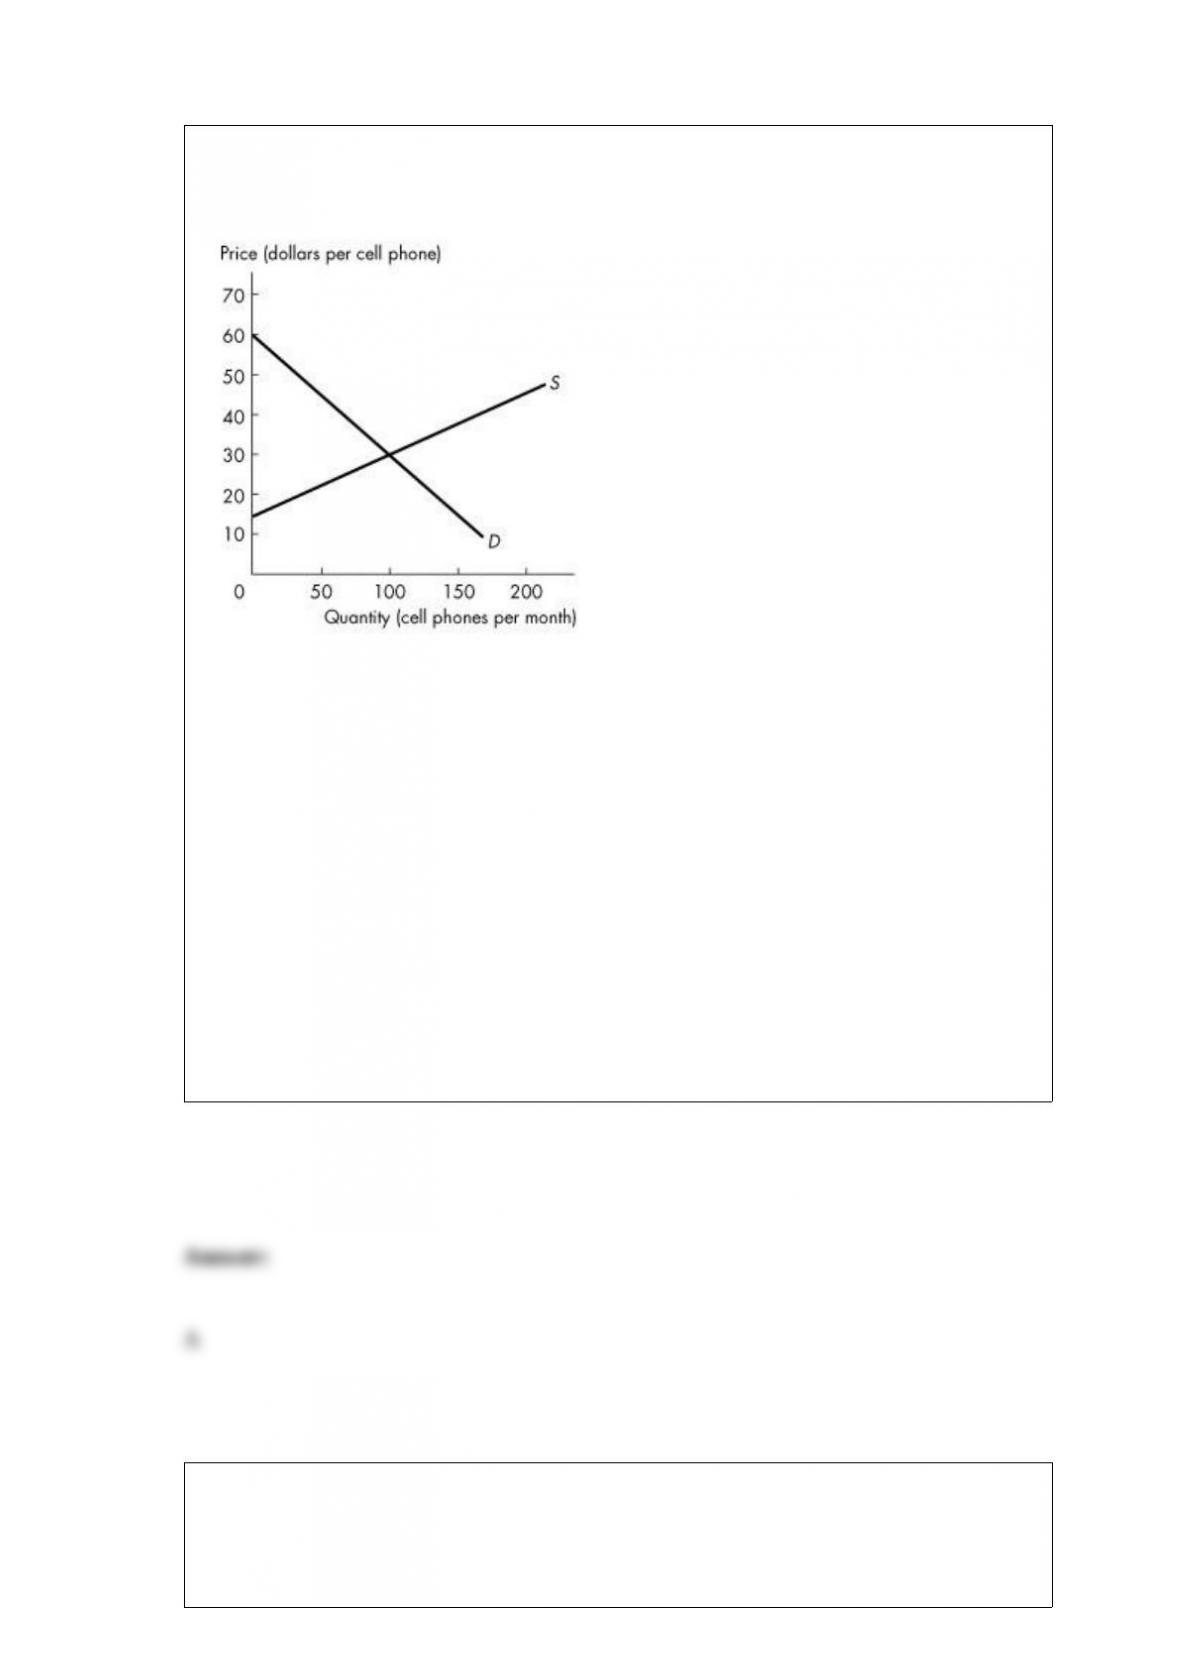
Use the figure below to answer the following question.
Figure 5.3.4
Refer to Figure 5.3.4. The graph shows the market for cell phones. When production is
efficient, total surplus is ________ and the cost of producing the cell phones sold is
________.
A) $2,250; $2,250
B) $2,250; $3,000
C) $1,500; $750
D) $750; $1,500
E) $1,500; $2,250
A country
A) imports those goods in which it has a comparative advantage.

B) exports those goods in which it has a comparative advantage.
C) imports goods produced in countries with lower wage rates.
D) exports goods produced by domestic industries with low wages relative to its trading
partners.
E) exports those goods in which it has an absolute advantage.
If income rises, then in the new consumer equilibrium
A) the marginal utility from normal goods increases.
B) the marginal utility from normal goods decreases.
C) the marginal utility from inferior goods increases.
D) total utility from inferior goods increases.
E) both B and C
Tim Hortons' Risks
Tim Hortons has exploded to become a dominant player among quick-serve restaurants.
In 2001, it took the risk by switching to centralized production of baked goods, which
lowered its labour costs and increased its sales volume.

Lower labour costs
A) increase the supply of Tim's baked goods and lower the equilibrium price.
B) increase the supply of Tim's baked goods, increase the demand for Tim's baked
goods and increase the equilibrium quantity.
C) lower the equilibrium price of Tim's baked goods but do not change the equilibrium
quantity.
D) increase the demand for Tim's baked goods and raise the price.
E) increase the quantity supplied of Tim's baked goods.
A tit-for-tat strategy can be used
A) in a single-play game or a repeated game.
B) in a single-play game but not a repeated game.
C) in a repeated game but not a single-play game.
D) in neither a repeated game nor a single-play game.
E) only when there is no Nash equilibrium.

Use the information below to answer the following questions.
Fact 2.4.2
Agnes can produce either 1 unit of X or 1 unit of Y in an hour, while Brenda can
produce either 2 units of X or 4 units of Y in an hour.
Refer to Fact 2.4.2. Which one of the following statements is true?
A) Brenda has an absolute advantage over Agnes in the production of both goods.
B) Agnes has a comparative advantage in the production of Y.
C) Brenda has a comparative advantage in the production of X.
D) Brenda will not gain from trade.
E) Agnes will not gain from trade.
Refer to Figure 16.3.1. The figure shows the marginal private benefit curve, the
marginal social benefit curve, and the market supply curve. If production is left to the
private market, then
A) the quantity produced is less than the efficient quantity.
B) the quantity produced is greater than the efficient quantity.
C) price is greater than marginal social benefit quantity.
D) the marginal cost curve is horizontal.
E) the quantity produced is zero.

When the Herfindahl-Hirschman Index (HHI) is greater than 1,800,
A) the market is very competitive.
B) a monopoly exists.
C) there are many producers in the market.
D) the market is moderately competitive.
E) the market is uncompetitive.
The law of supply tells us that other things remaining the same, as the
A) price of gasoline falls, the quantity of gasoline supplied decreases.
B) price of gasoline rises, the quantity of gasoline supplied decreases.
C) supply of gasoline increases, the price of gasoline falls.
D) cost of producing gasoline falls, the supply of gasoline will increase.
E) cost of producing gasoline increases, the price of gasoline rises.

Figure 2.1.3 illustrates Mary's production possibilities frontier. If Mary wants to move
from point D to point C,
A) it will be necessary to improve technology.
B) it will be necessary to increase the accumulation of capital.
C) it will be necessary to give up some of good X to obtain more of good Y.
D) it will be necessary to give up some of good Y to obtain more of good X.
E) she can accomplish this without any opportunity cost.
The multiplier can take on any value
A) only between zero and 1.
B) only between -1 and 1.
C) only between 1 and 2.
D) only greater than 1.
E) greater than zero.
Social interest theory states that

A) public officials favour consumers over producers.
B) regulations promote the attainment of an efficient outcome.
C) regulations promote the attainment of an inefficient outcome.
D) regulation maximizes economic profit.
E) rate of return regulation is best for all parties.
Refer to Figure 16.2.1. The figure shows the marginal private cost curve, the marginal
social cost curve and the market demand curve. If a constant per unit tax is imposed that
generates an efficient allocation of resources, then the quantity produced is
A) zero.
B) Q1.
C) Q2.
D) Q3.
E) greater than Q3.
Given an upward-sloping, straight line total variable cost curve, what does the marginal
cost curve look like?

A) an upward-sloping straight line
B) a downward-sloping straight line
C) a U-shaped curve
D) a horizontal line
E) a vertical line
In the market for farm crops momentary supply is ________. In the market for farm
crops, short-run supply is ________.
A) less elastic than short-run supply; less elastic than long-run supply
B) more elastic than short-run supply; more elastic than long-run supply
C) negative; positive
D) positive; negative
E) perfectly elastic; perfectly inelastic
If A and B are substitutes and the cost of a factor of production used in the production
of A increases, then the price of

A) B falls, but the price of A rises.
B) B rises, but the price of A falls.
C) A falls, and the price of B will stay unchanged.
D) A and B fall.
E) A and B rise.
All of the following statements are true except
A) the Lucas wedge is the dollar value of the accumulated gap between what real GDP
per person would have been if the 1960s growth rate had persisted and what real GDP
per person turned out to be.
B) the Lucas wedge accumulated to $640,000 per person by 2013.
C) the Lucas wedge equals real GDP minus potential GDP.
D) the Lucas wedge arises from the slowdown of productivity growth that began during
the 1970s.
E) real GDP per person was $45,000 per year lower in 2013 than it would have been
with no growth slowdown.


