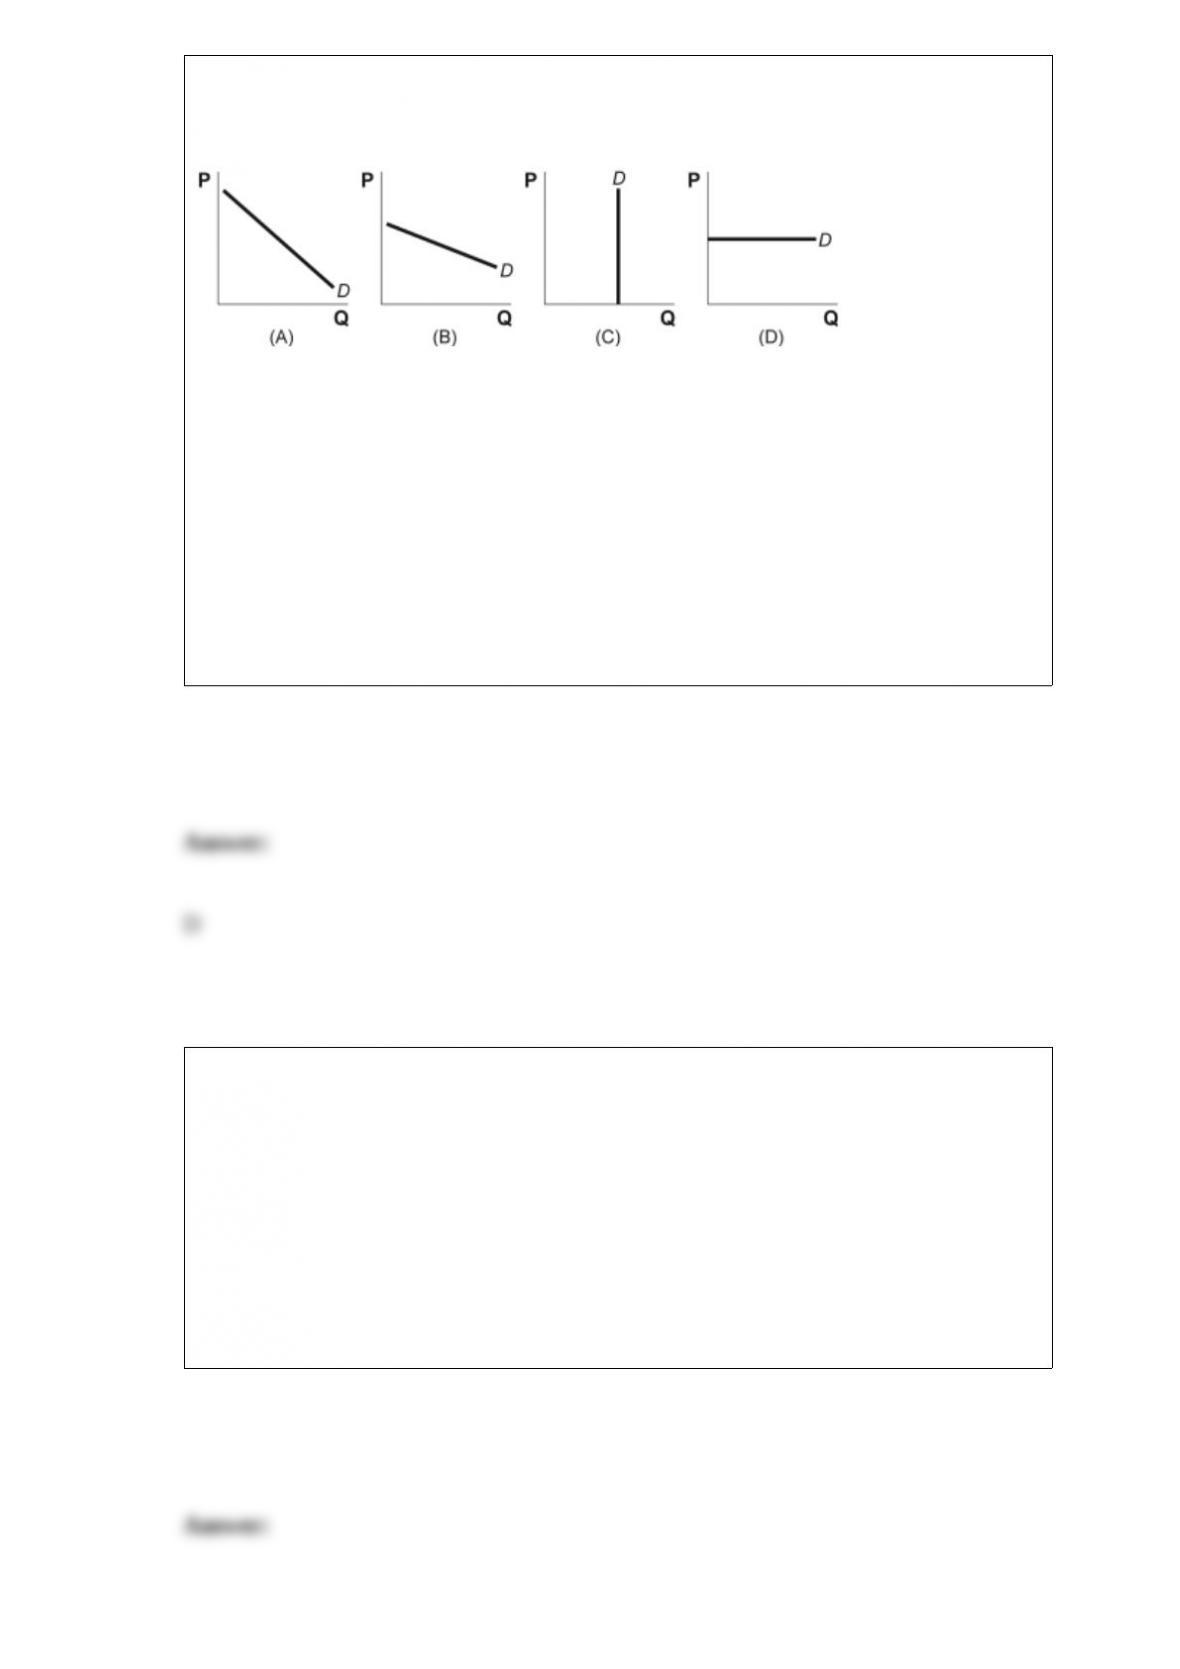
Figure: Demand Curves
(Figure: Demand Curves) Look at the figure Demand Curves. Which graph shows a
perfectly elastic demand curve?
A) A
B) B
C) C
D) D
Marginal cost can be calculated as:
A) DTC / DQ, where TC is total cost and Q is output.
B) DVC / DQ, where VC is variable cost and Q is output.
C) the slope of the total cost curve.
D) DTC / DQ, where TC is total cost and Q is output; DVC / DQ, where VC is variable
cost and Q is output; and as the slope of the total cost curve.

The burden of a tax on a good falls at least partially on consumers if:
A) the price paid by consumers for the good declines.
B) the price paid by consumers for the good increases.
C) the wages received by workers who produce the good decline.
D) the wages received by workers who produce the good increase.
Assume that corn is an input in the production of beef but not in the production of pork.
Further, beef and pork are substitutes in consumption. A decrease in the price of corn
will _____ the supply of beef and _____ the demand for pork.
A) increase; increase
B) decrease; increase
C) decrease; decrease
D) increase; decrease
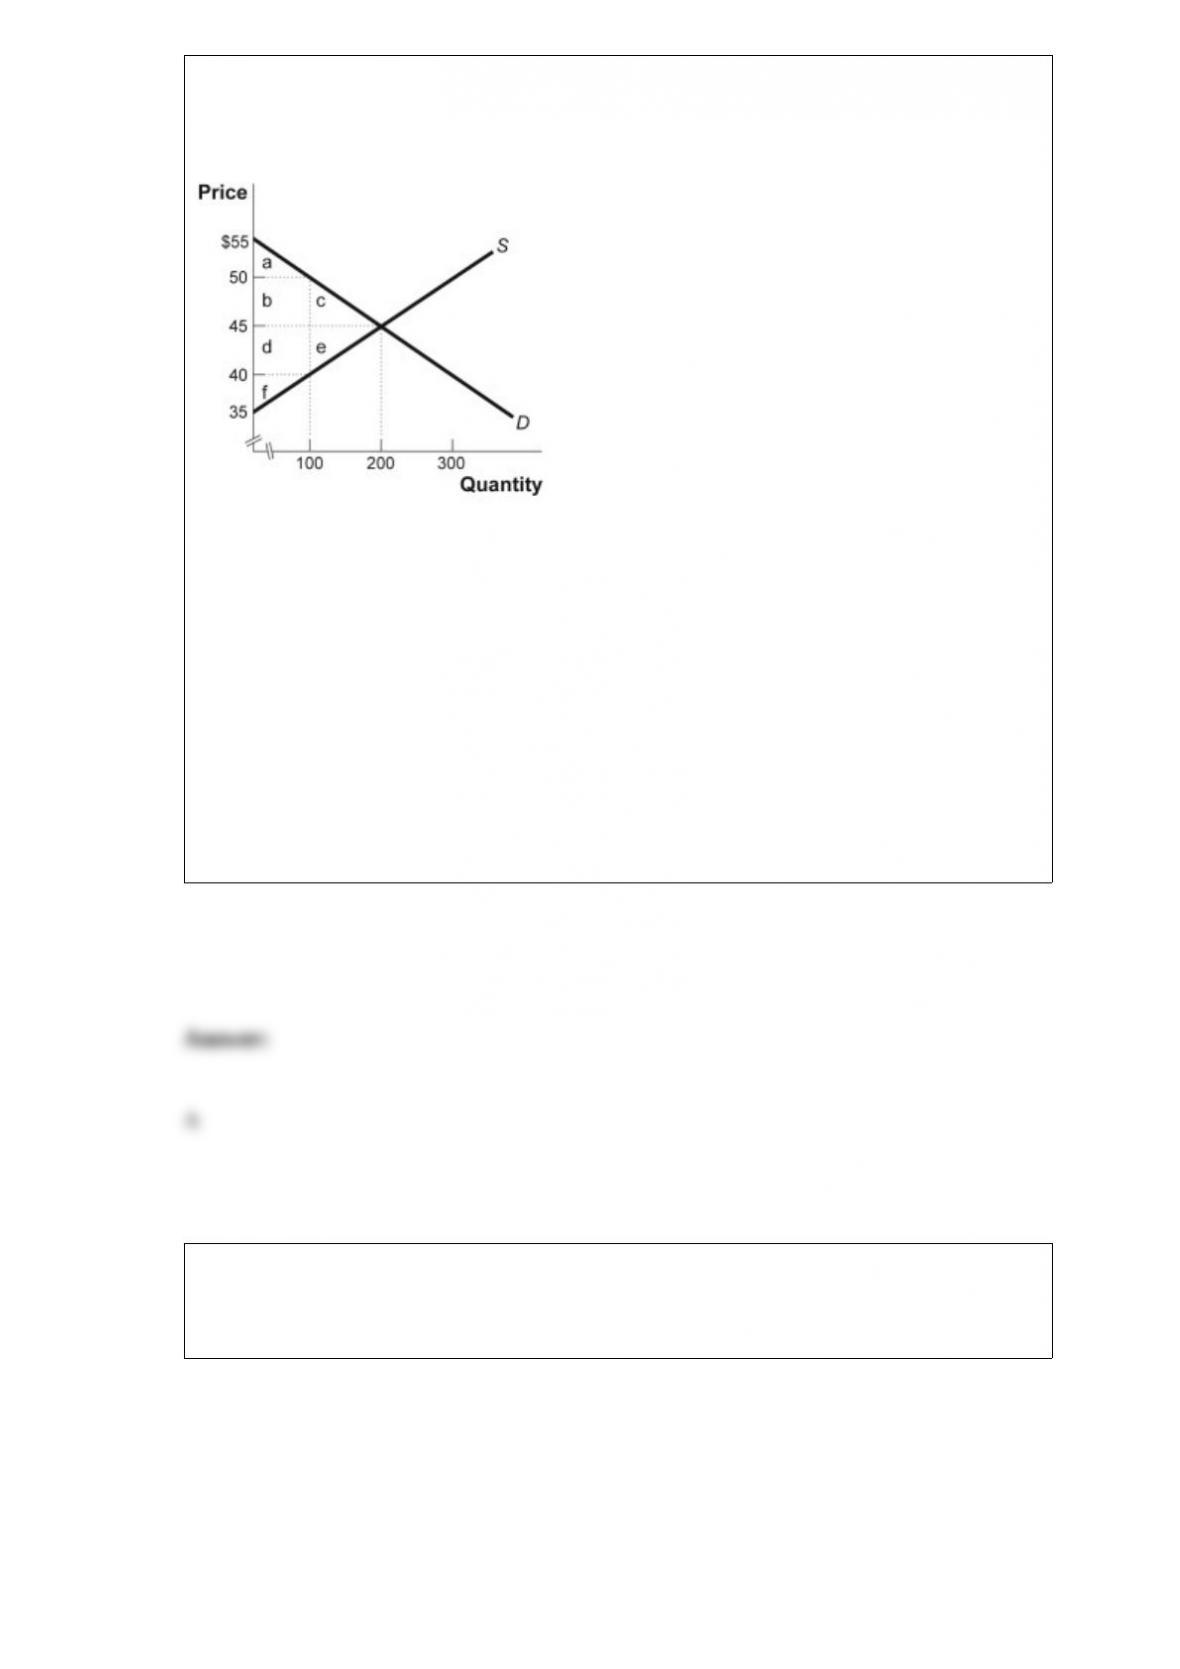
Figure: The Market for Blue Jeans
(Figure: The Market for Blue Jeans) Look at the figure The Market for Blue Jeans. The
government recently levied a $10 tax on the producers of blue jeans. What is the tax
revenue?
A) $1,000
B) $500
C) $4,000
D) $5,000
Figure: The Market for Hamburgers
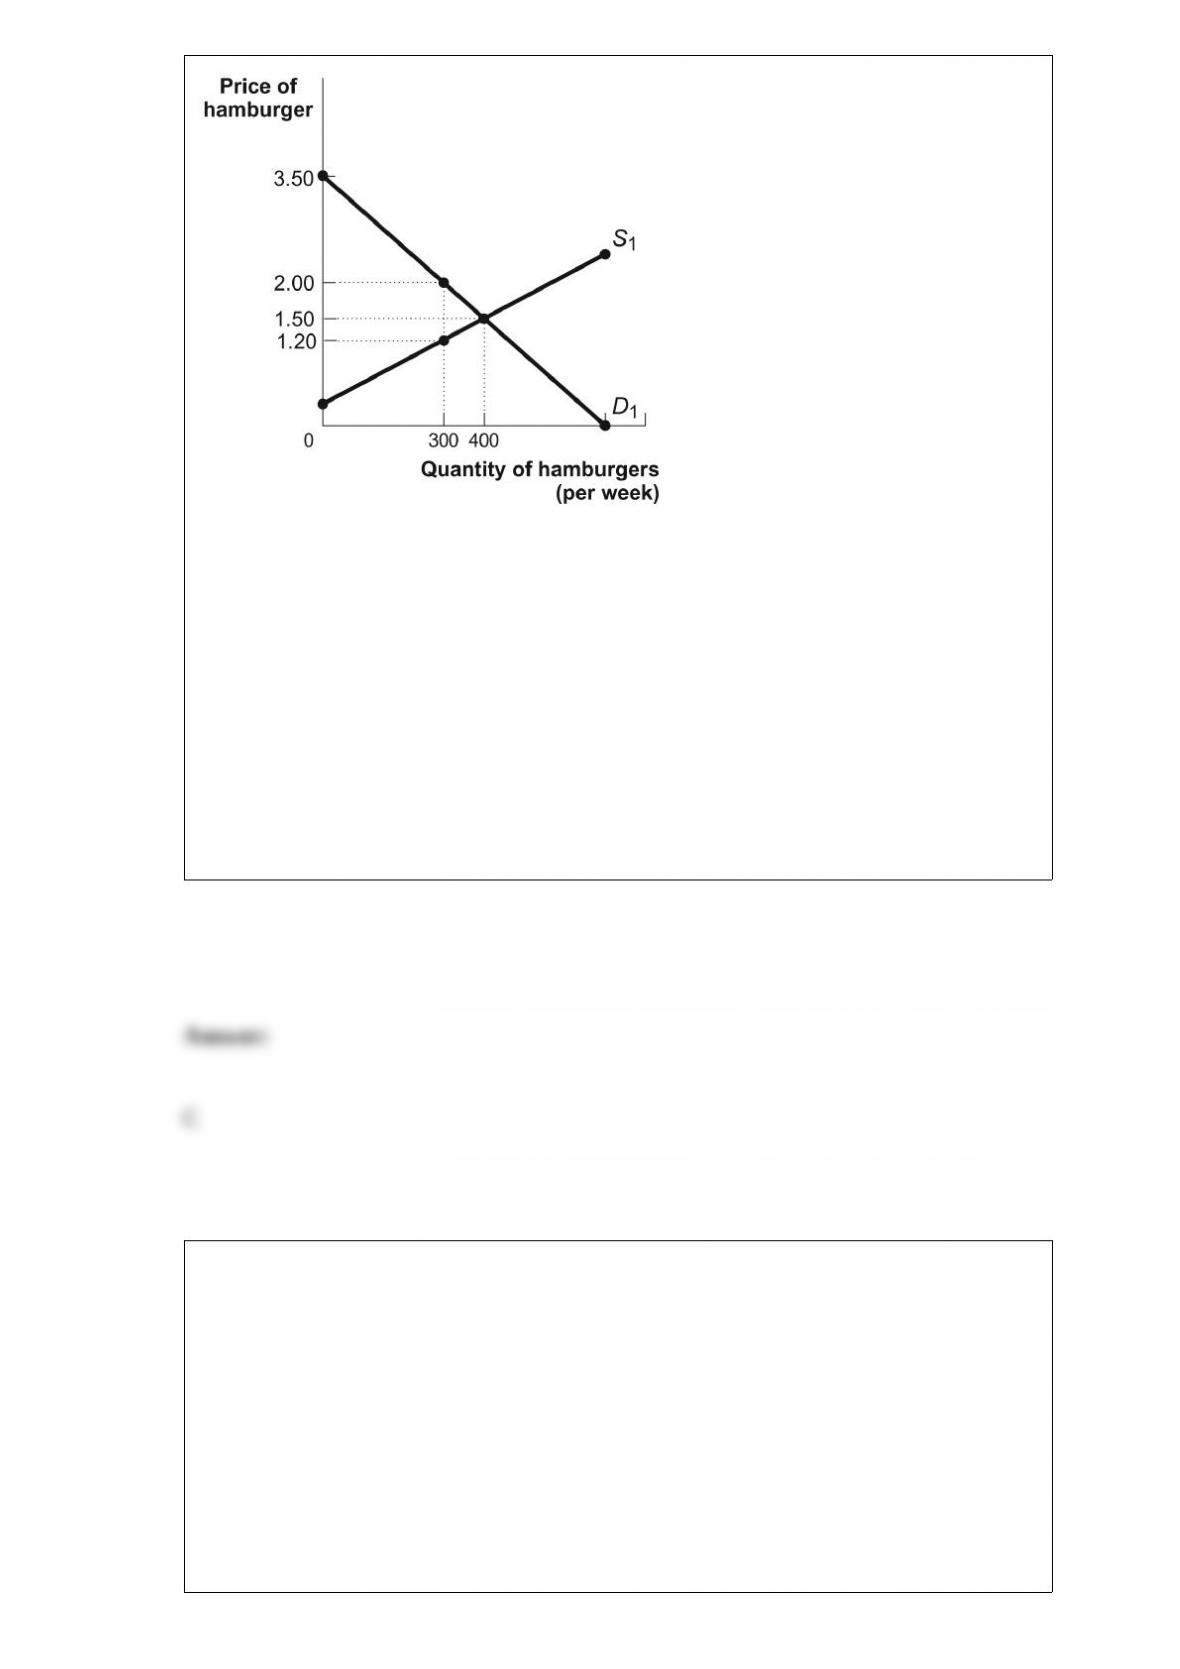
(Figure: The Market for Hamburgers) Look at the figure The Market for Hamburgers. If
the market is originally in equilibrium and the government imposes an excise tax of
$0.80 per hamburger, producer surplus will be reduced by:
A) $175.
B) $240.
C) $105.
D) $90.
A dozen friends got together to celebrate a birthday. If the birthday cake is cut into 12
pieces of the same size and each of the 12 partygoers gets a slice, this cake distribution
is:
A) efficient but not equitable.
B) equitable but not efficient.
C) efficient and equitable.
D) equitable.
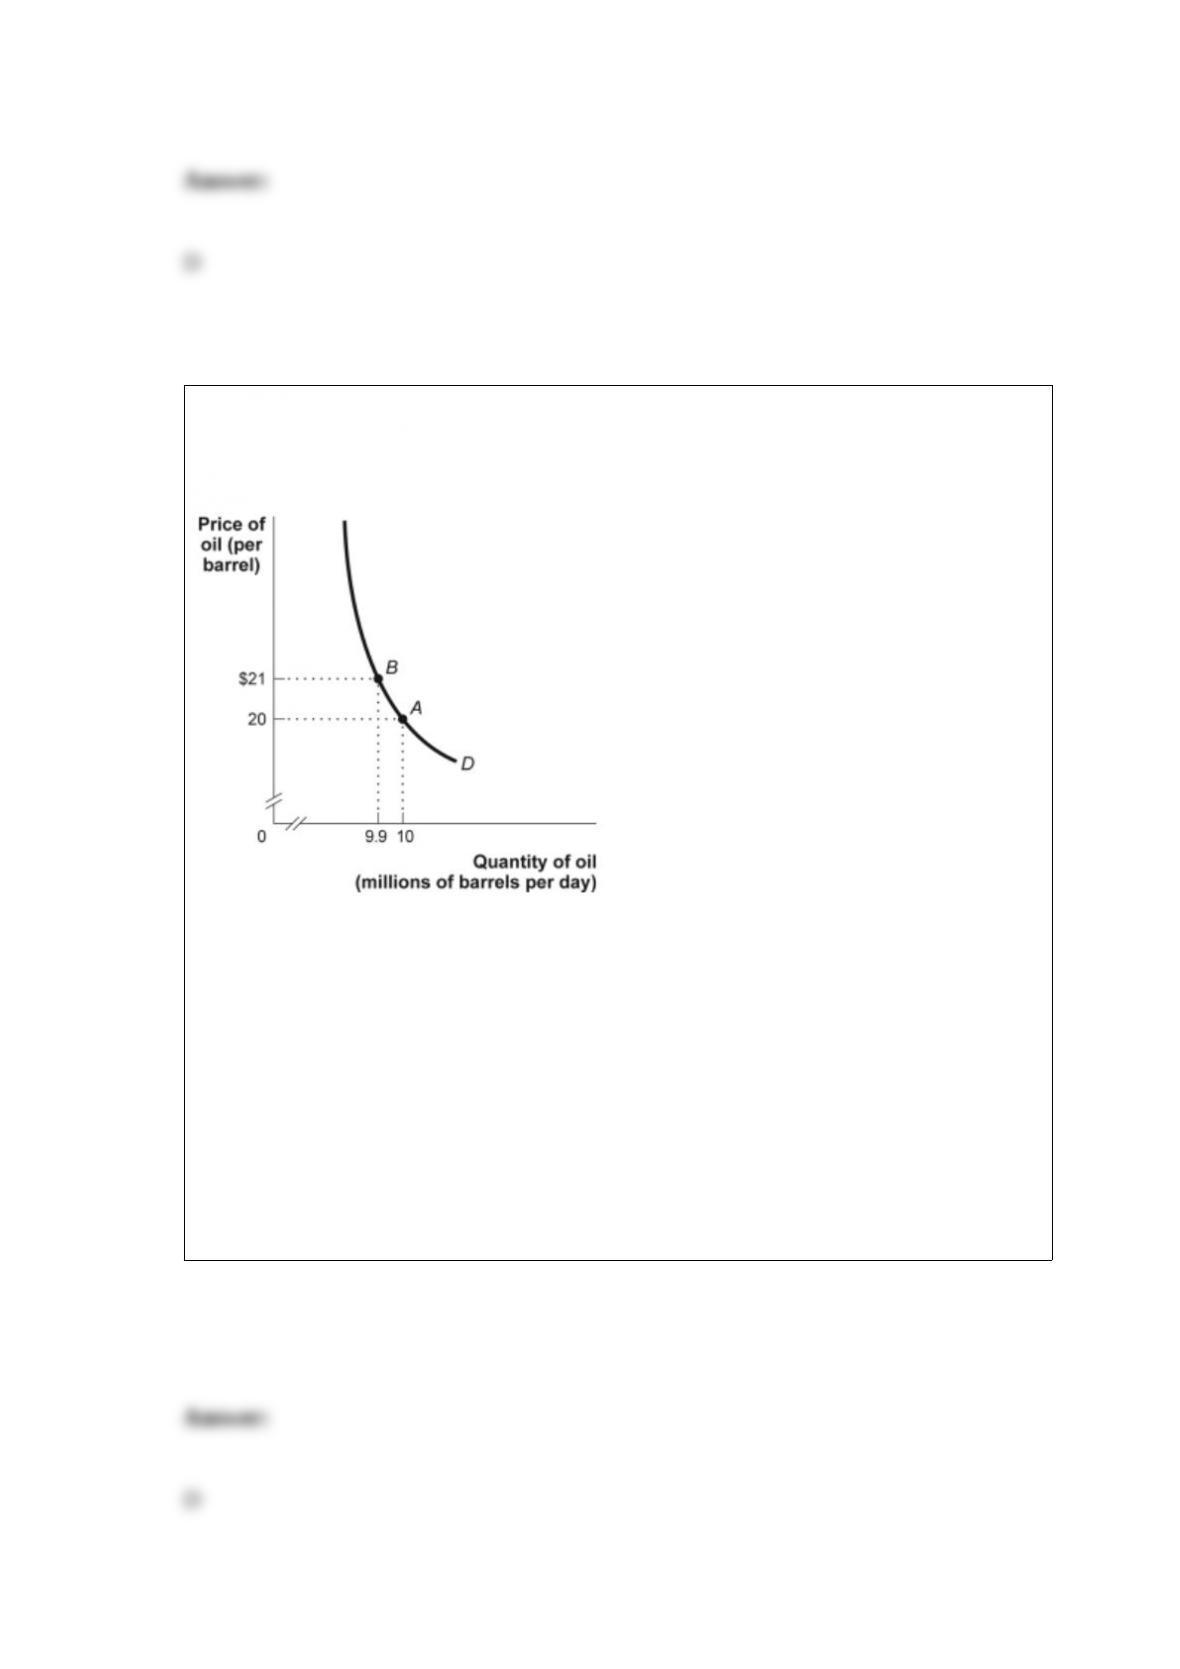
Figure: The Demand Curve for Oil
(Figure: The Demand Curve for Oil) Look at the figure The Demand Curve for Oil.
Demand is price _____ between $20 and $21, since total revenue _____ when the price
_____.
A) elastic; increases; decreases
B) inelastic; stays the same; decreases
C) elastic; decreases; increases
D) inelastic; increases; increases
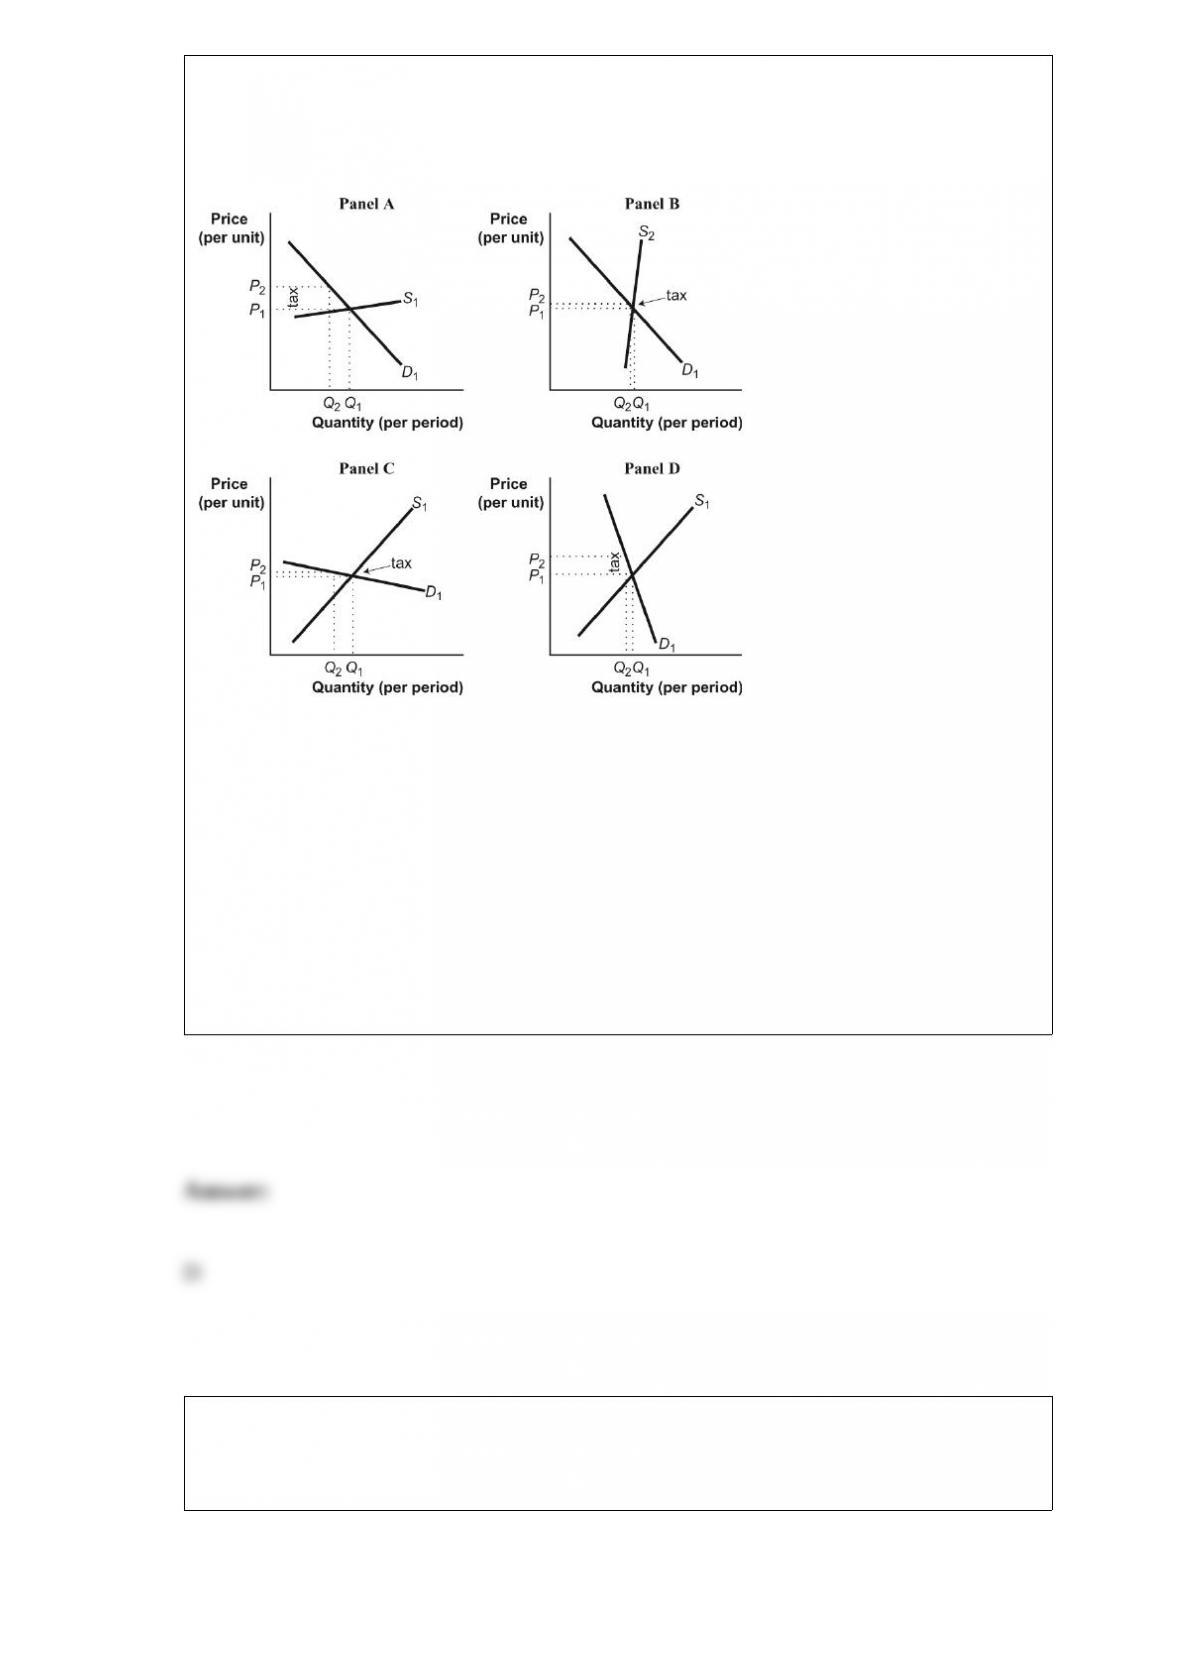
Figure: Tax Incidence
(Figure: Tax Incidence) Look at the figure Tax Incidence. Producers are likely to bear
more of the burden of an excise tax in the situations illustrated by panels:
A) A and B.
B) A and C.
C) B and D.
D) B and C.
Figure: Consumer Equilibrium IV
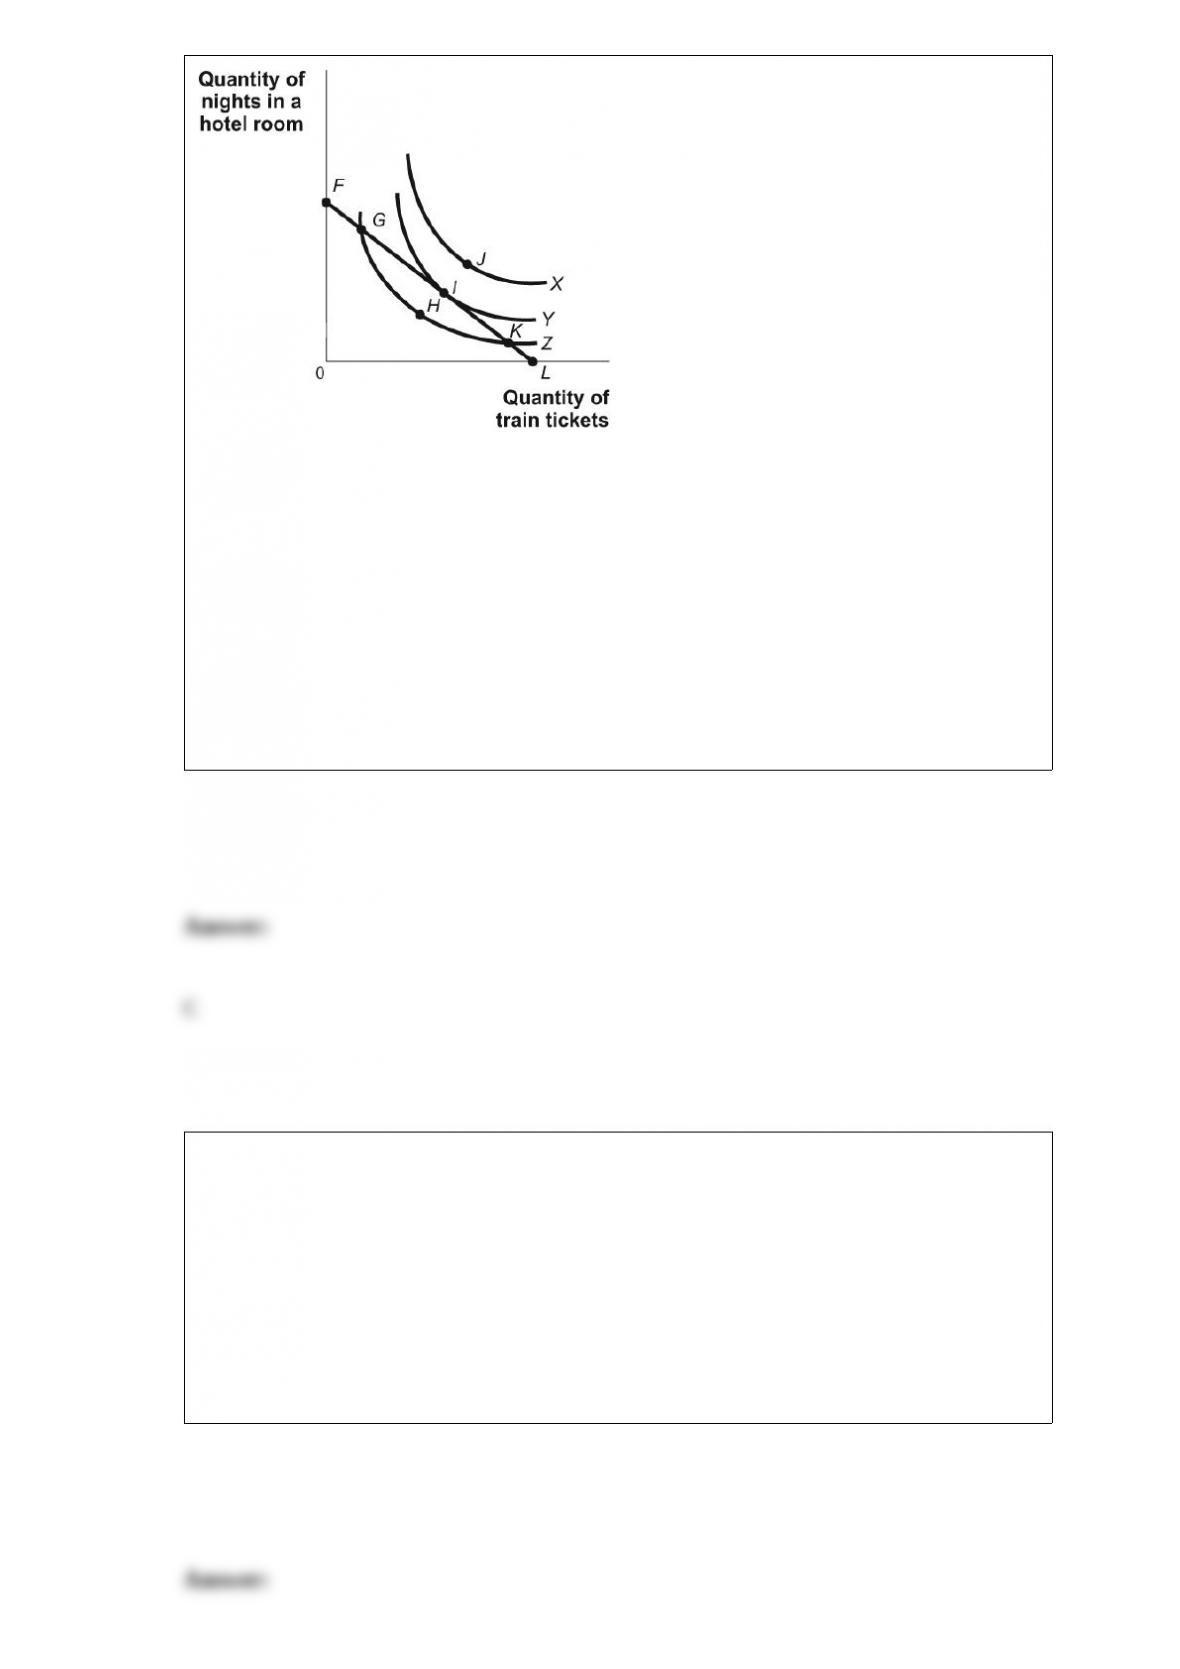
(Figure: Consumer Equilibrium IV) Look at the figure Consumer Equilibrium IV. The
lowest level of utility shown in the figure is associated with indifference curve:
A) X.
B) Y.
C) Z.
D) X or Y.
A common example of monopolistic competition is the market for:
A) oranges.
B) 1-inch nails.
C) automobiles.
D) gas stations.
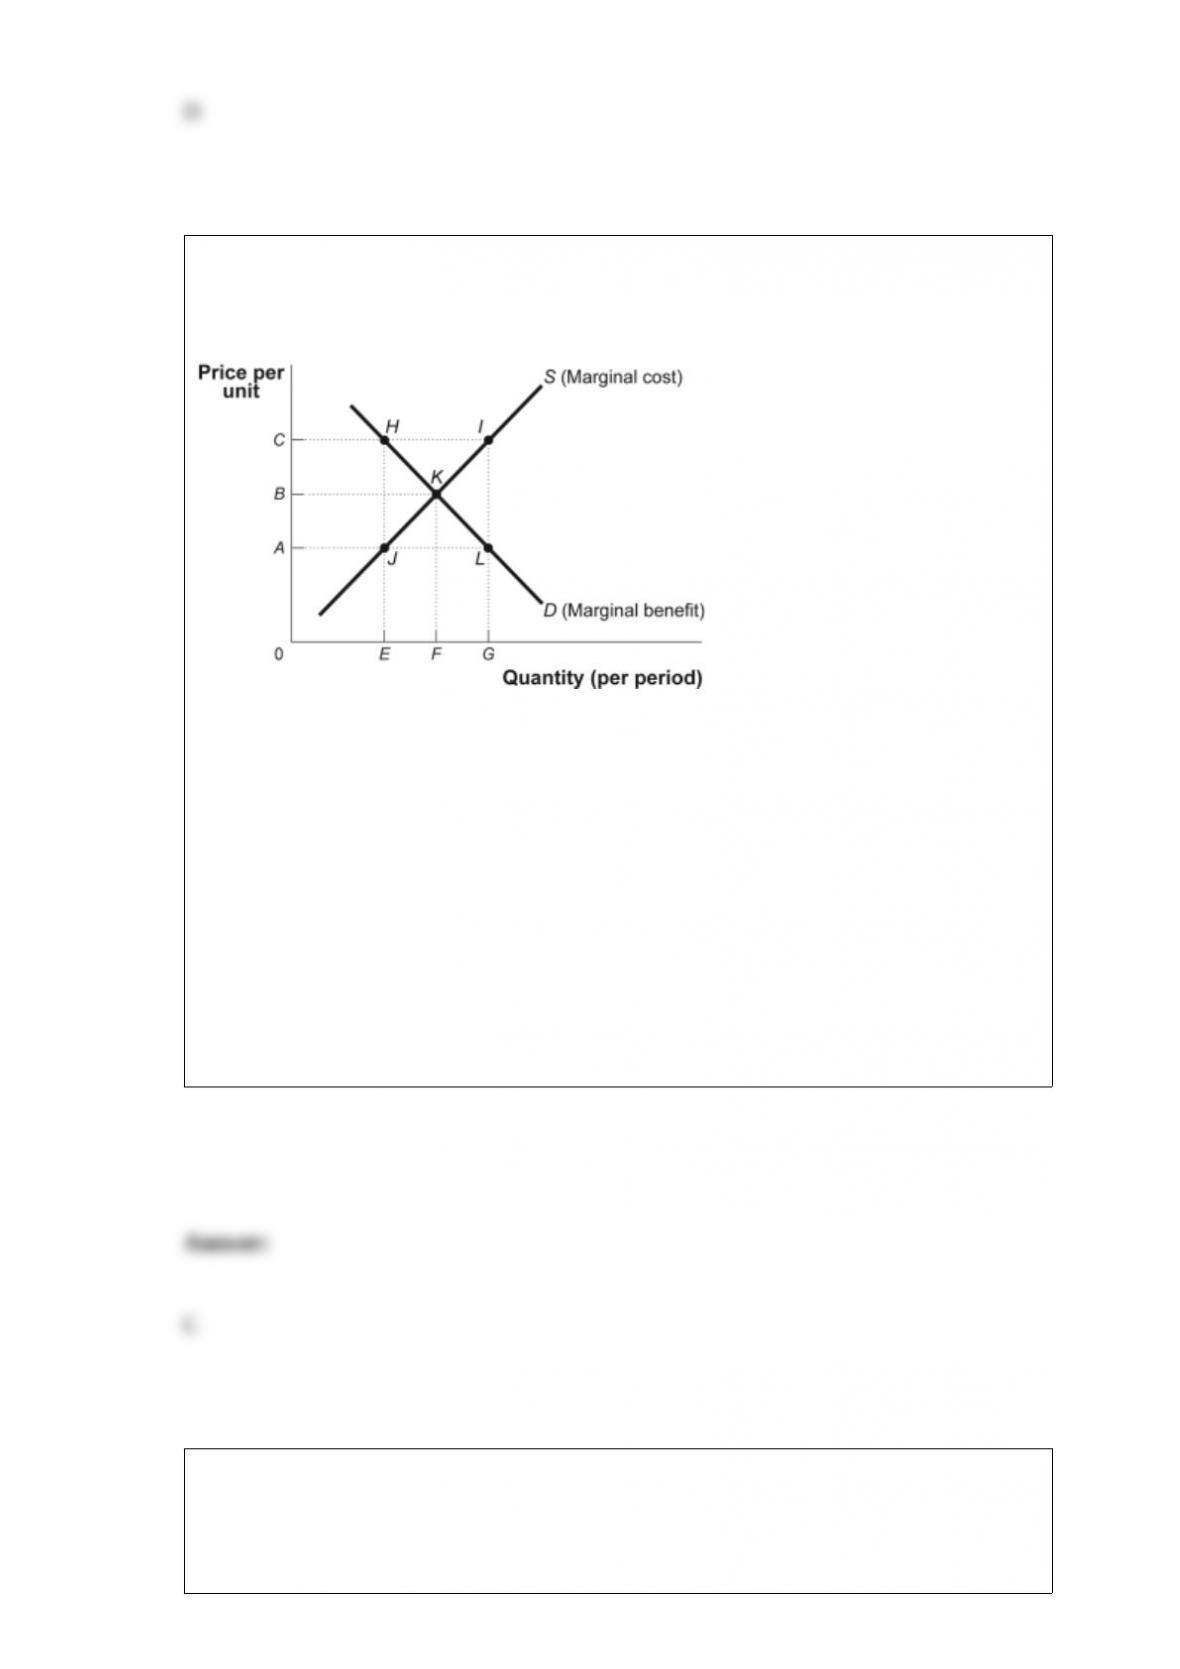
Figure: Market Failure
(Figure: Market Failure) Look at the figure Market Failure. Suppose it represents the
demand for and marginal cost per pound of shrimp in the bay. The additional cost of the
shrimp due to the depletion of the common resource is equal to AC. Without
government intervention, the price of shrimp will be _____ per pound.
A) 0
B) A
C) B
D) C
In long-run equilibrium in monopolistic competition, marginal cost is:
A) greater than price.
B) equal to price.
C) less than price.
D) related to price but not in a predictable way.
Figure: Rent Controls
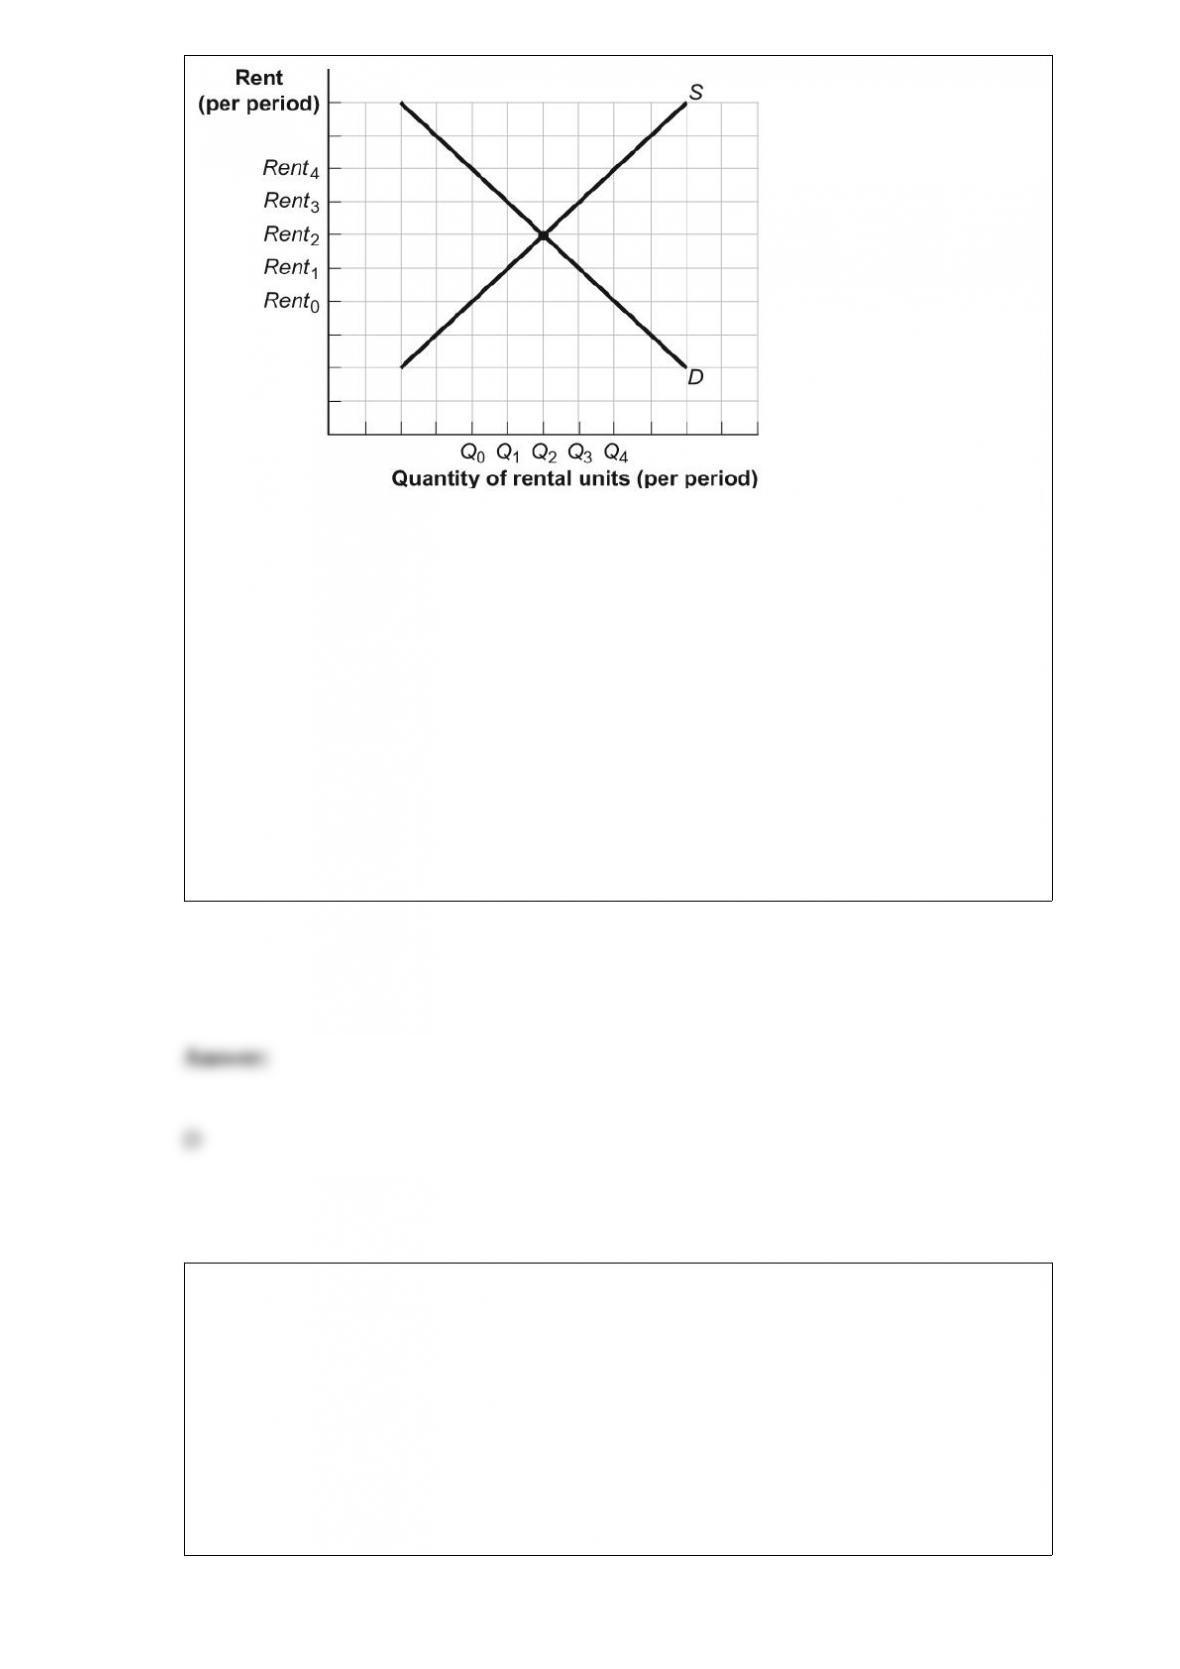
(Figure: Rent Controls) Look at the figure Rent Controls. If rent controls are set at
Rent3:
A) the shortage of rental units is the distance Q3” Q1.
B) some renters will be willing to pay a price as high as Rent4 for Q3 units.
C) no one will have to pay a higher actual price than Rent0, nor will anyone be willing
to do so.
D) rent will remain at Rent2.
An example of a social insurance program is:
A) expenditure on national defense.
B) Social Security payments to the disabled.
C) the food stamp program.
D) purchasing a new city police car.
A perfectly competitive industry is said to be efficient because the:
A) marginal cost of production of the last unit of output is minimized.
B) product is standardized across firms in the industry.
C) average total cost of production of the industry’s output is minimized.
D) market price of the good is equal to economic profit for all firms in the industry.
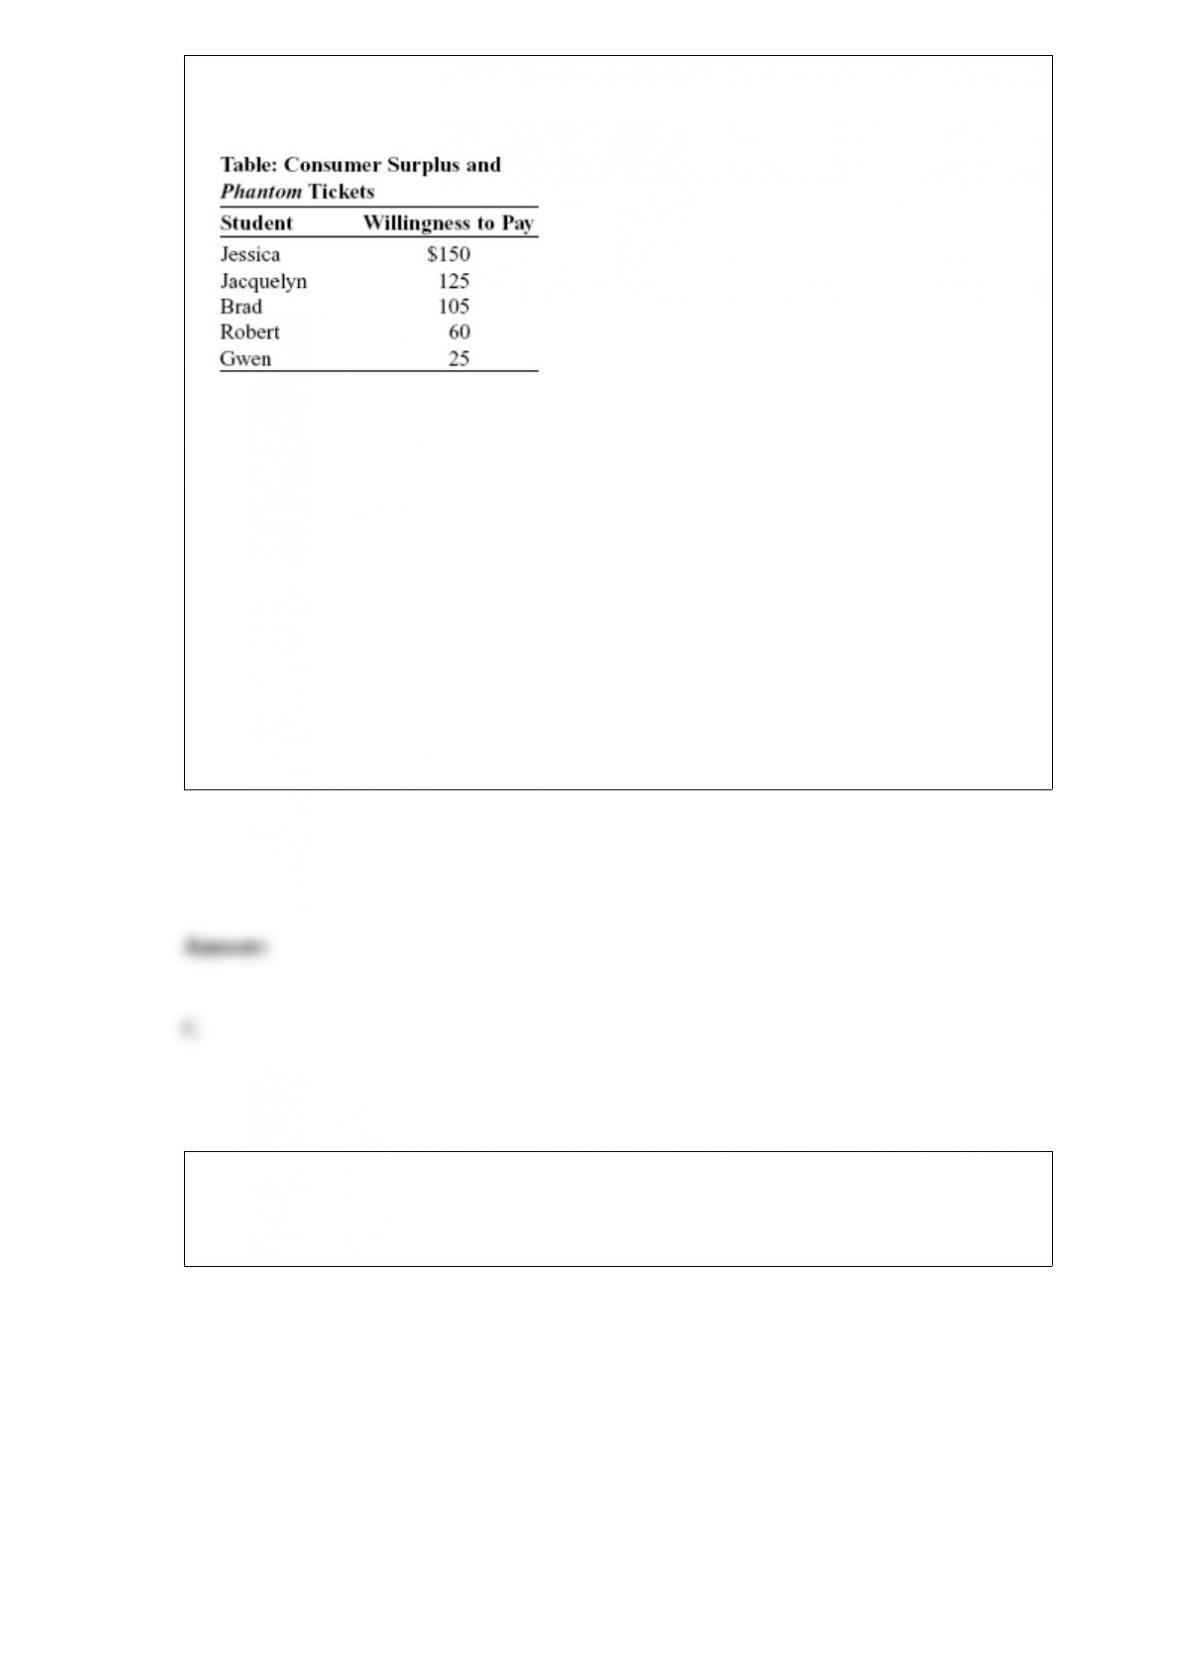
(Table: Consumer Surplus and Phantom
Tickets) The table Consumer Surplus and Phantom Tickets shows each student’s
willingness to pay for a Phantom of the Opera ticket. Assume that each student wants to
buy one ticket. If the box office price of a ticket to see Phantom of the Opera is $130
and there is no other market for tickets, the total consumer surplus for the five students
is:
A) $150.
B) $125.
C) $20.
D) $0.
Figure: Indifference Curves and Consumption Bundles
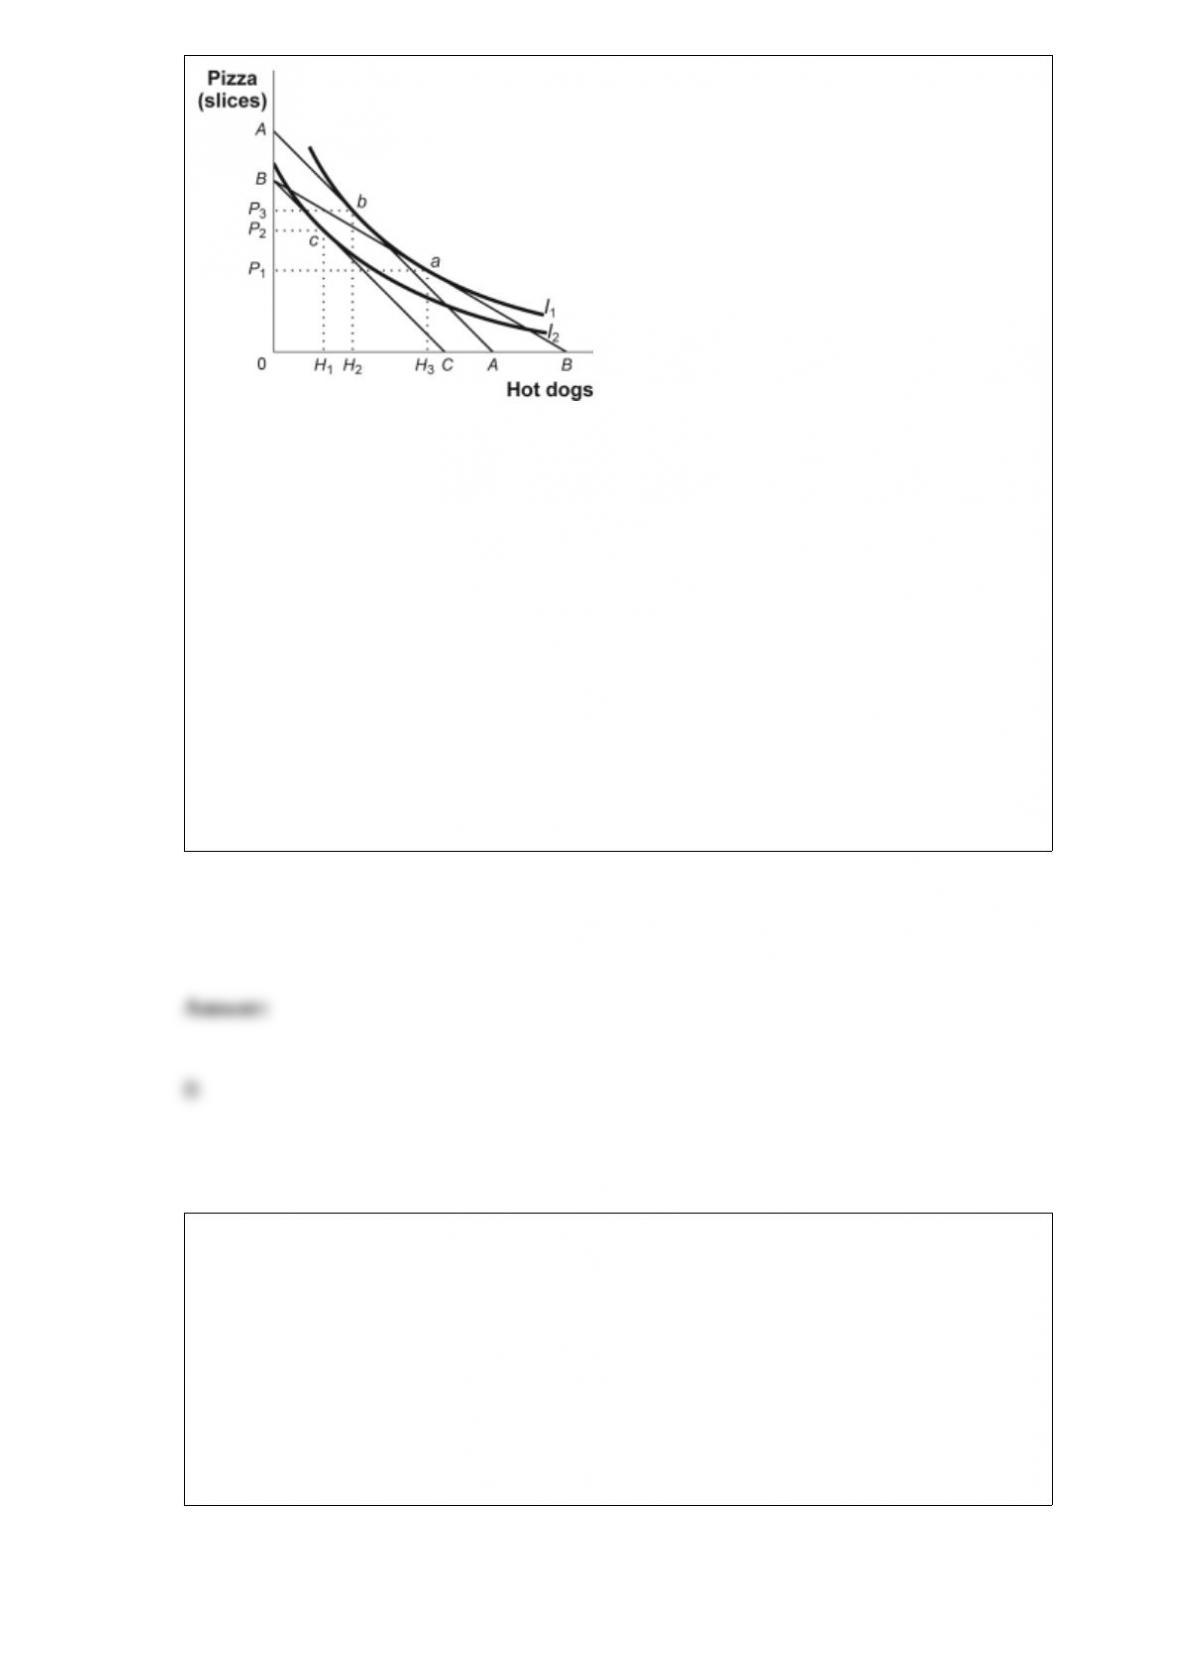
(Figure: Indifference Curves and Consumption Bundles) Let MUP = marginal utility of
pizza, MUH = marginal utility of hot dogs, PP = price of a slice of pizza, and PH = price
of a hot dog. In the figure, the absolute value of the slope of an indifference curve is
equal to:
A) MUP / MUH.
B) MUH / MUP.
C) PH / PP.
D) PP / PH.
If a monopolist is producing a quantity that generates MC > MR, then profit:
A) is maximized.
B) is maximized only if MC = P.
C) can be increased by increasing production.
D) can be increased by decreasing production.
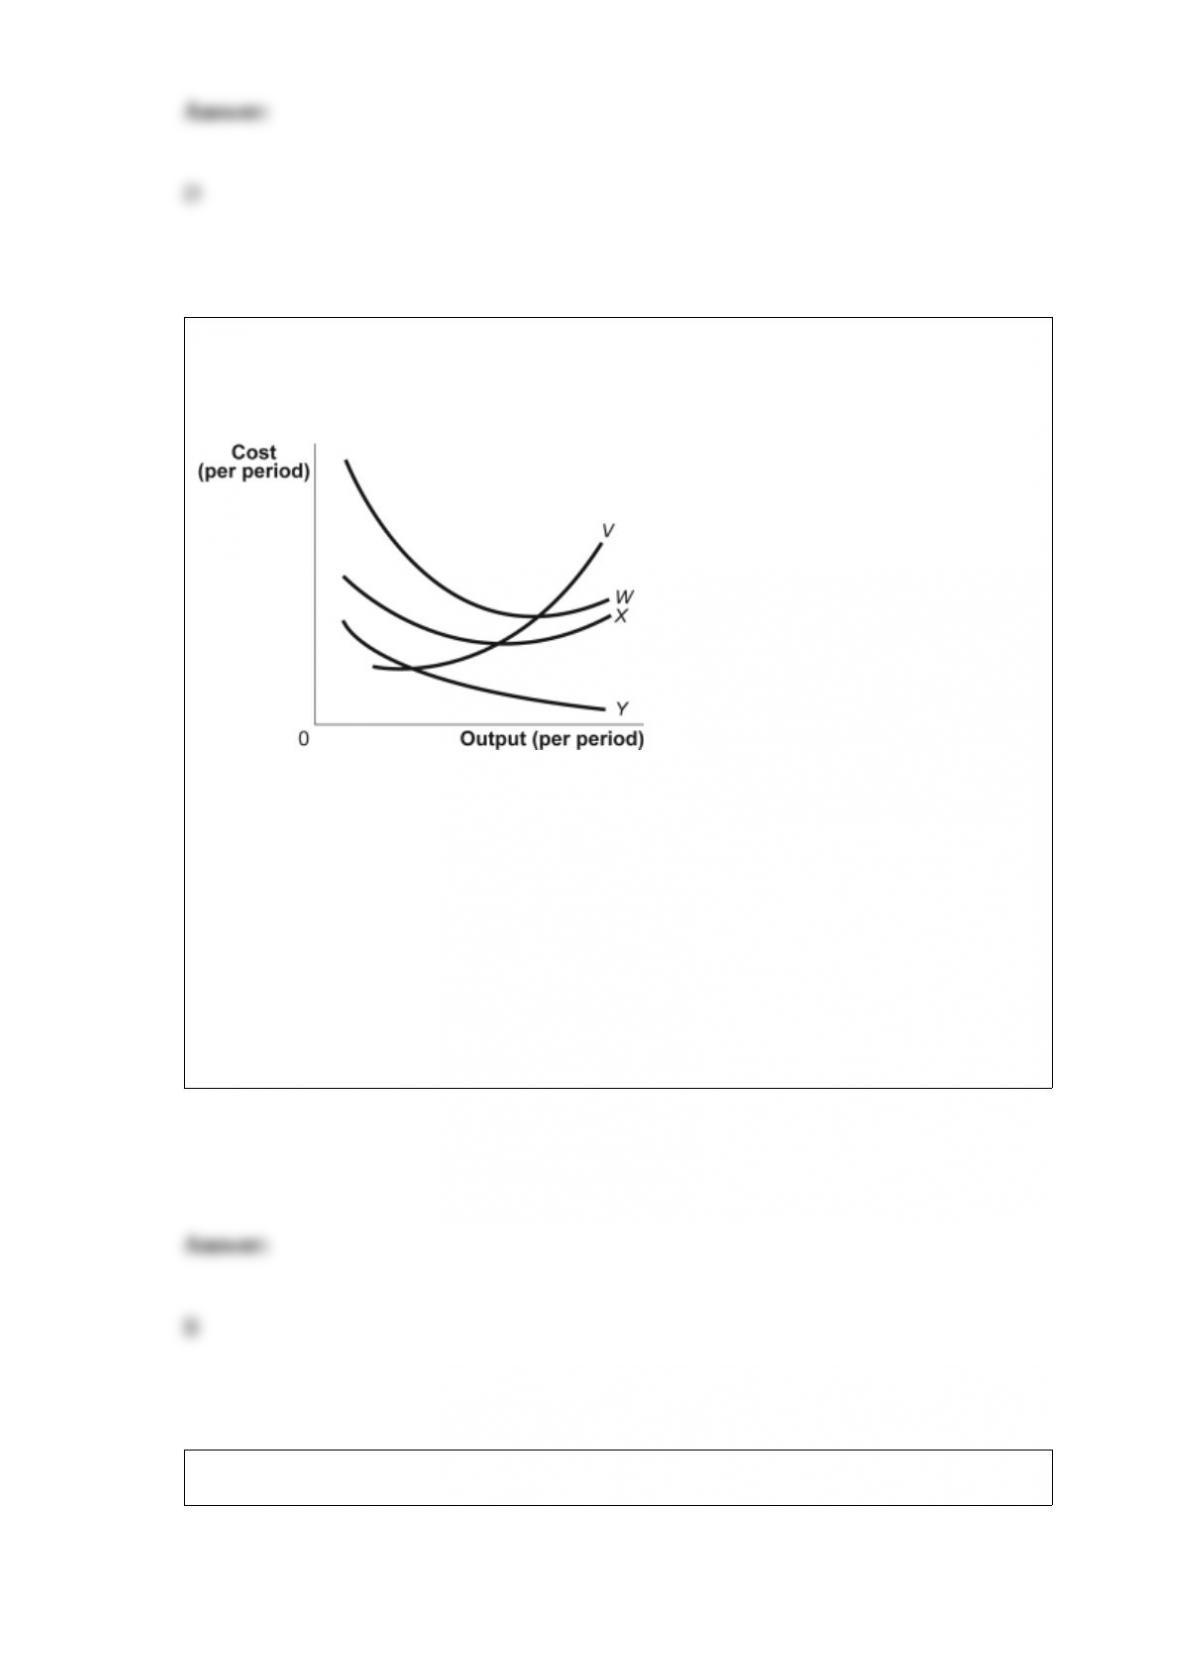
Figure: A Firm’s Cost Curves
(Figure: A Firm’s Cost Curves) Look at the figure A Firm’s Cost Curves. The curve
labeled W represents the firm’s _____ cost curve.
A) average fixed
B) average total
C) average variable
D) total variable
The assumption that more is preferred to less explains why indifference curves:
A) that lie closer to the origin represent higher levels of utility.
B) that lie farther from the origin represent higher levels of utility.
C) cross frequently.
D) slope upward and away from the origin.
Figure: The Market for Lattes
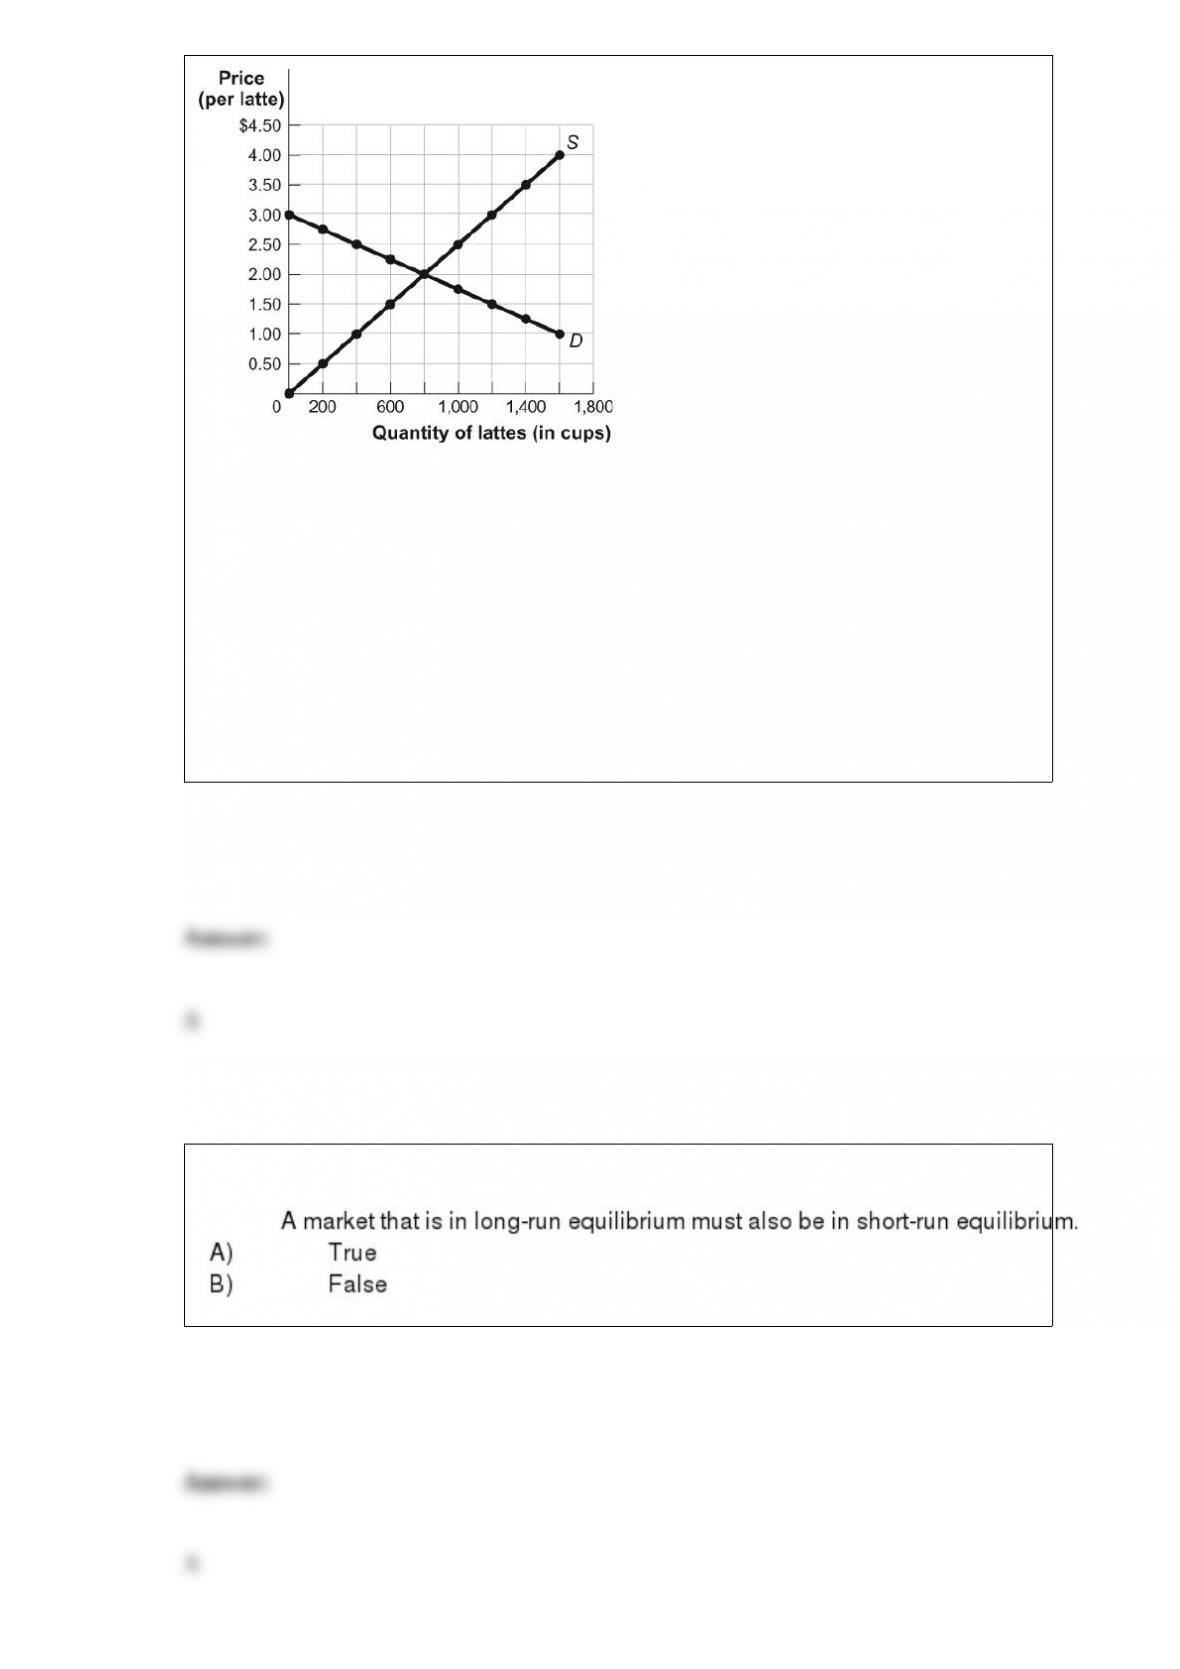
(Figure: The Market for Lattes) If the excise tax increases from $1.50 to $2.25 per latte,
government revenue will _____ by _____.
A) decrease; $150
B) decrease; $75
C) increase; $150
D) increase; $225

If the market for grapefruit is in equilibrium without any outside intervention to change
the equilibrium price:
A) total surplus is minimized.
B) there is some deadweight loss.
C) a few mutually beneficial trades are missed.
D) consumer and producer surplus are maximized.
A determinant of the demand for a factor of production is the:
A) price of the factor.
B) productivity of the factor.
C) quantity of the factor supplied.
D) compensating differential.
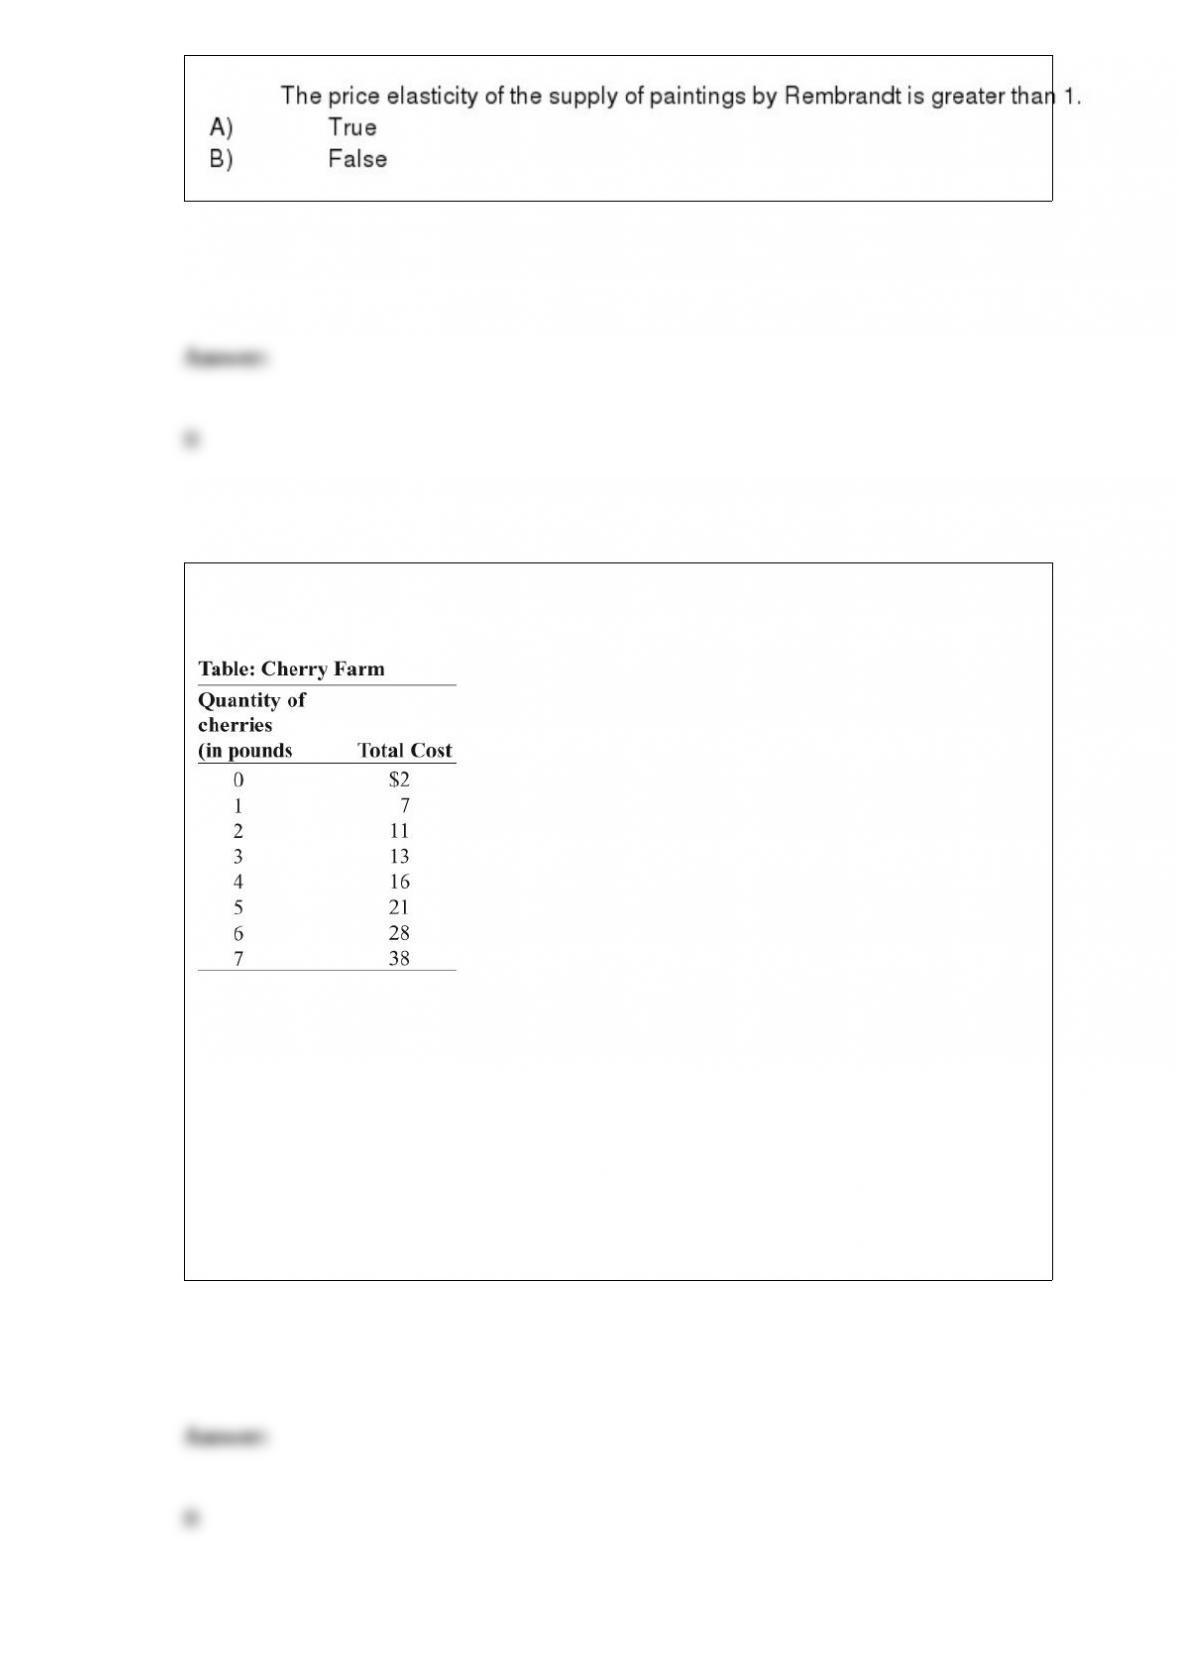
(Table: Cherry Farm) Look at the table Cherry Farm. If the price is $3.60 per pound:
A) firms will enter the industry.
B) firms will exit the industry.
C) the industry is in long-run equilibrium.
D) the industry has minimized average total cost.
Suppose each person in a community had to pay for his or her own education from
kindergarten through high school. One would expect that:
A) less education would be acquired, since society has not considered the positive
external benefits of education.
B) more education would be acquired, since society has not considered the positive
external benefits of education.
C) the optimal amount of education would be acquired by community members, since
they each paid for the amount of education they wanted.
D) a Pigouvian tax would ensure the optimal amount of education.
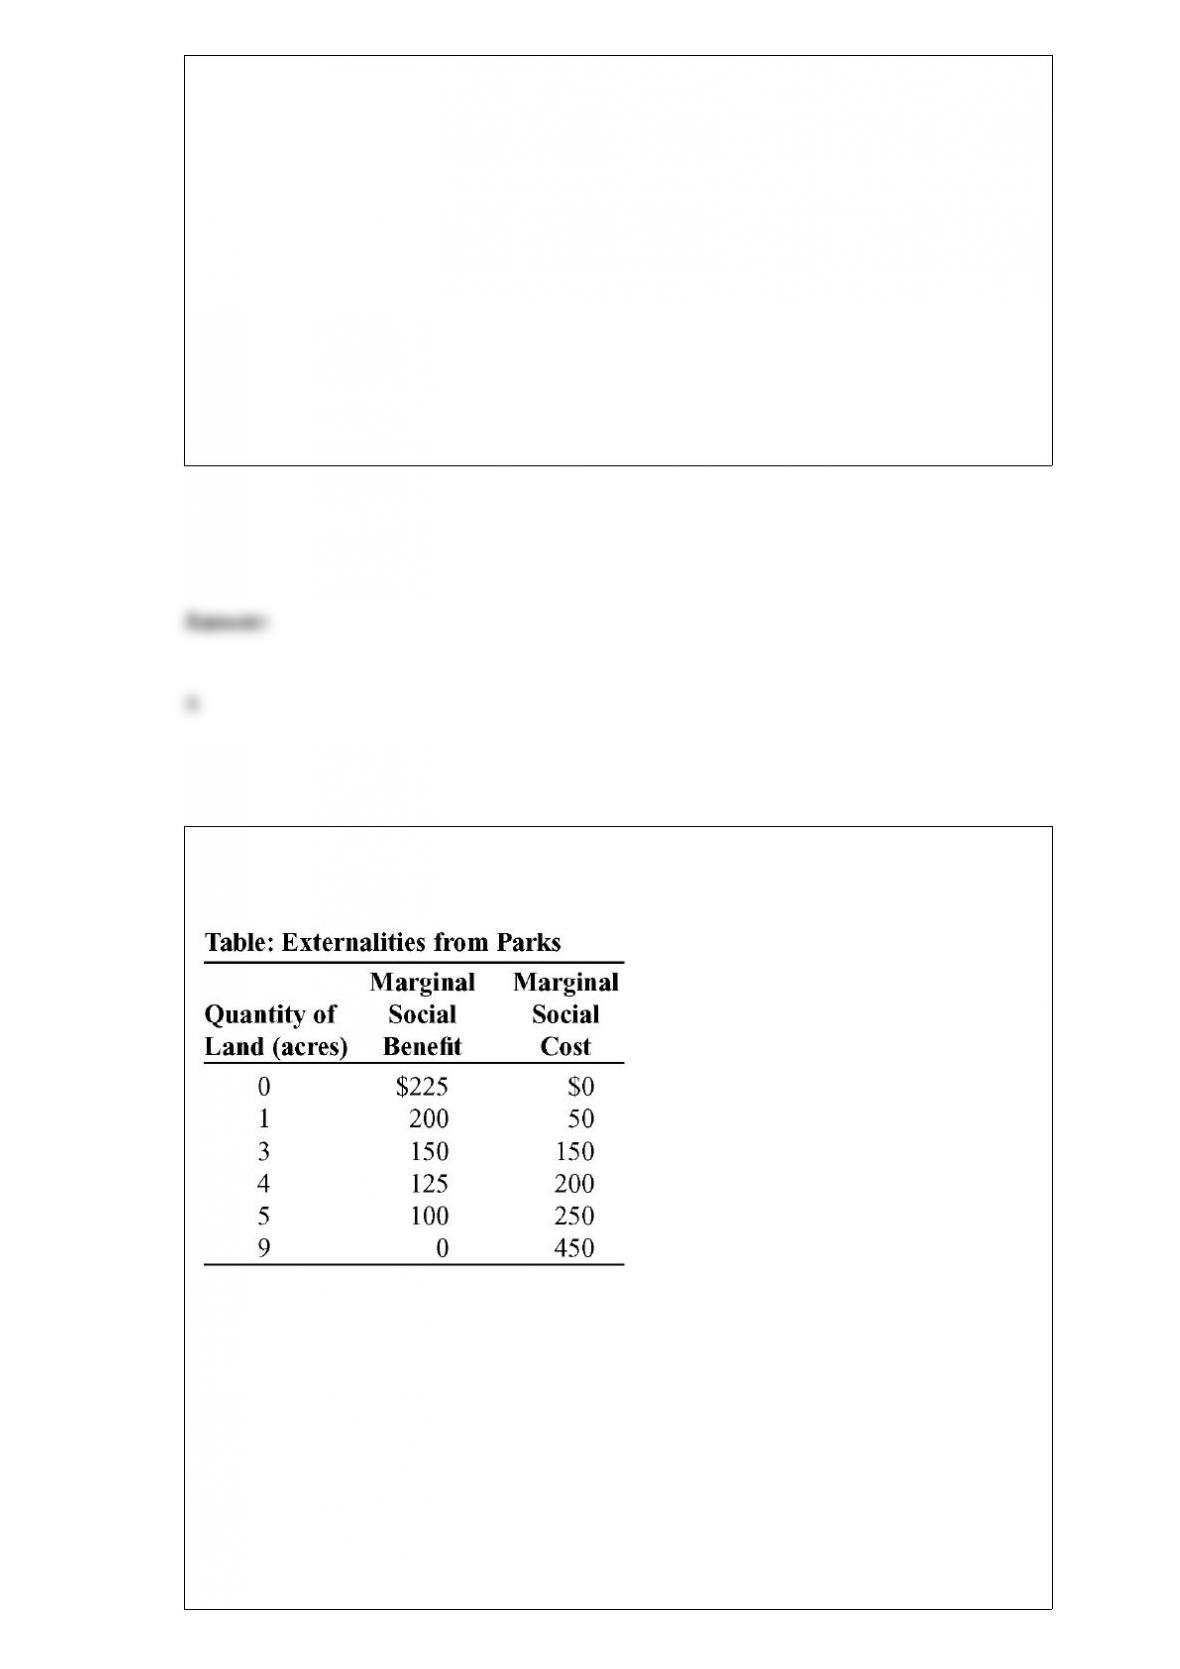
(Table: Externalities from Parks) The table Externalities from Parks shows the marginal
social benefit and the marginal social cost of preserving various amounts of land in a
city for a public park. If 1 acre is dedicated to the park, this outcome is _____ because
_____.
A) efficient; MSB = MSC
B) efficient; MSB > MSC
C) inefficient; MSB > MSC
D) inefficient; MSB < MSC
The marginal utility of eating sweet potatoes is the:
A) change in total utility from consuming an additional serving.
B) total utility divided by the number of servings consumed.
C) change in total utility divided by the number of servings consumed.
D) total utility divided by the change in the number of servings consumed.

Scenario: The Market for Good X: The market for good X can be depicted with the
following demand and supply equations: Demand: P = 50 ” 0.5Q Supply: P = 0.33Q
where P is price per unit and Q represents quantity in units. Policy makers plan on
imposing a $1 per unit tax on this good.
(Scenario: The Market for Good X) Look at the scenario The Market for Good X. If a
$1 per unit tax is imposed, the deadweight loss associated with the tax will be equal to:
A) $1.00.
B) $20.00.
C) $0.50.
D) $0.60.