In a particular country in 1998, the average worker needed to work 25 hours to produce
40 units of output. In that same country in 2008, the average worker needed to work 40
hours to produce 68 units of output. In that country, the productivity of the average
worker
a. decreased by 1.7 percent between 1998 and 2008.
b. remained unchanged between 1998 and 2008.
c. increased by 4.75 percent between 1998 and 2008.
d. increased by 6.25 percent between 1998 and 2008.
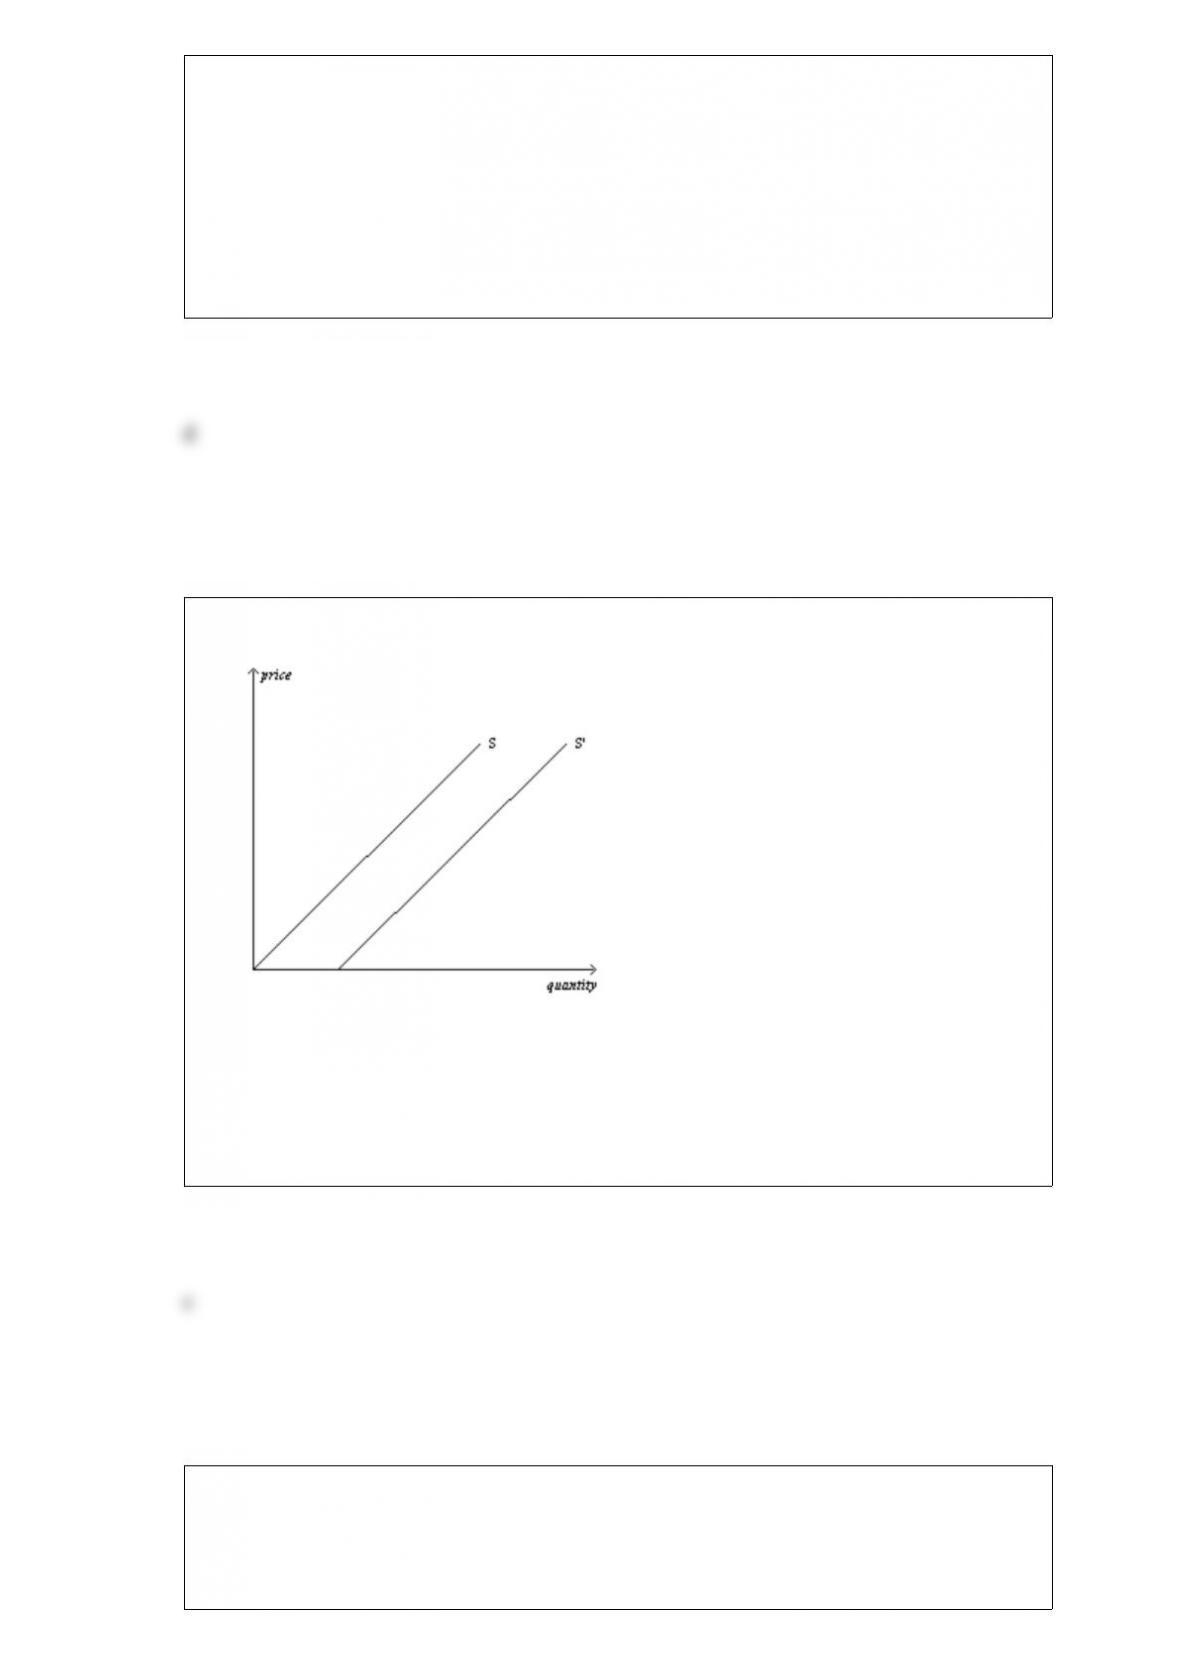
Figure 416
Refer to Figure 416. The shift from S to S’ is called a(n)
a. decrease in supply.
b. decrease in quantity supplied.
c. increase in supply.
d. increase in quantity supplied.
Adam Smith suggested that an invisible had guides market economies. In this analogy,
what is the baton that the invisible hand uses to conduct the economic orchestra?
a. the government
b. prices
c. subsidies
d. the Federal Reserve
Equilibrium price must decrease when demand
a. increases and supply does not change, when demand does not change and supply
decreases, and when demand decreases and supply increases simultaneously.
b. increases and supply does not change, when demand does not change and supply
decreases, and when demand increases and supply decreases simultaneously.
c. decreases and supply does not change, when demand does not change and supply
increases, and when demand decreases and supply increases simultaneously.
d. decreases and supply does not change, when demand does not change and supply
increases, and when demand increases and supply decreases simultaneously.
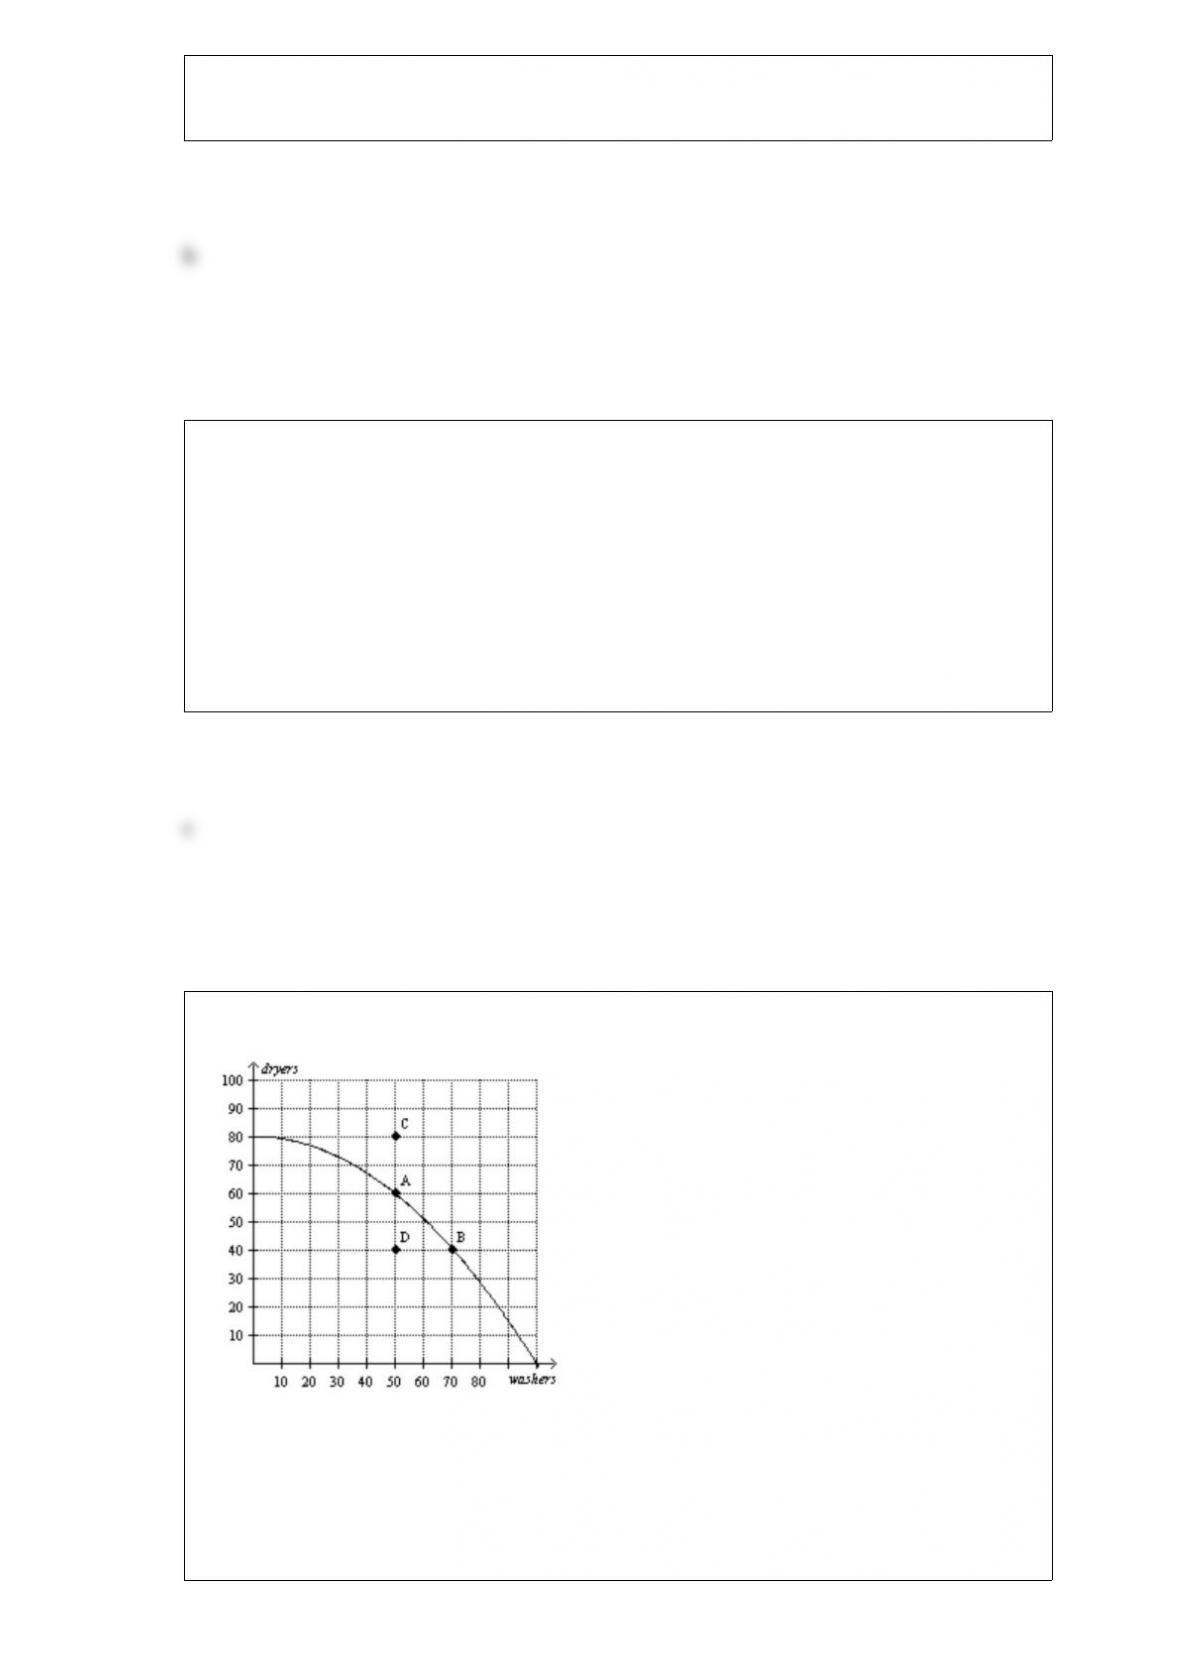
Figure 25
Refer to Figure 25. It is possible for this economy to produce
a. 60 dryers and 50 washers.
b. 60 dryers and 60 washers.
c. 80 dryers and 50 washers.
d. All of the above.
The Surgeon General announces that eating apples promotes healthy teeth. As a result,
the equilibrium price of apples
a. increases, and producer surplus increases.
b. increases, and producer surplus decreases.
c. decreases, and producer surplus increases.
d. decreases, and producer surplus decreases.
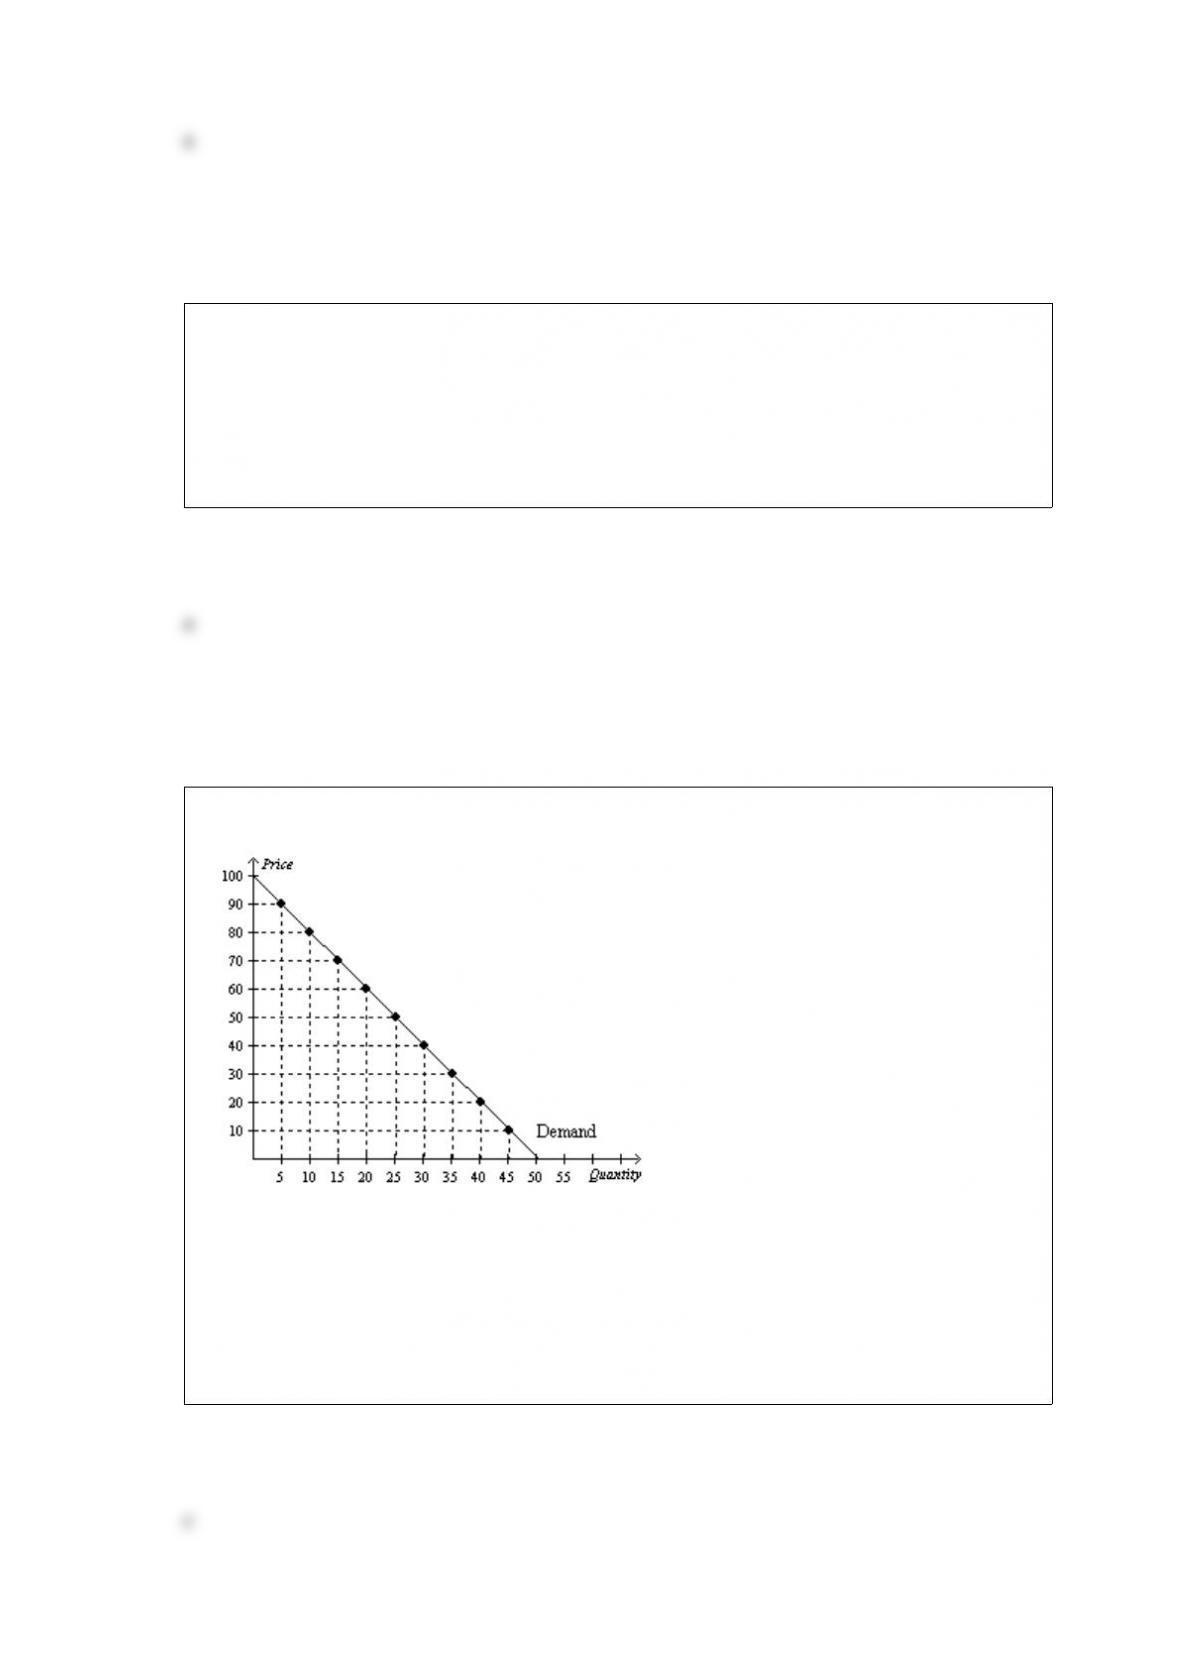
Figure 55
Refer to Figure 55. Using the midpoint method, between prices of $50 and $60, price
elasticity of demand is about
a. 0.22.
b. 0.82.
c. 1.22.
d. 2.
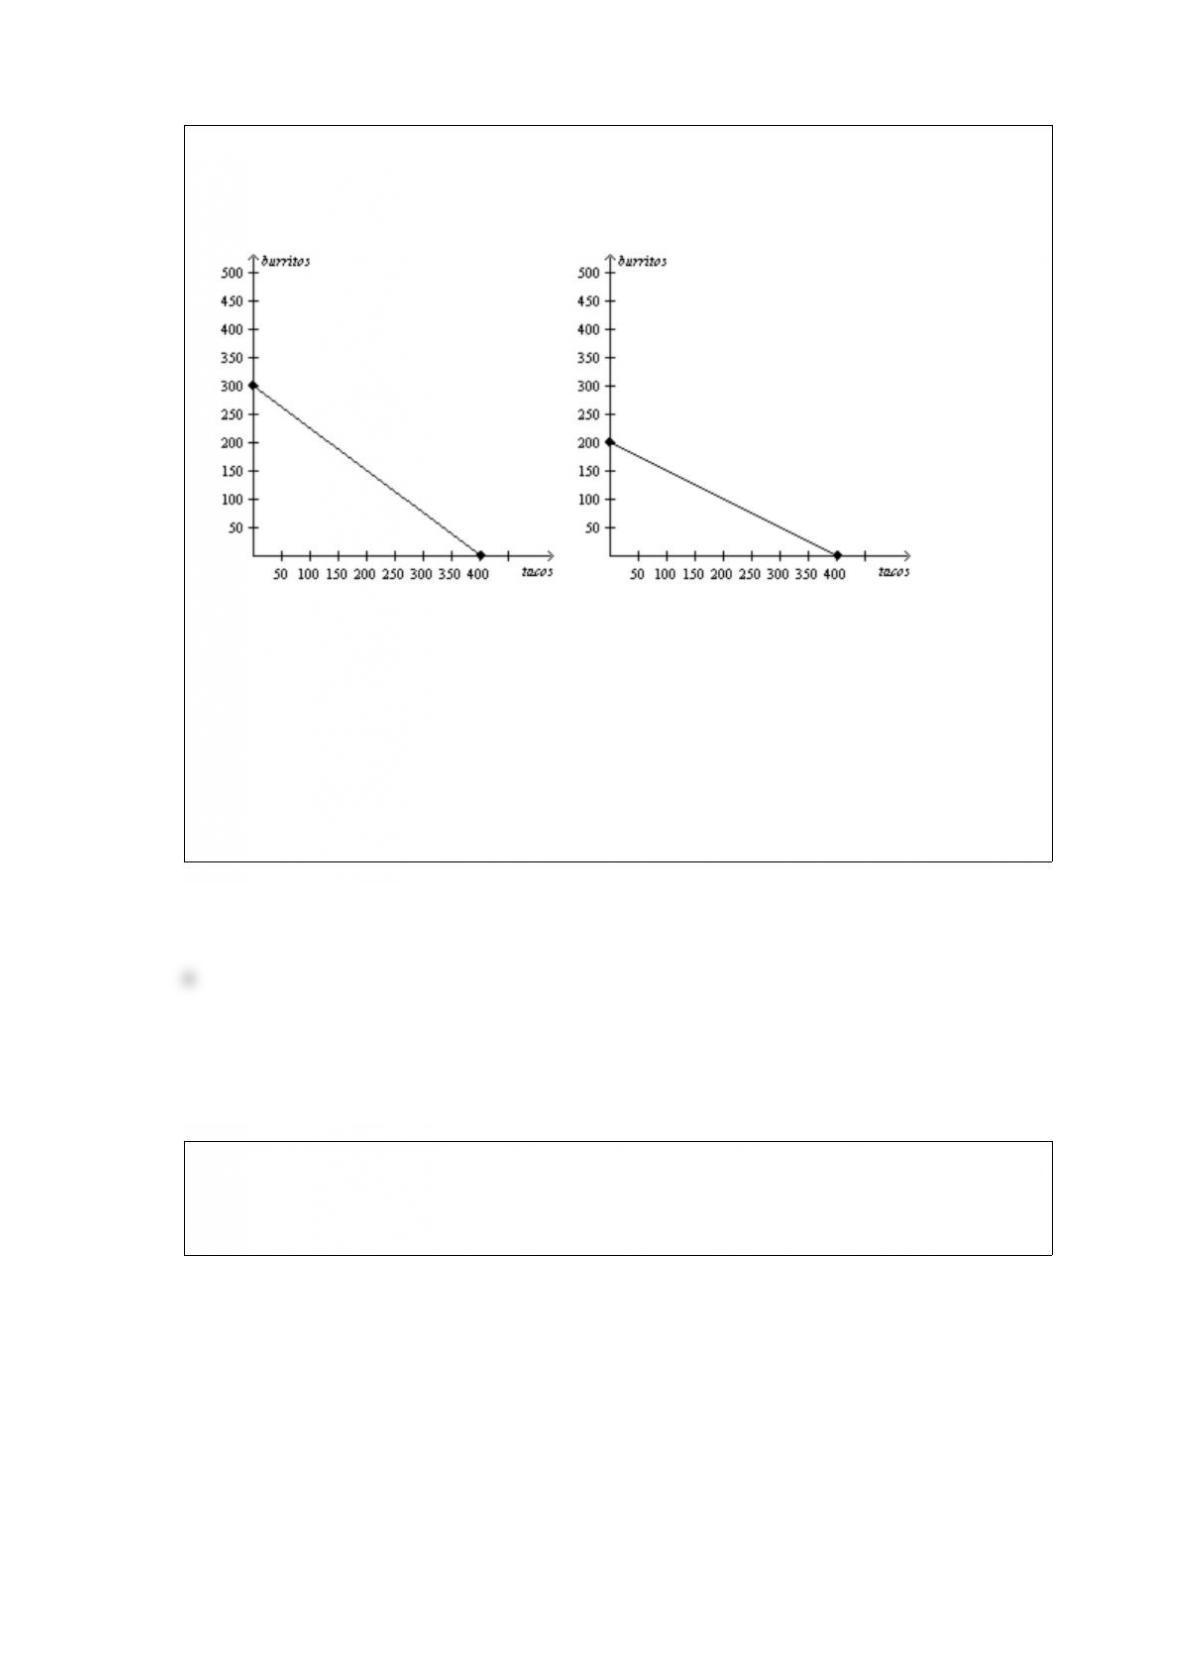
Figure 314
Arturo’s Production Possibilities FrontierDina’s Production Possibilities Frontier
Refer to Figure 314. Without trade, Arturo produced and consumed 240 tacos and 120
burritos and Dina produced and consumed 100 tacos and 150 burritos. Then, each
person agreed to specialize in the production of the good in which they have a
comparative advantage and trade 260 tacos for 156 burritos. As a result, Arturo gained
a. 20 tacos and 24 burritos and Dina gained 40 tacos and 6 burritos.
b. 20 tacos and 36 burritos and Dina gained 160 tacos and 6 burritos.
c. 260 tacos and 144 burritos and Dina gained 140 tacos and 156 burritos.
d. 260 tacos and 156 burritos and Dina gained 260 tacos and 156 burritos.
Figure 314
Arturo’s Production Possibilities FrontierDina’s Production Possibilities Frontier
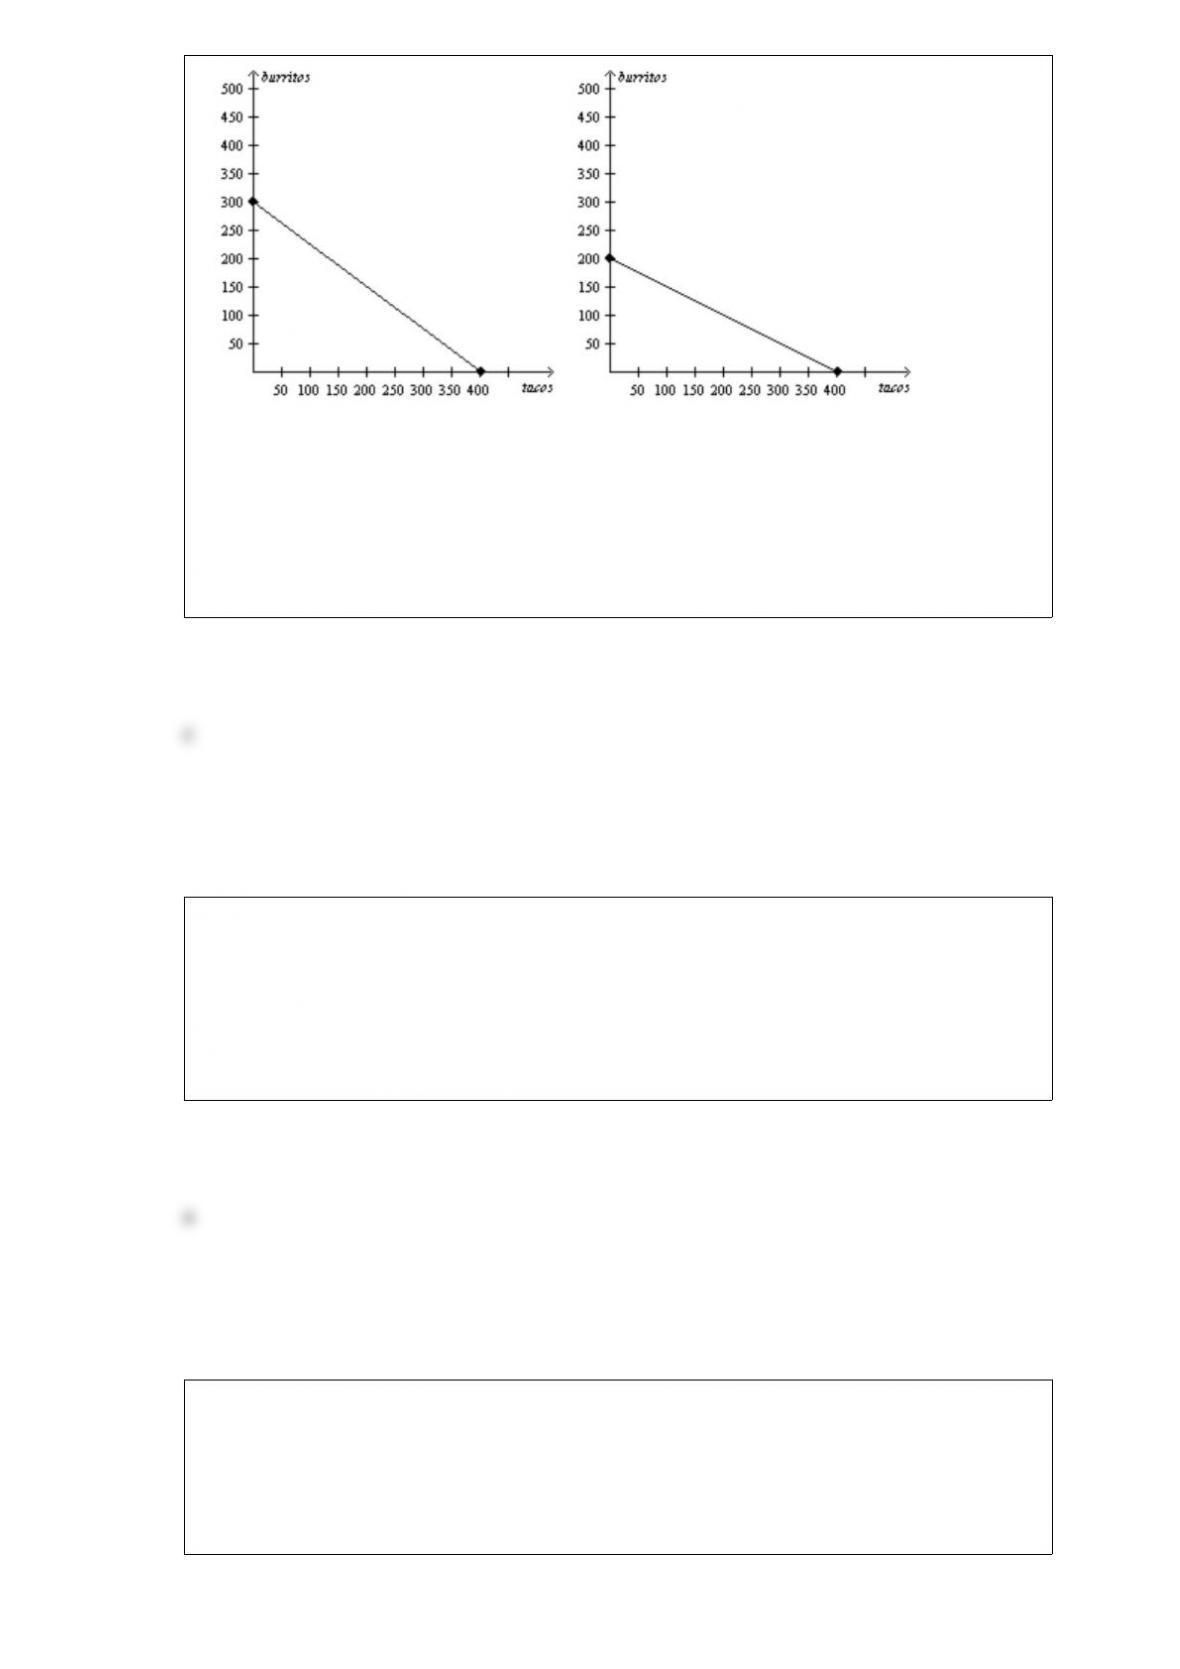
Refer to Figure 314. Which of the following is not correct?
a. Arturo and Dina could each consume 100 tacos and 100 burritos without trade.
b. Neither Arturo nor Dina could each consume 200 tacos and 200 burritos without
trade.
c. Arturo and Dina could each consume 200 tacos and 200 burritos with trade.
d. Total consumption of burritos could not be 600 either with or without trade.
Relative to a situation in which domestic firms do not compete with foreign firms, firms
in countries that engage in free trade
a. can realize economies of scale more fully.
b. have greater market power.
c. experience larger producer surplus.
d. All of the above are correct.
To say that a price ceiling is binding is to say that the price ceiling
a. results in a surplus.
b. is set above the equilibrium price.
c. causes quantity demanded to exceed quantity supplied.
d. All of the above are correct.

A supply schedule is a table that shows the relationship between
a. price and quantity supplied.
b. input costs and quantity supplied.
c. quantity demanded and quantity supplied.
d. profit and quantity supplied.
Assume Diana buys computers in a competitive market. It follows that
a. Diana has a limited number of sellers to turn to when she buys a computer.
b. Diana will find herself negotiating with sellers whenever she buys a computer.
c. if Diana buys a large number of computers, the price of computers will rise
noticeably.
d. None of the above is correct.
Charles purchases 20 basketball tickets per year when his annual income is $50,000 and
25 basketball tickets when his annual income is $60,000. Charles’s income elasticity of
demand for basketball ticket is
a. 0.82, and basketball tickets are a normal good.
b. 0.82, and basketball tickets are an inferior good.
c. 1.22, and basketball tickets are a normal good.
d. 1.22, and basketball tickets are an inferior good.
A university’s football stadium is never more than halffull during football games. This
indicates
a. the ticket price is above the equilibrium price.
b. the ticket price is below the equilibrium price.
c. the ticket price is at the equilibrium price.
d. nothing about the equilibrium price.
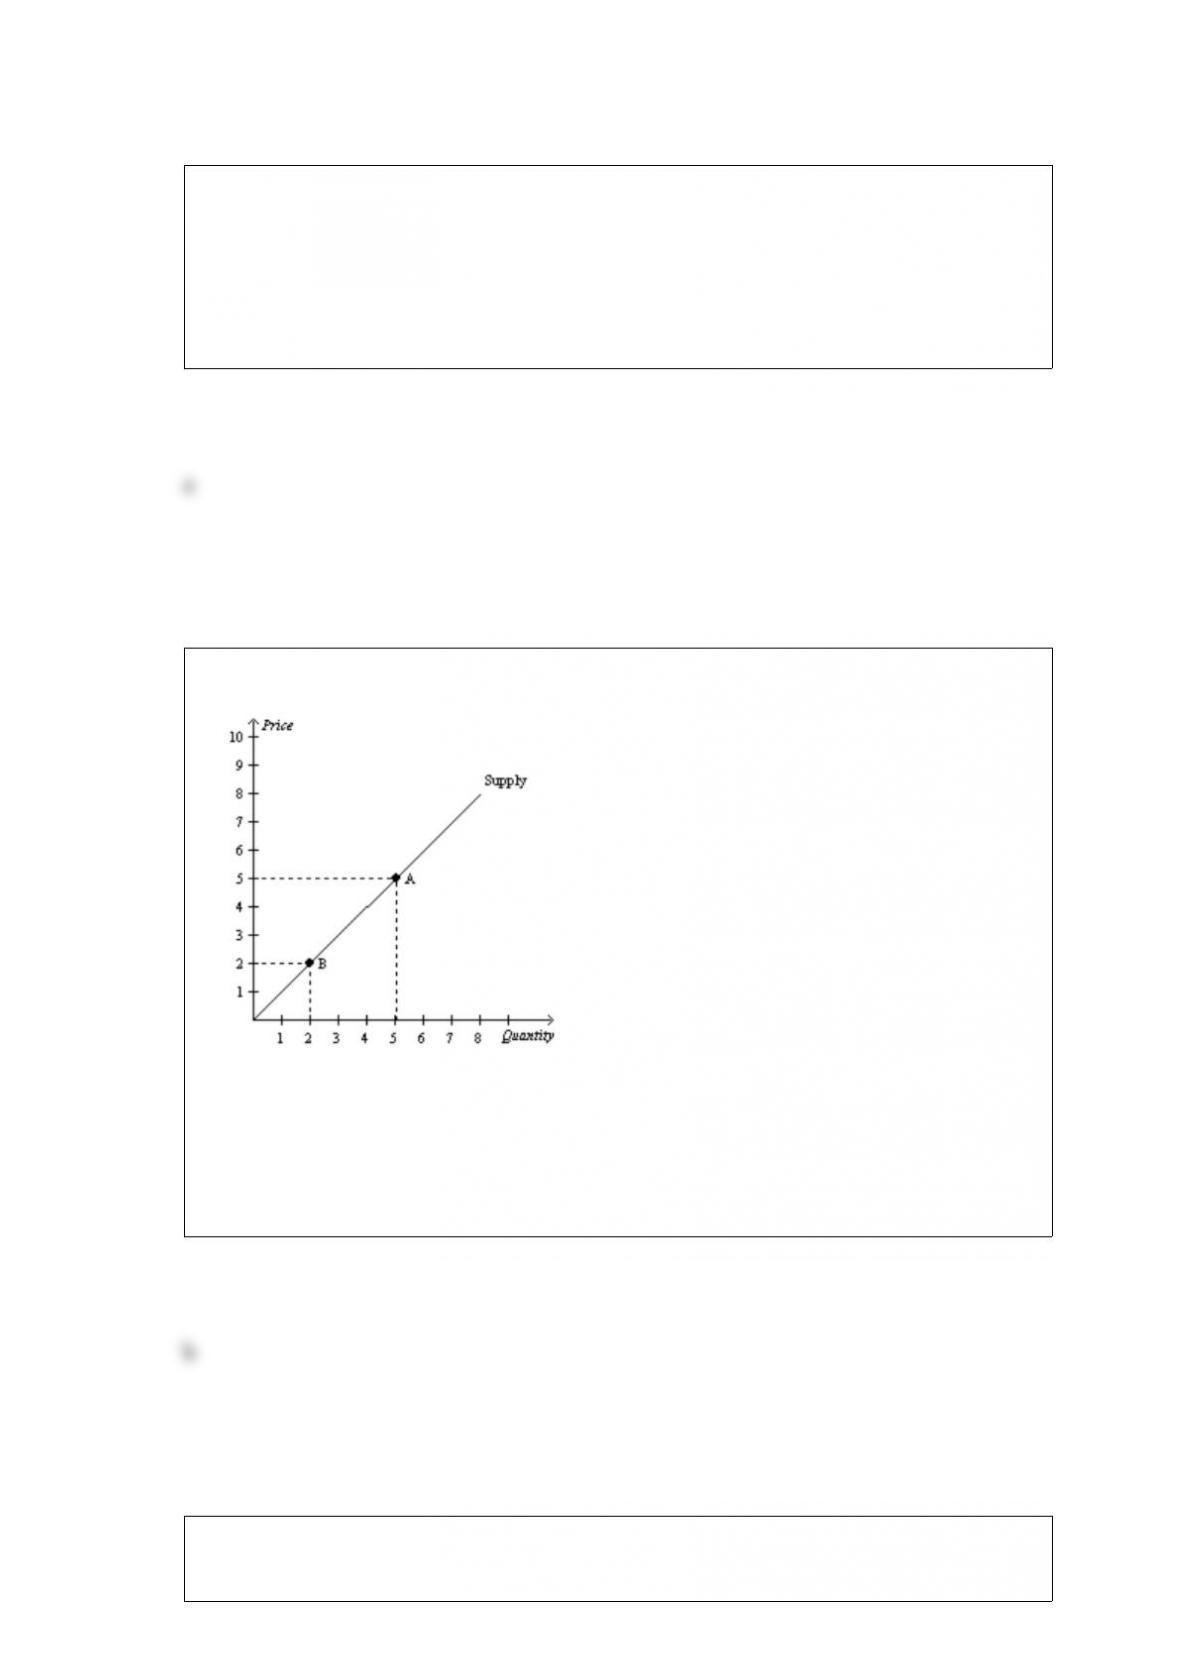
Figure 410
Refer to Figure 410. The movement from Point A to Point B represents a(n)
a. shift in the supply curve.
b. decrease in the quantity supplied.
c. increase in the quantity supplied.
d. Both a and b are correct.
Figure 83
The vertical distance between points A and C represents a tax in the market.
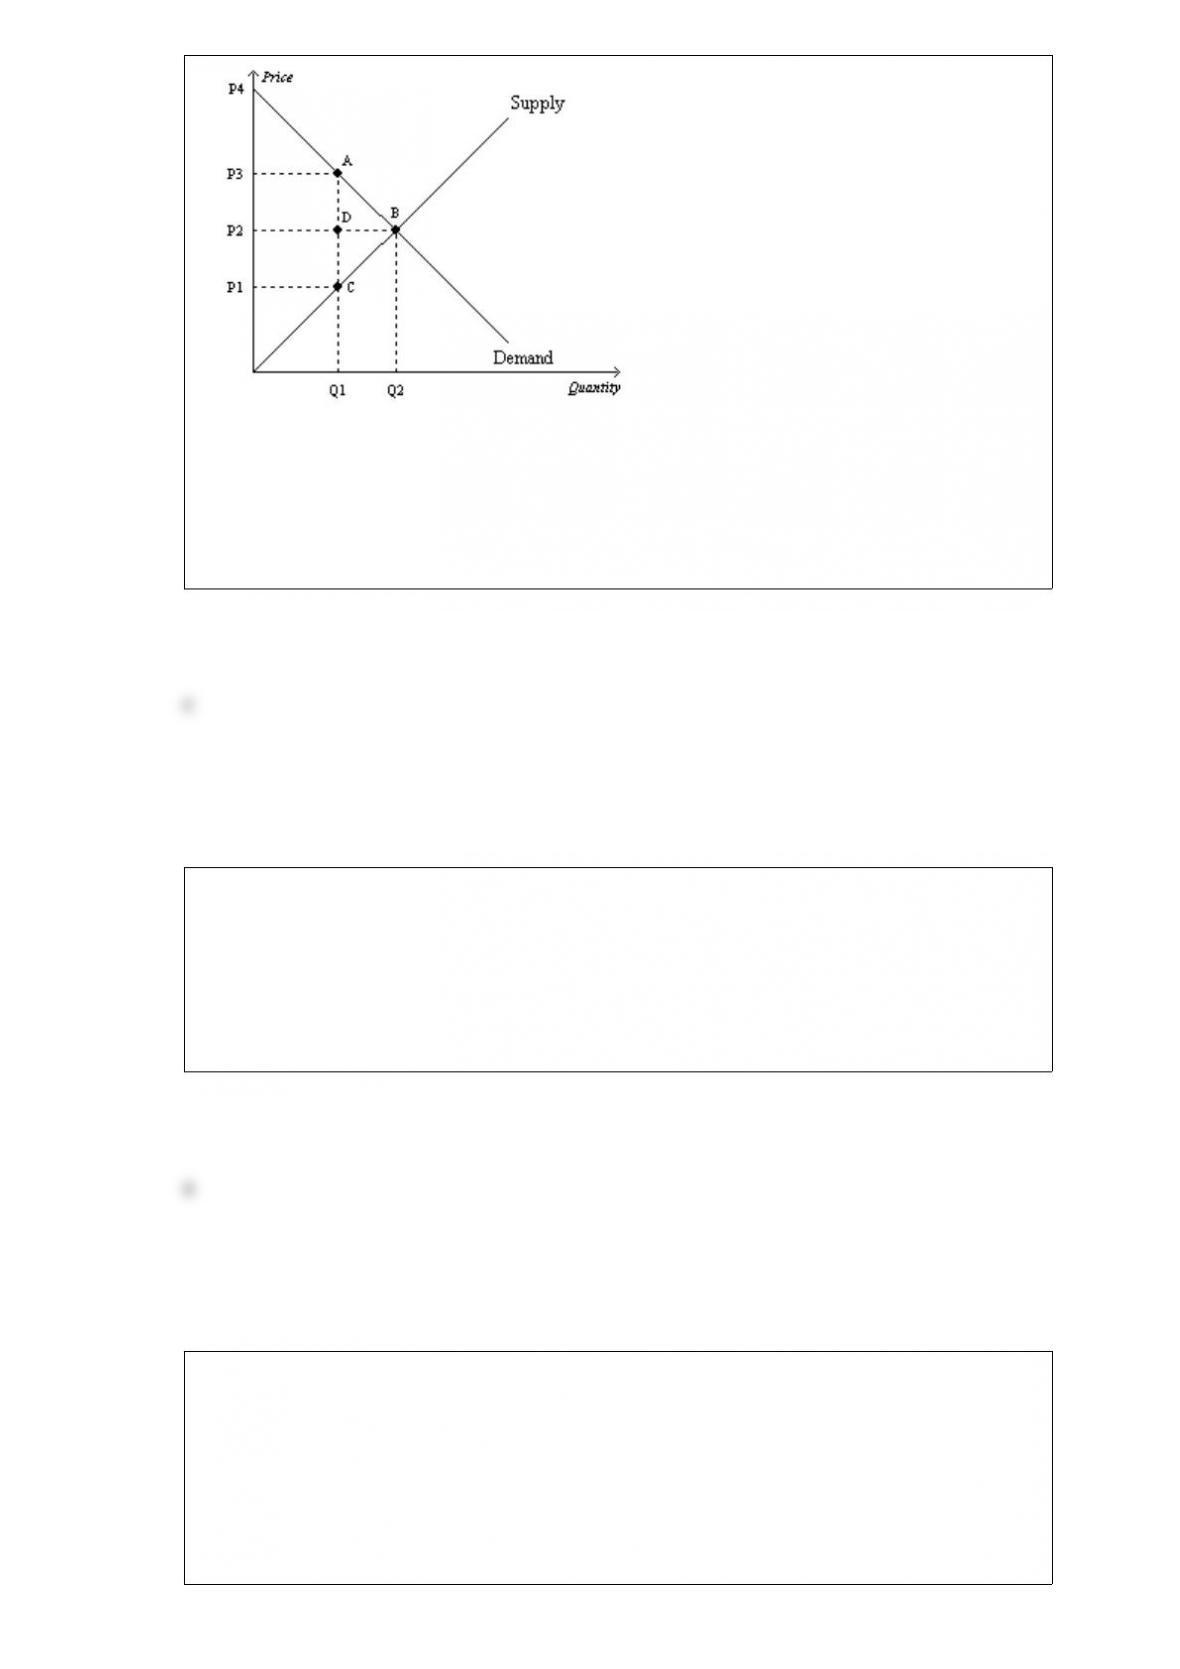
Refer to Figure 83. The perunit burden of the tax on sellers is
a. P3 P1.
b. P3 P2.
c. P2 P1.
d. P4 P3.
The invisible hand’s ability to coordinate the decisions of the firms and households in
the economy can be hindered by
a. government actions that distort prices.
b. increased competition in markets.
c. enforcement of property rights.
d. too much attention paid to efficiency.
Table 320
Assume that Brad and Theresa can switch between producing wheat and producing beef
at a constant rate.
Minutes Needed to Make 1
Bushel of Wheat
Pound of Beef
Brad1012
Theresa610
Refer to Table 320. At which of the following prices would both Brad and Theresa gain
from trade with each other?
a. 12 bushels of wheat for 6 pounds of beef
b. 12 bushels of wheat for 8 pounds of beef
c. 12 bushels of wheat for 12 pounds of beef
d. Brad and Theresa could not both gain from trade with each other at any price.
Which of the following is correct? A tax burden
a. falls more heavily on the side of the market that is more elastic.
b. falls more heavily on the side of the market that is less elastic.
c. falls more heavily on the side of the market that is closest to unit elastic.
d. is distributed independently of the relative elasticities of supply and demand.
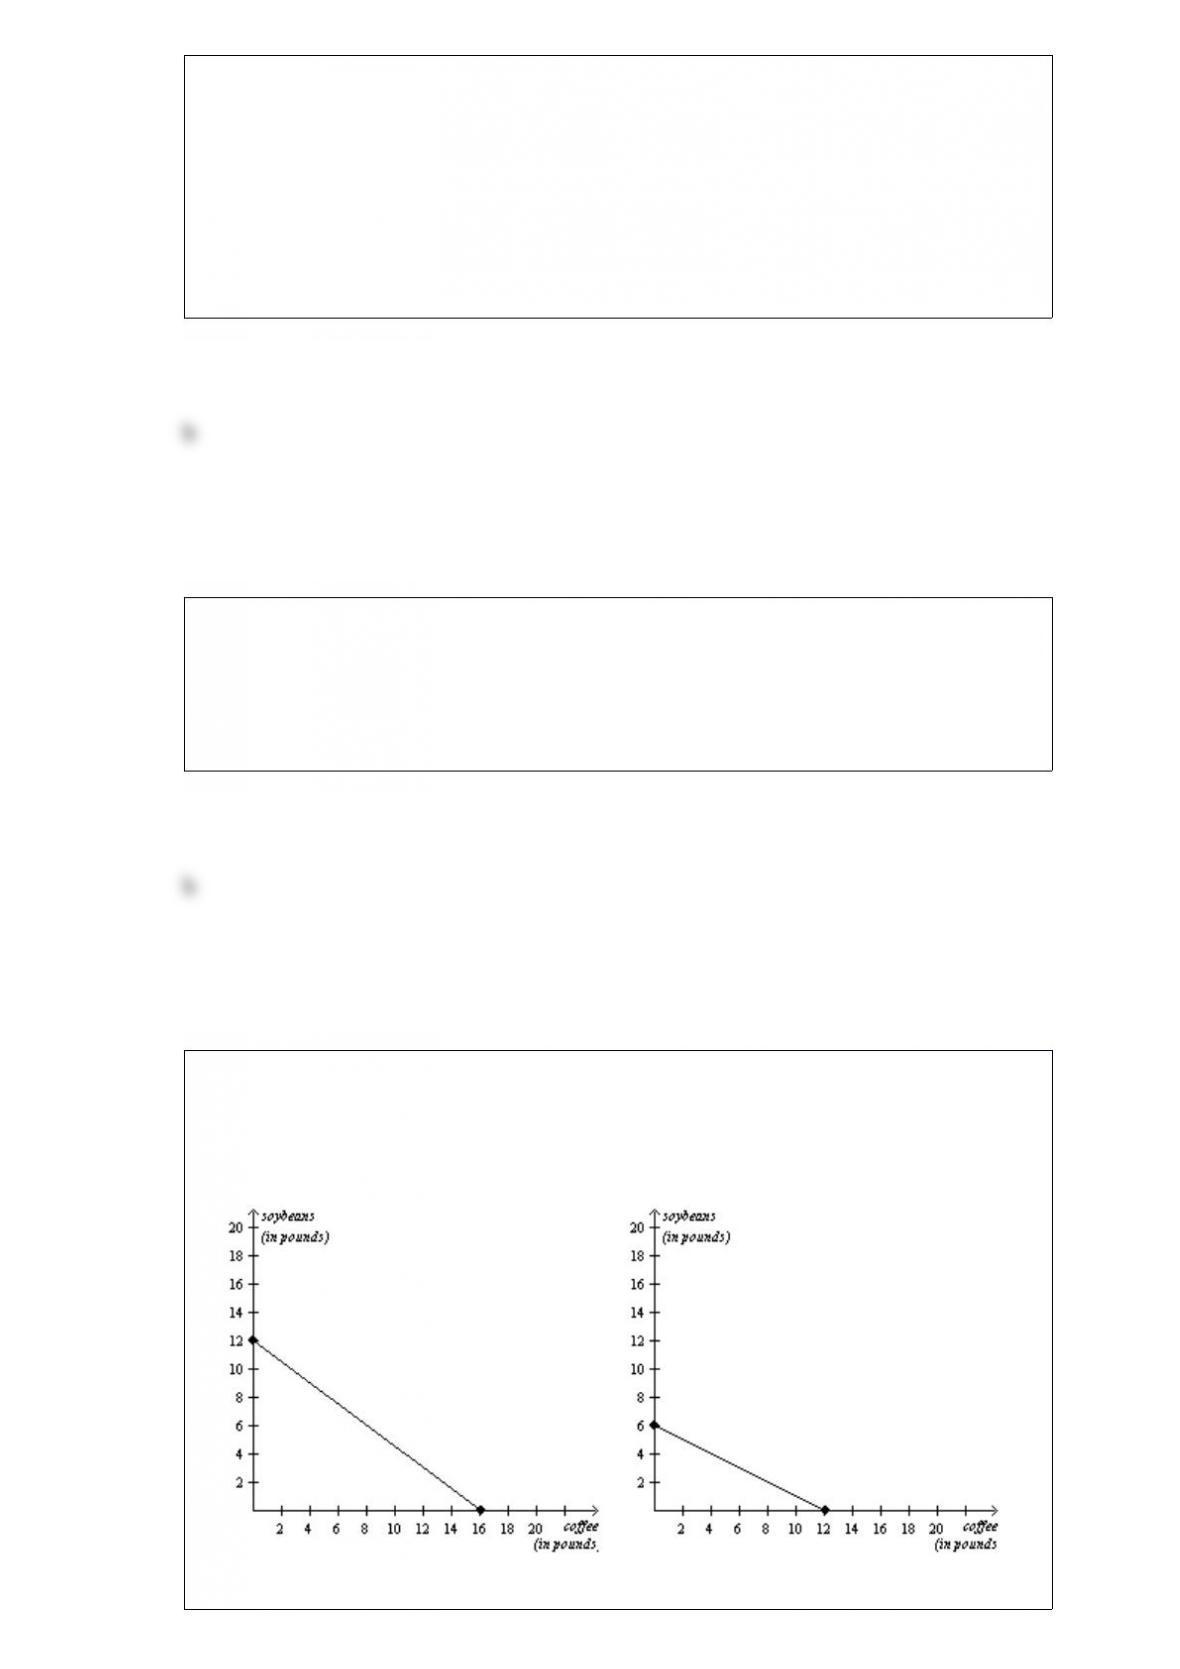
Figure 319
Chile’s Production Possibilities FrontierColombia’s Production Possibilities
Frontier
Refer to Figure 319. At which of the following prices would both Chile and Colombia
gain from trade with each other?
a. 6 pounds of soybeans for 9 pounds of coffee
b. 8 pounds of soybeans for 20 pounds of coffee
c. 11 pounds of soybeans for 33 pounds of coffee
d. Chile and Colombia could not both gain from trade with each other at any price.
Ronnie operates a lawncare service. On each day, the cost of mowing the first lawn is
$15, the cost of mowing the second lawn is $25, and the cost of mowing the third lawn
is $40. His producer surplus on the first three lawns of the day is $100. If Ronnie
charges all customers the same price for lawn mowing, that price is
a. $20.
b. $60.
c. $80.
d. $180.
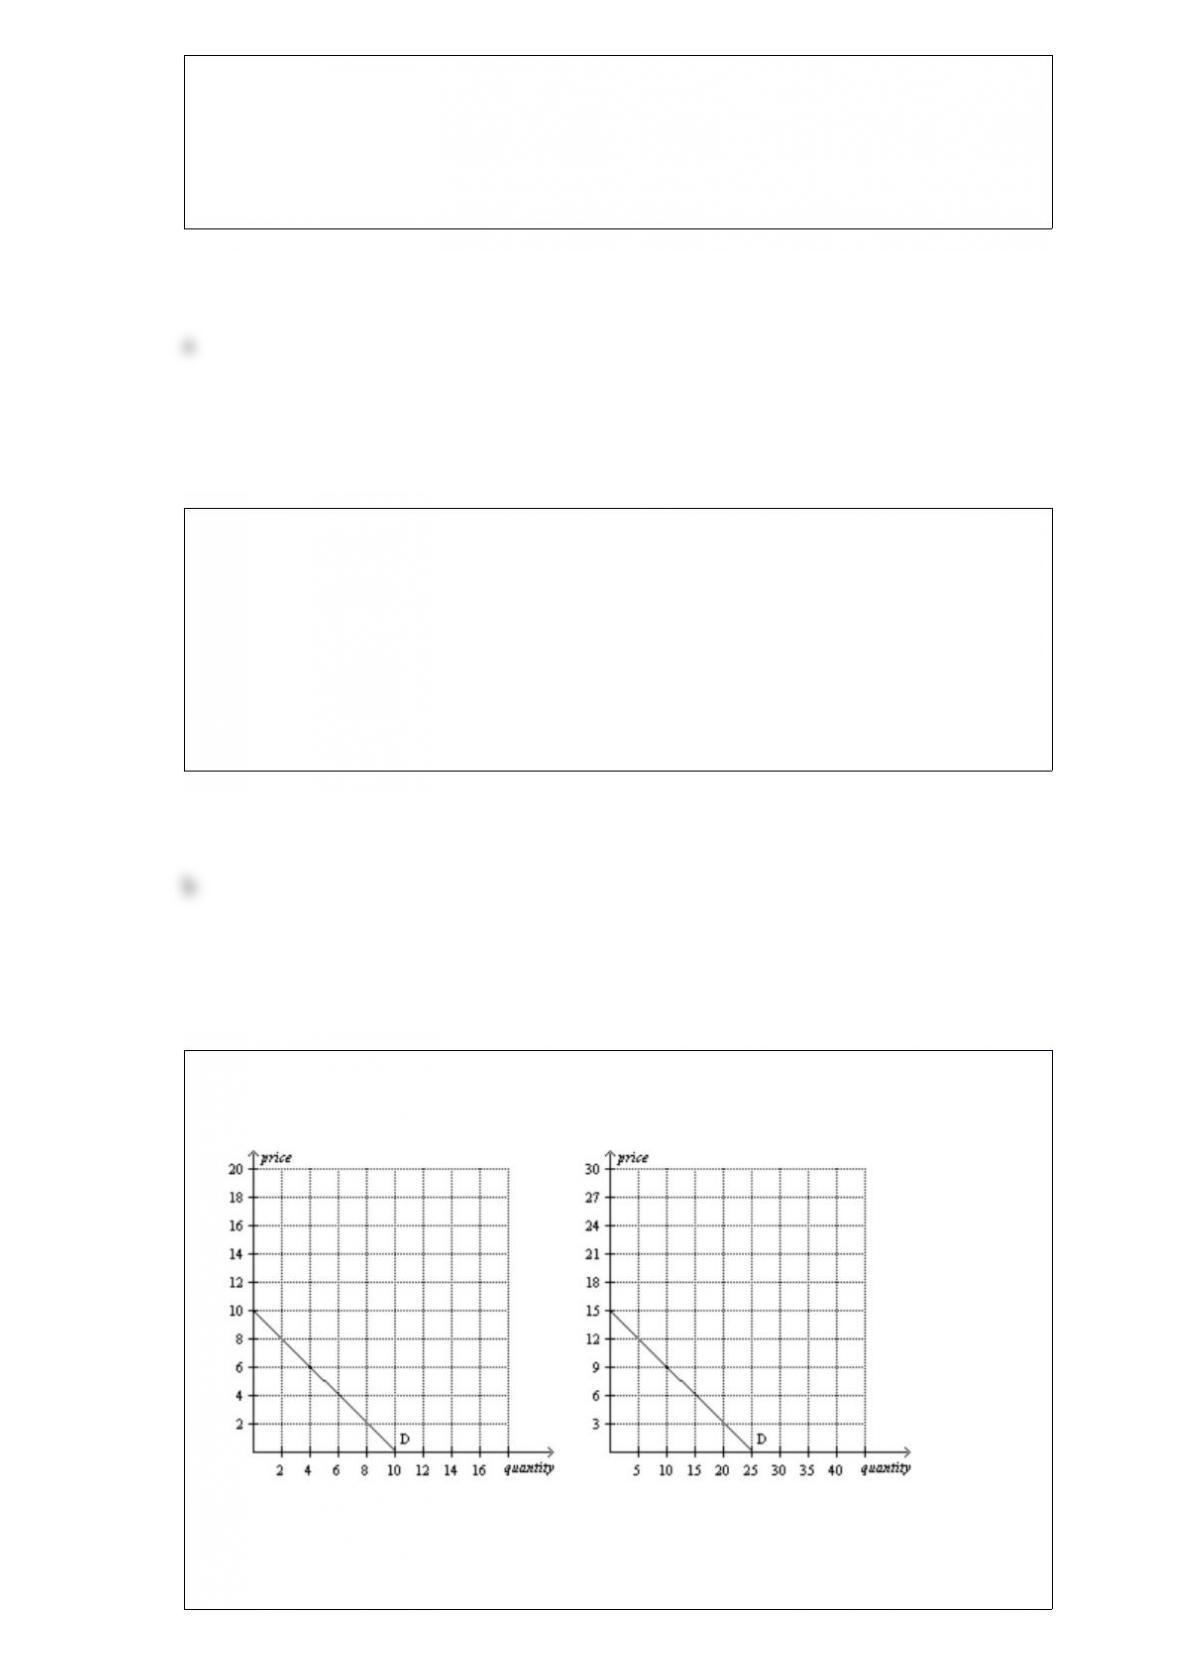
Figure 43
Consumer 1Consumer 2
Refer to Figure 43. If these are the only two consumers in the market, then the market
quantity demanded at a price of $15 is
a. 0 units.
b. 10 units.
c. 15 units.
d. 25 units.
Which of the following events always would increase the size of the deadweight loss
that arises from the tax on gasoline?
a. The demand for gasoline becomes more inelastic.
b. The slope of the supply curve for gasoline becomes steeper.
c. The amount of the tax per gallon of gasoline increases.
d. All of the above are correct.
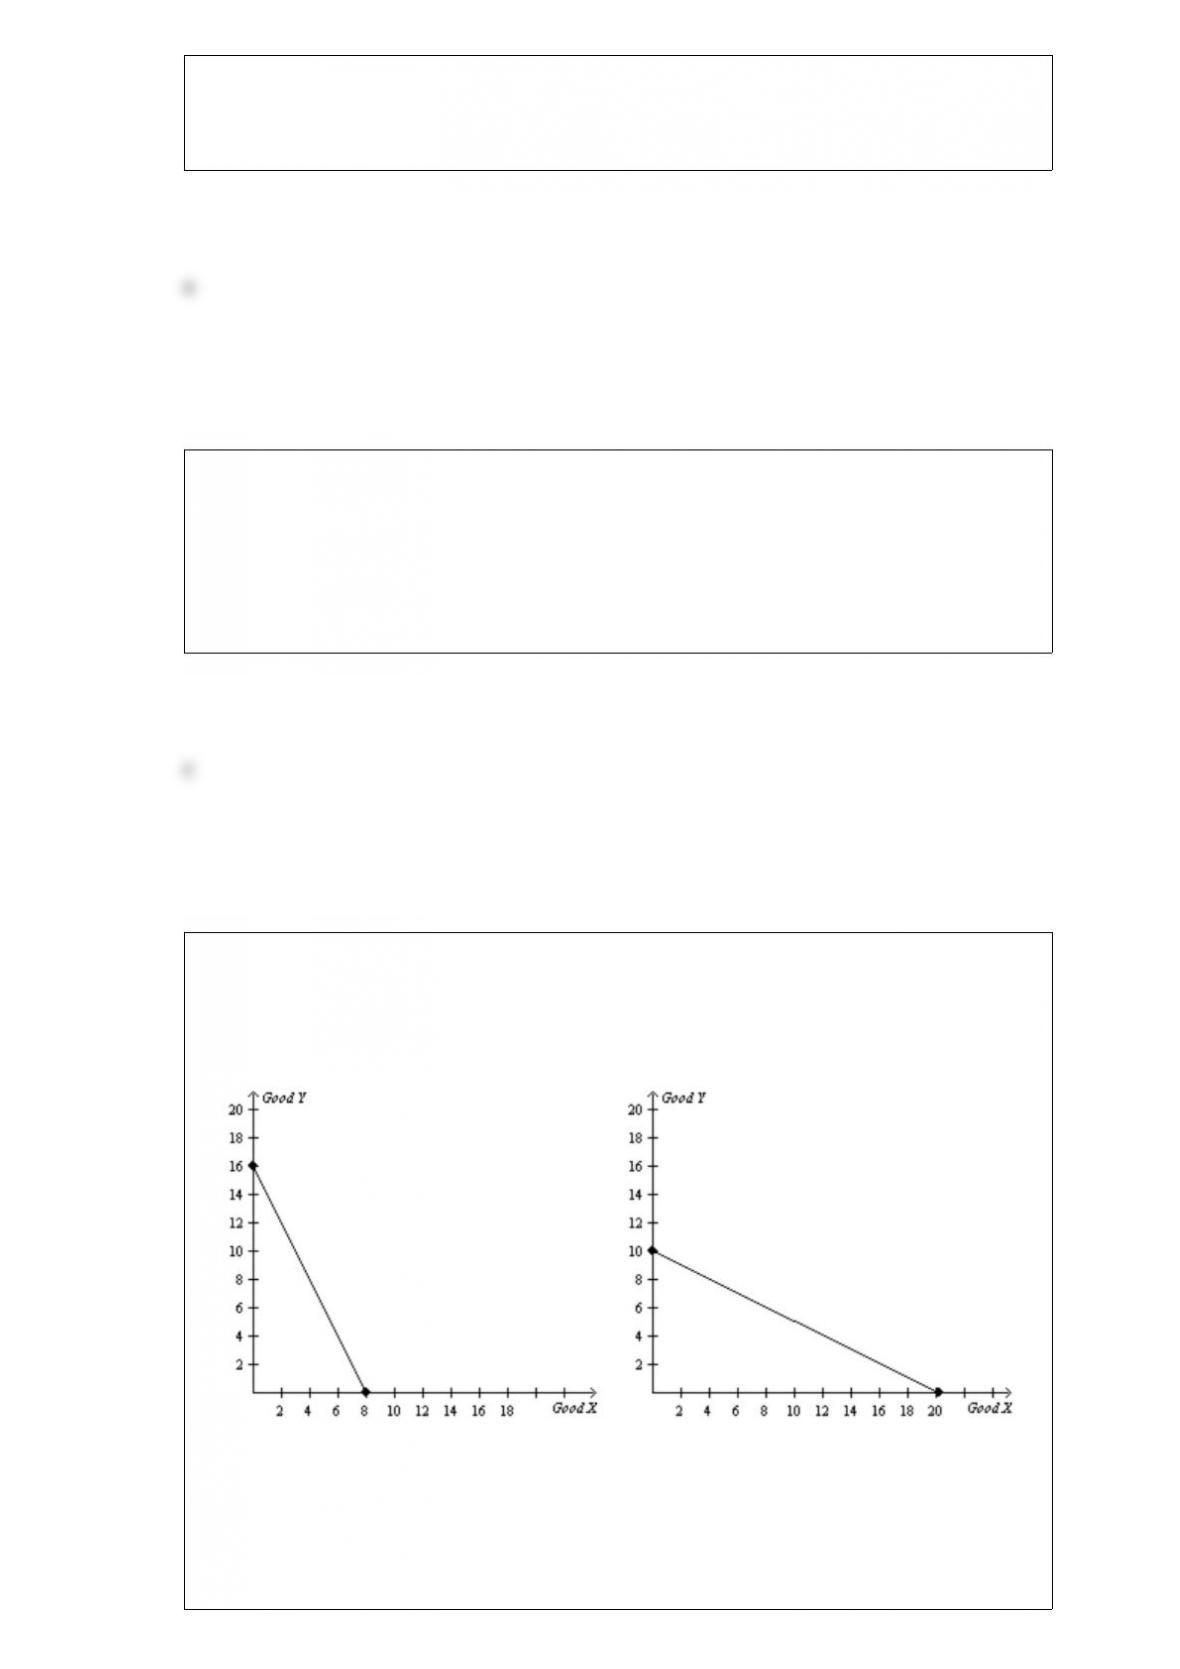
Figure 320
Canada’s Production Possibilities FrontierMexico’s Production Possibilities
Frontier
Refer to Figure 320. If Canada and Mexico switch from each country dividing its time
equally between the production of Good X and Good Y to each country spending all of
its time producing the good in which it has a comparative advantage, then total
production of Good Y will increase by
a. 3 units.
b. 6 units.
c. 9 units.
d. 12 units.
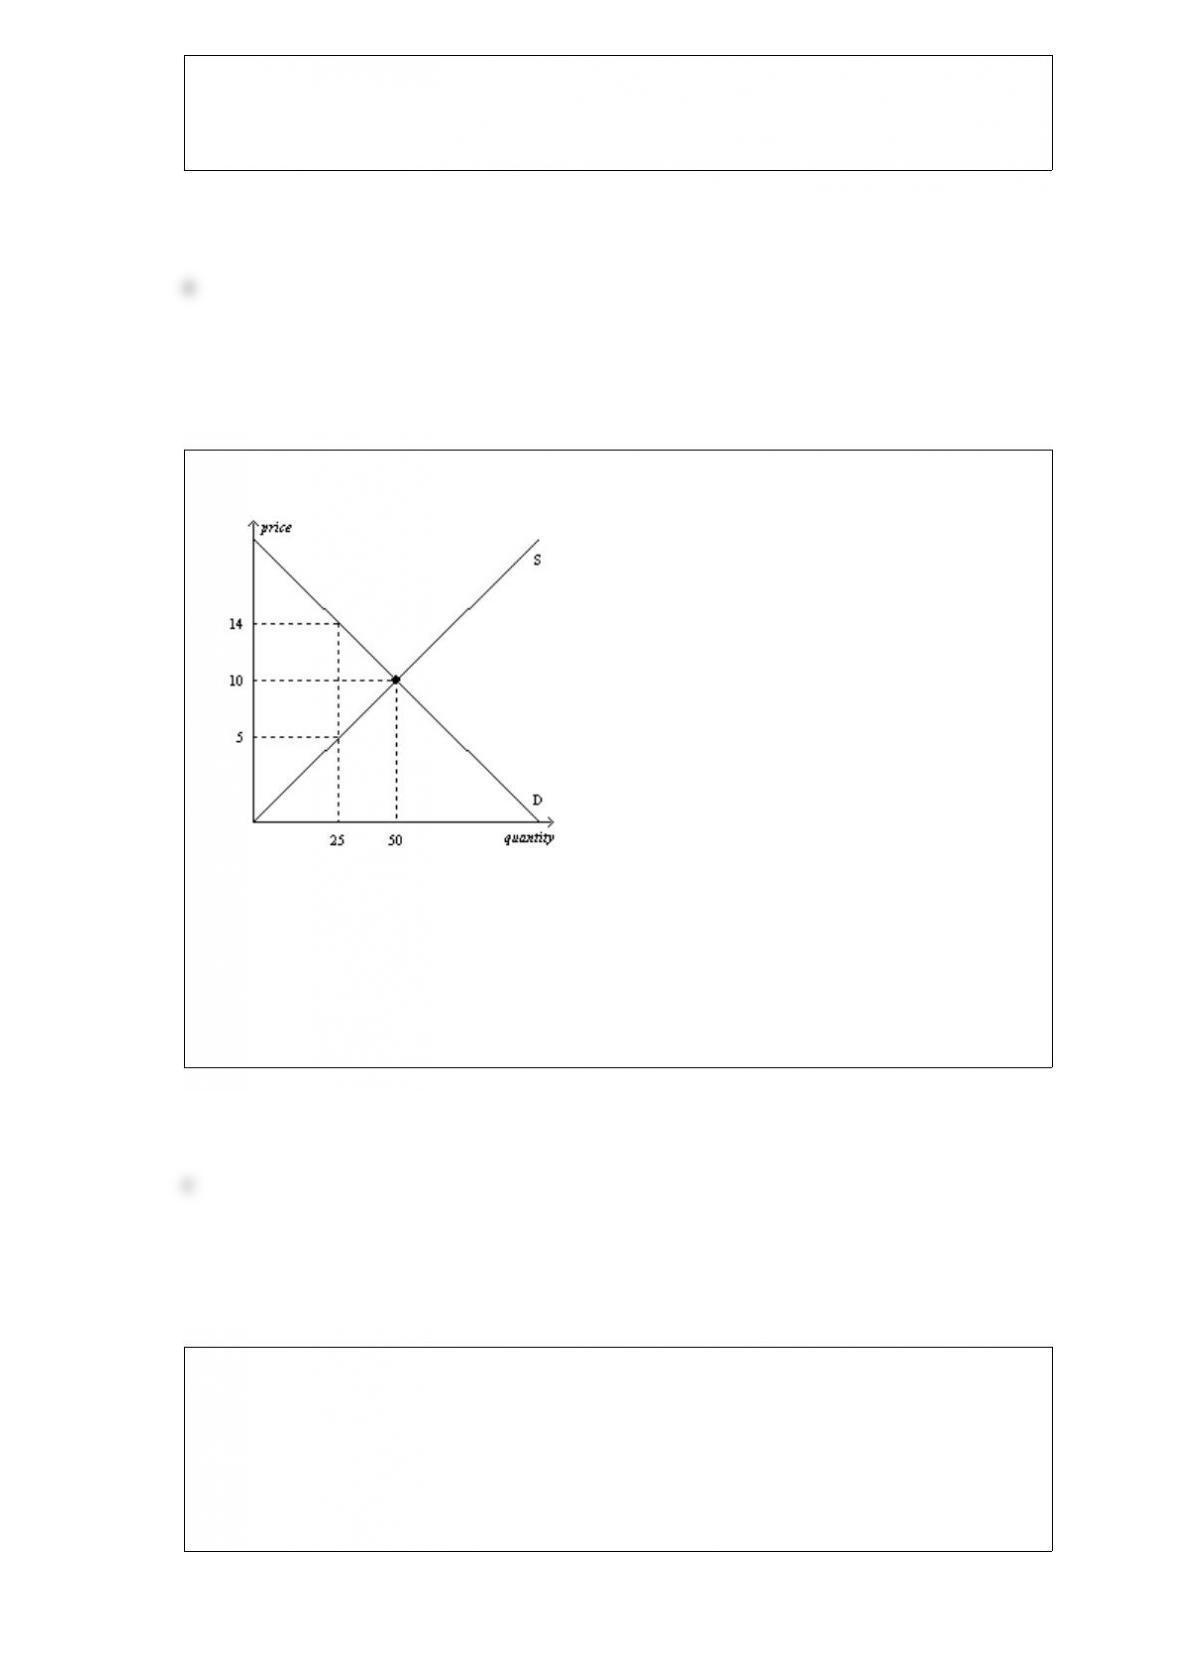
Figure 620
Refer to Figure 620. Suppose a tax of $5 per unit is imposed on this market. What will
be the new equilibrium quantity in this market?
a. less than 25 units
b. 25 units
c. between 25 units and 50 units
d. greater than 50 units
Which of the following areas of study typifies macroeconomics as opposed to
microeconomics?
a. the effects of rent control on the availability of housing in New York City
b. the economic impact of tornadoes on cities and towns in Oklahoma
c. how tariffs on shoes affects the shoe industry
d. the effect on the economy of changes in the nation’s unemployment rate

Table 61
PriceQuantity
DemandedQuantity
Supplied
$2024000
$302000200
$401600400
$501200600
$60800800
$704001000
$8001200
Refer to Table 61. Suppose the government imposes a price ceiling of $40 on this
market. What will be the size of the shortage in this market?
a. 0 units
b. 400 units
c. 1200 units
d. 1600 units
Which of the following is not equal to total surplus?
a. consumer surplus producer surplus
b. buyers’ willingness to pay sellers’ costs
c. value to buyers amount paid by buyers + amount received by sellers cost to sellers
d. value to buyers cost to sellers
Corn chips and potato chips are substitutes. Good weather that sharply increases the
corn harvest would
a. increase consumer surplus in the market for corn chips and decrease producer surplus
in the market for potato chips.
b. increase consumer surplus in the market for corn chips and increase producer surplus
in the market for potato chips.
c. decrease consumer surplus in the market for corn chips and increase producer surplus
in the market for potato chips.
d. decrease consumer surplus in the market for corn chips and decrease producer
surplus in the market for potato chips.
A variety of fuels can be used to generate electricity. Considering only the availability
of the fuel and not the cost of converting it into electricity, which of the following fuels
is most scarce?
a. wind power
b. solar energy
c. fossil fuel
d. hydropower
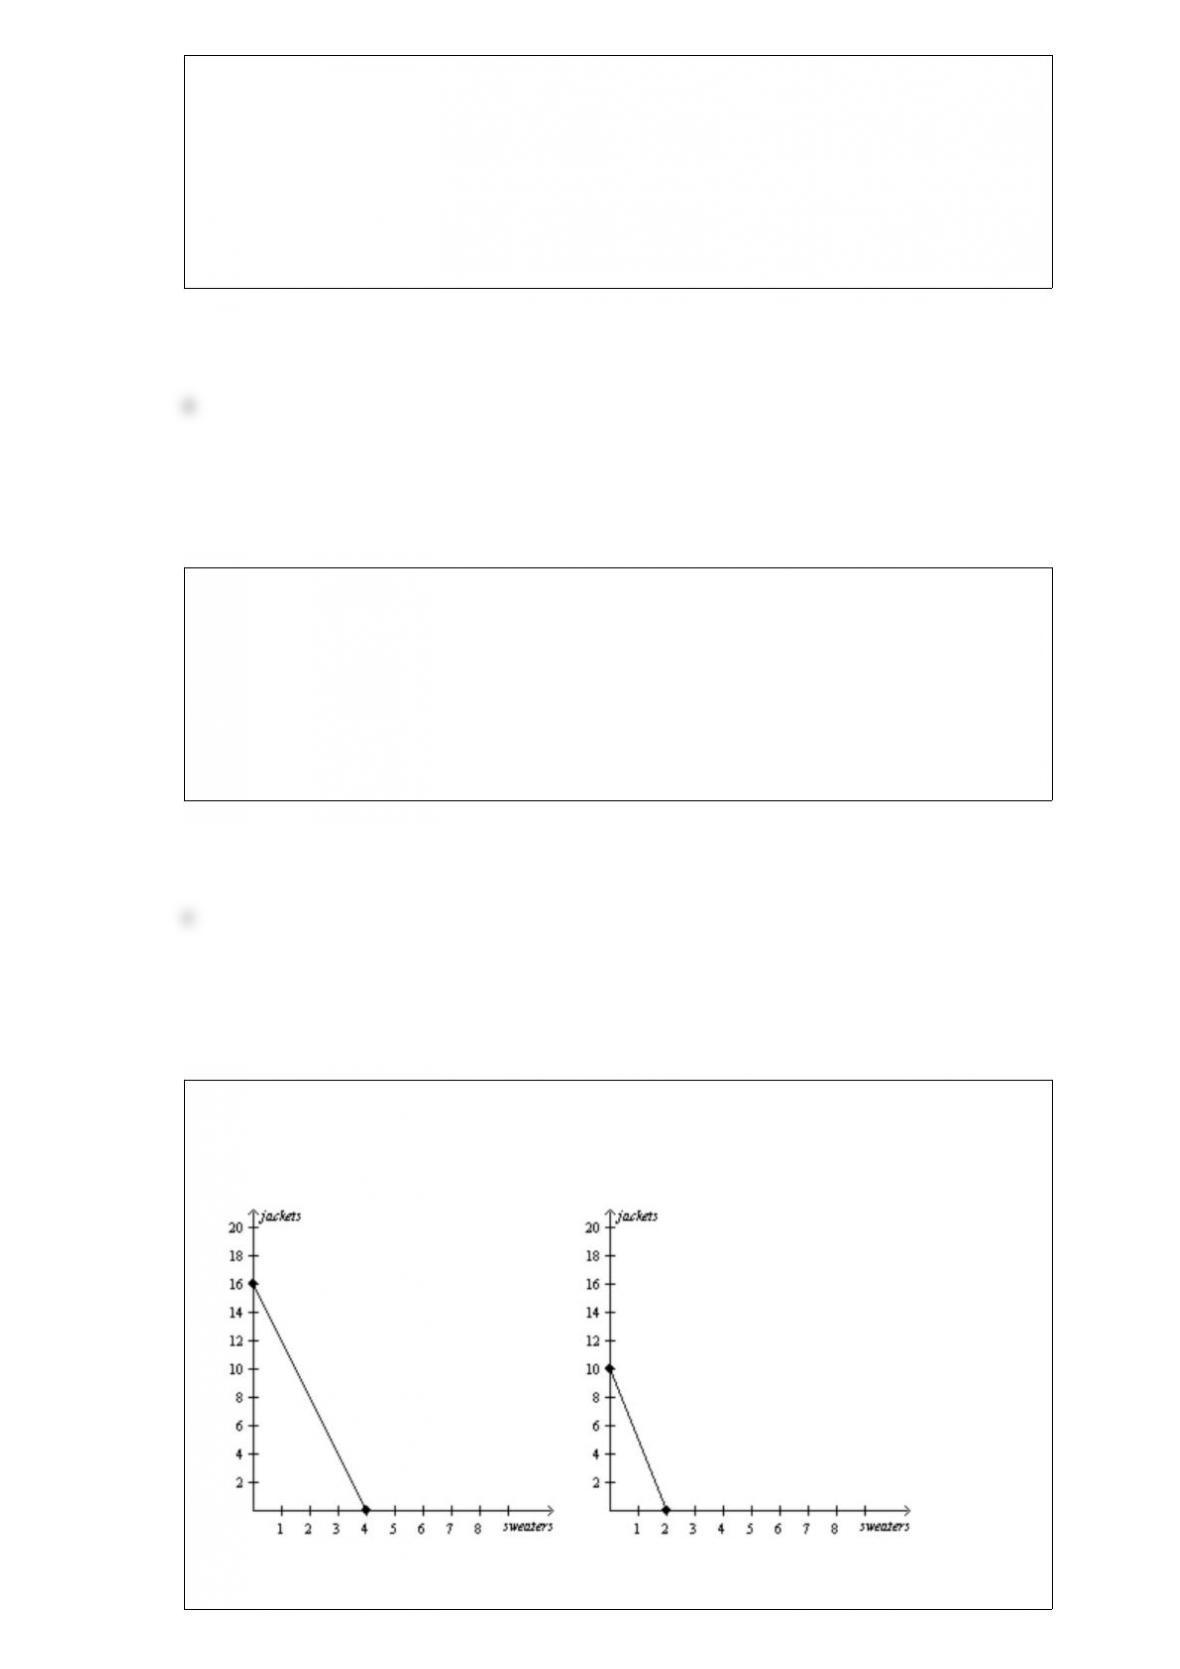
Figure 34
Lisa’s Production Possibilities FrontierBryce’s Production Possibilities Frontier
Refer to Figure 34. If Lisa and Bryce both spend all of their time producing jackets,
then total production is
a. 2 jackets.
b. 6 jackets.
c. 24 jackets.
d. 26 jackets.
Kate is a personal trainer whose client William pays $80 per hourlong session. William
values this service at $100 per hour, while the opportunity cost of Kate’s time is $75 per
hour. The government places a tax of $10 per hour on personal trainers. After the tax,
what is likely to happen in the market for personal training?
a. Kate and William will agree to a new price somewhere between $85 and $100.
b. Kate and William will agree to a new price somewhere between $70 and $110.
c. Kate will no longer offer personal training services to William because she must
charge more than $100 in order to cover her opportunity costs and pay the tax.
d. The price will remain at $80, and Kate will pay the $10 tax.
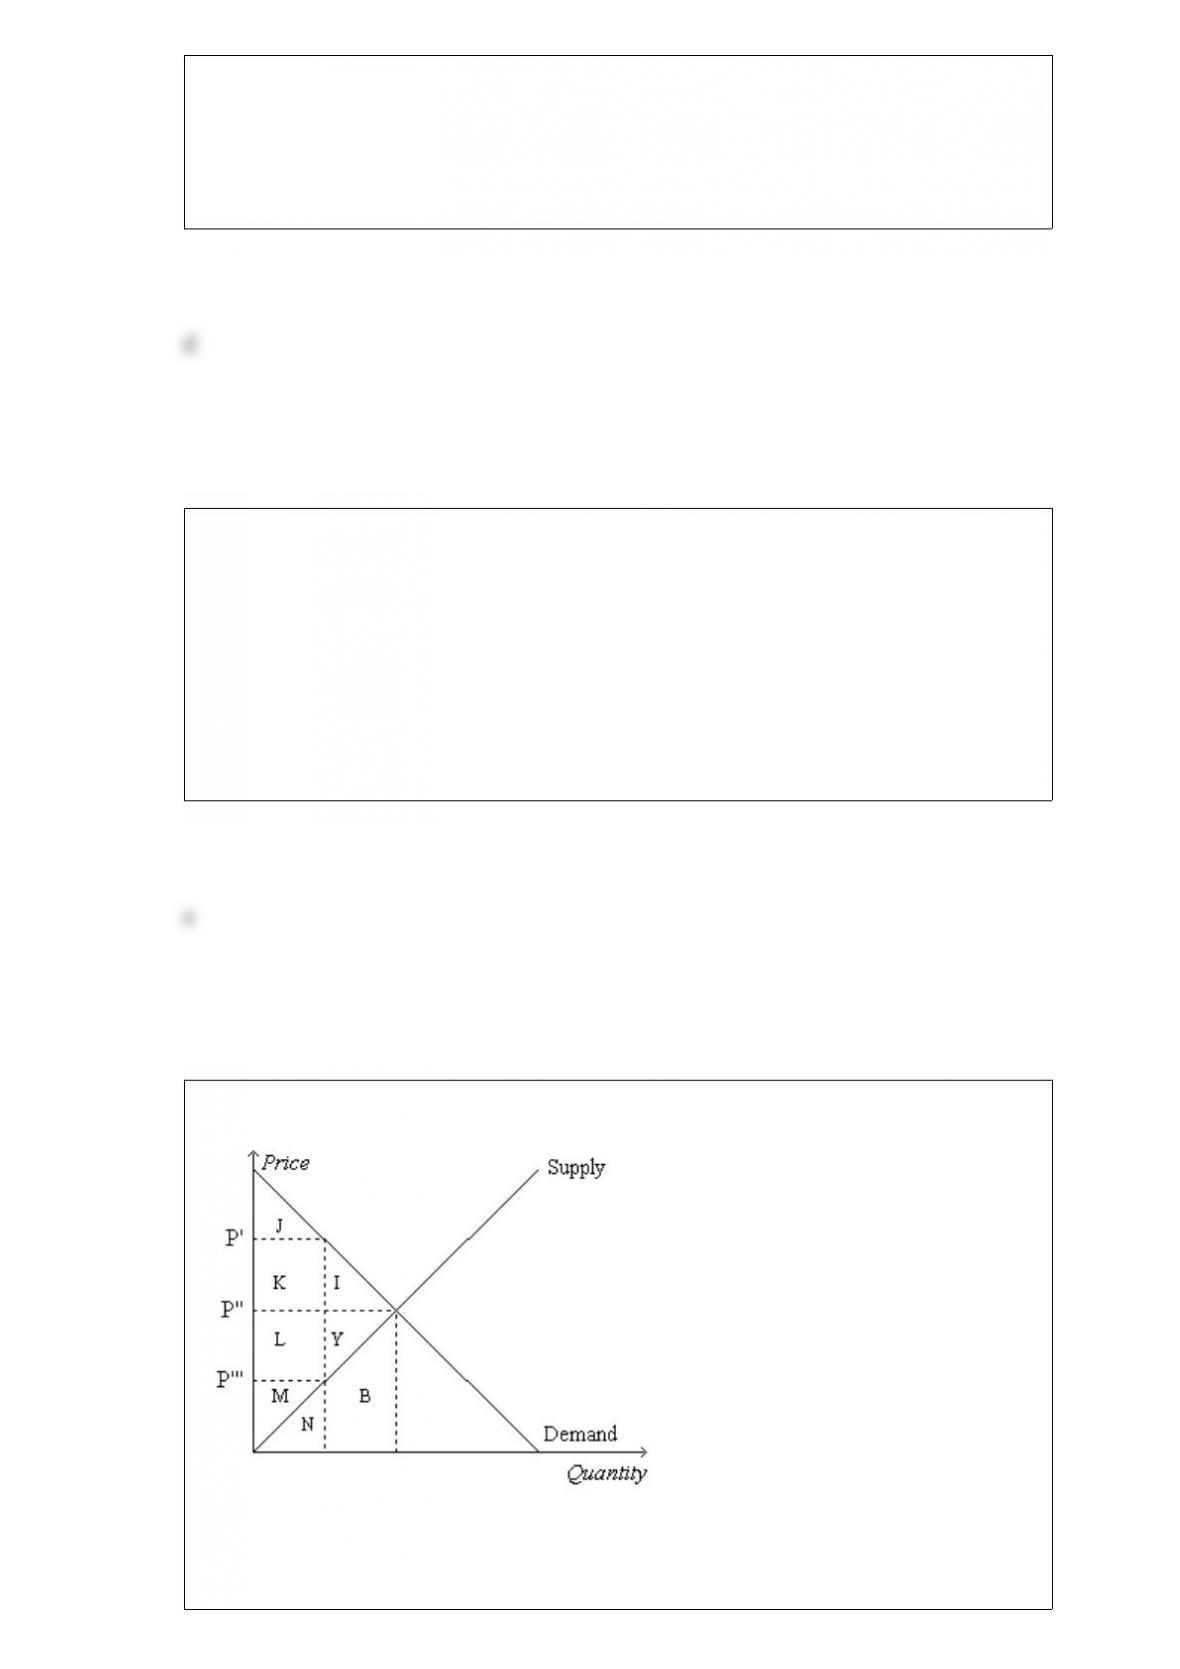
Figure 81
Refer to Figure 81. Suppose the government imposes a tax of P’ P”’. The area measured
by J+K+I represents
a. consumer surplus after the tax.

b. consumer surplus before the tax.
c. producer surplus after the tax.
d. producer surplus before the tax.