
Table 4-1
Refer to Table 4-1. The table above lists the highest prices three consumers, Tom, Dick
and Harriet, are willing to pay for a short-sleeved polo shirt. If the price of one of the
shirts is $28 dollars
A) Tom will buy two shirts, Dick will buy one shirt and Harriet will buy no shirts.
B) Tom will receive $12 of consumer surplus from buying one shirt.
C) Tom and Dick receive a total of $70 of consumer surplus from buying one shirt each.
Harriet will buy no shirts.
D) Harriet will receive $25 of consumer surplus since she will buy no shirts.
Assume that the price for swimming pool maintenance services has risen and sales of
these services have fallen. One can conclude that
A) the law of supply has been violated.
B) the demand for swimming pool maintenance services has increased.
C) the supply of swimming pool maintenance services has decreased.
D) swimming pool maintenance services are becoming more technologically advanced.

The primary purpose of ________ is to encourage the expenditure of funds on research
and development to create new products.
A) centrally planned economies
B) government-run health care
C) nationalizing oil companies
D) patents and copyrights
Assume that the demand curve for MP3 players shifts to the right and the supply curve
for MP3 players shift to the left, but the supply curve shifts less than the demand curve.
As a result
A) both the equilibrium price and quantity of MP3 players will decrease.
B) both the equilibrium price and quantity of MP3 players will increase.
C) the equilibrium price of MP3 players may increase or decrease; the equilibrium
quantity will decrease.
D) the equilibrium price of MP3 players will increase; the equilibrium quantity will
decrease.
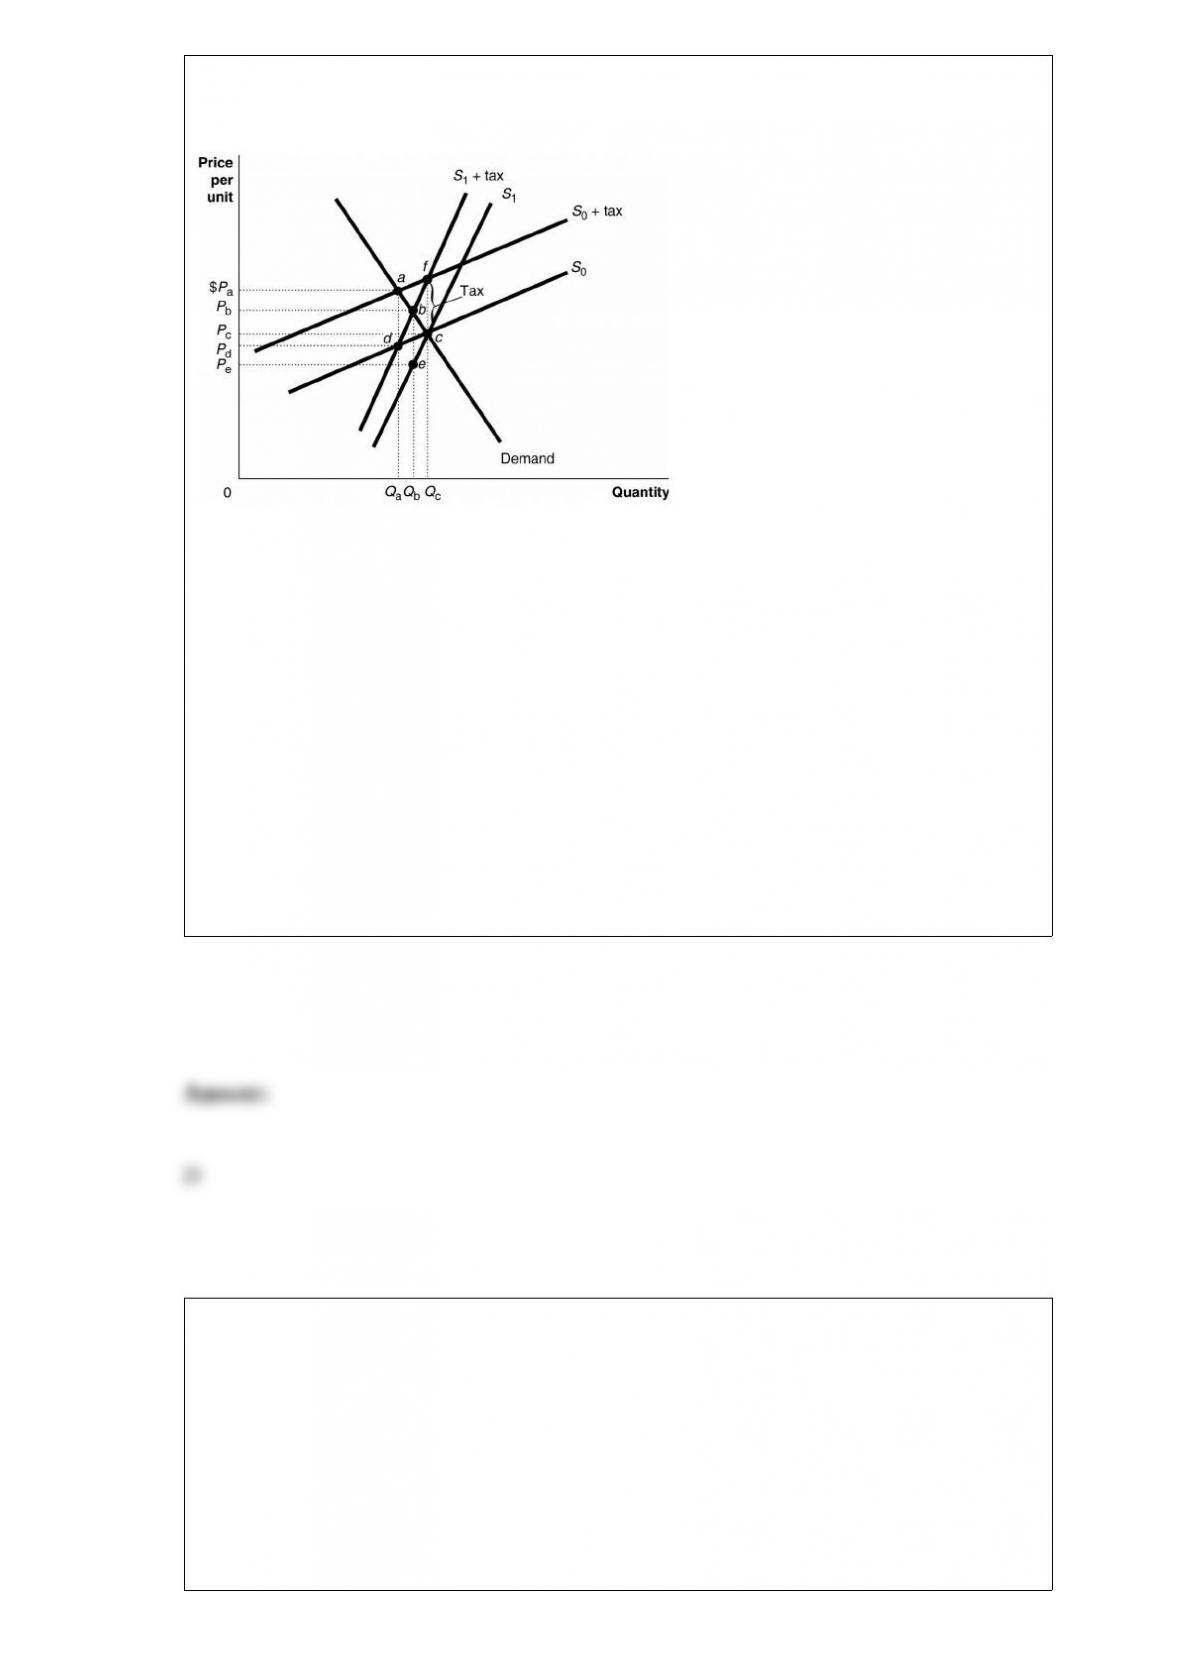
Figure 18-2
Figure 18-2 shows a demand curve and two sets of supply curves, one set more elastic
than the other.
Refer to Figure 18-2. If the government imposes an excise tax of $1.00 on every unit
sold, the producer’s burden of the tax
A) is Pa– Pdunder either supply curve.
B) is Pb– Peunder either supply curve.
C) is Pa– Pdif the supply curve is S0 and Pb– Peif the supply curve is S1.
D) is Pc– Pdif the supply curve is S0 and Pc– Peif the supply curve is S1.
Consider the following factors:
a. culture
b. religion
c. customs
d. prices
e. income
Which of the factors above are likely to influence the choices consumers make?
A) a, d, and e only
B) all the factors except b
C) all the factors except c
D) d and e only
E) all the factors listed
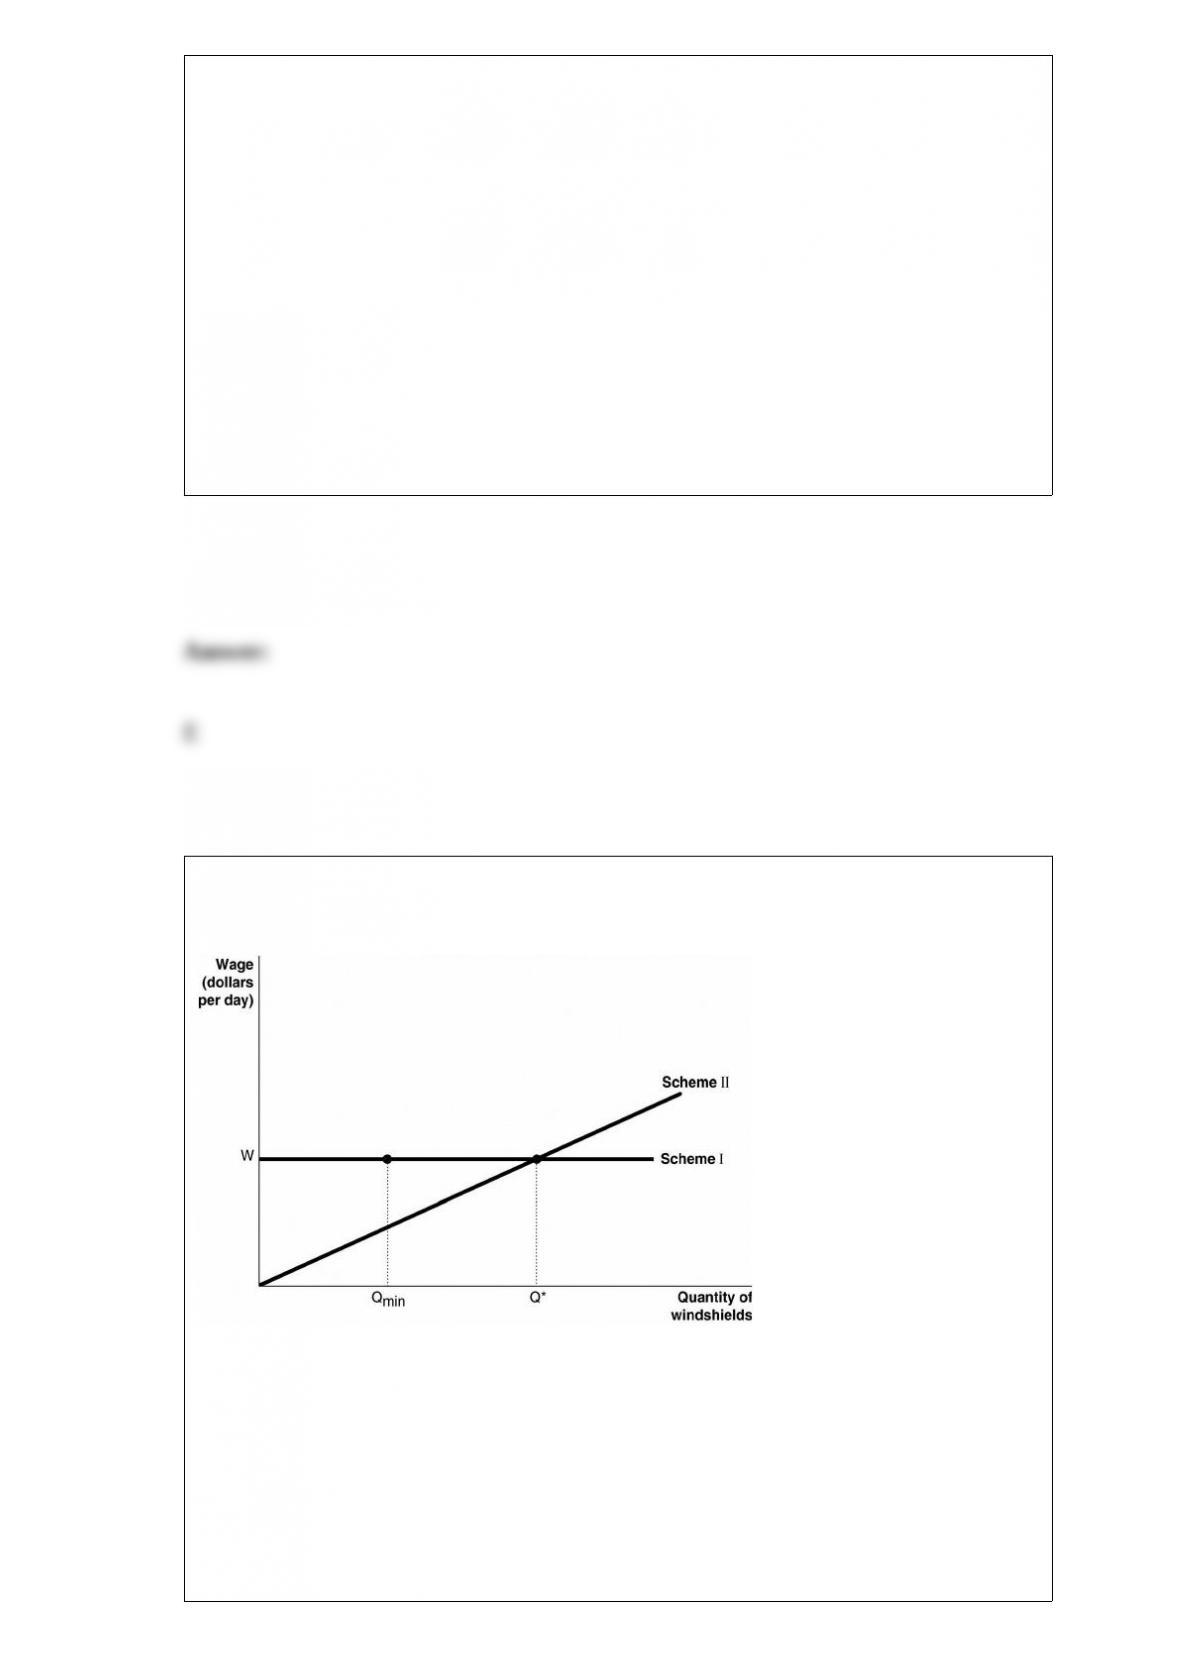
Figure 17-6
Figure 17-6 shows two different compensation schemes for the Safelite Glass
Corporation, an installer of auto glass windshields. Under Scheme I, the firm pays a
consistent wage of $80 per day based on an 8-hour workday. Qmin represents the cut-off
point under the hourly-wage system: if a worker installed fewer than Qmin windshields,
the worker got fired. Scheme II represents a piece-rate scheme with an earnings floor:
no worker would get less than $80 per day (for an 8-hour workday) and would have to
produce at least Qmin. For any output level beyond Q* the worker earned an additional

$20 for each unit produced.
Refer to Figure 17-6. Suppose Qmin = 2 windshields and Q*=5 windshields. Under
Scheme II, a worker has to install Q* windshields before she earns an additional $20
per windshield installed. What is a potential problem with this scheme?
A) Workers might be more concerned with increasing output beyond Q* and less
concerned with the quality of their work.
B) Any increase in output between Qmin and Q* benefits the employer only.
C) It violates labor laws because workers are not compensated for output between Qmin
and Q*.
D) Workers have no incentive to produce output to between Qmin and Q*.
The production function shows
A) the total cost of producing a given quantity of output.
B) the maximum output that can be produced from each possible quantity of inputs.
C) the technology used to produce output.
D) the incremental output gained by improving the production process.
On average, jobs at small firms pay ________ wages than jobs at large firms and are

________ likely to offer fringe benefits such as health insurance and retirement
accounts.
A) higher; more
B) lower; more
C) higher; less
D) lower; less
In 2013, the Educational Testing Service (ETS) charged $51 to take the Scholastic
Aptitude Test (SAT) but $150 to take the Graduate Record Exam (GRE). One reason for
this difference in price is
A) more people took the SAT than the GRE in 2013.
B) the GRE is a longer test with more questions.
C) an average, those who take the GRE have higher incomes than those who take the
SAT.
D) the ETS faces competition in the market for the SAT but no competition for the
GRE.
Buying at a low price in one market and reselling at a higher price in another market
will
A) not generate any profit because of transportation costs.
B) not generate any profit because of transactions costs.
C) eventually eliminate all of the price differences.
D) eventually eliminate most, but not necessarily all, of the price differences.
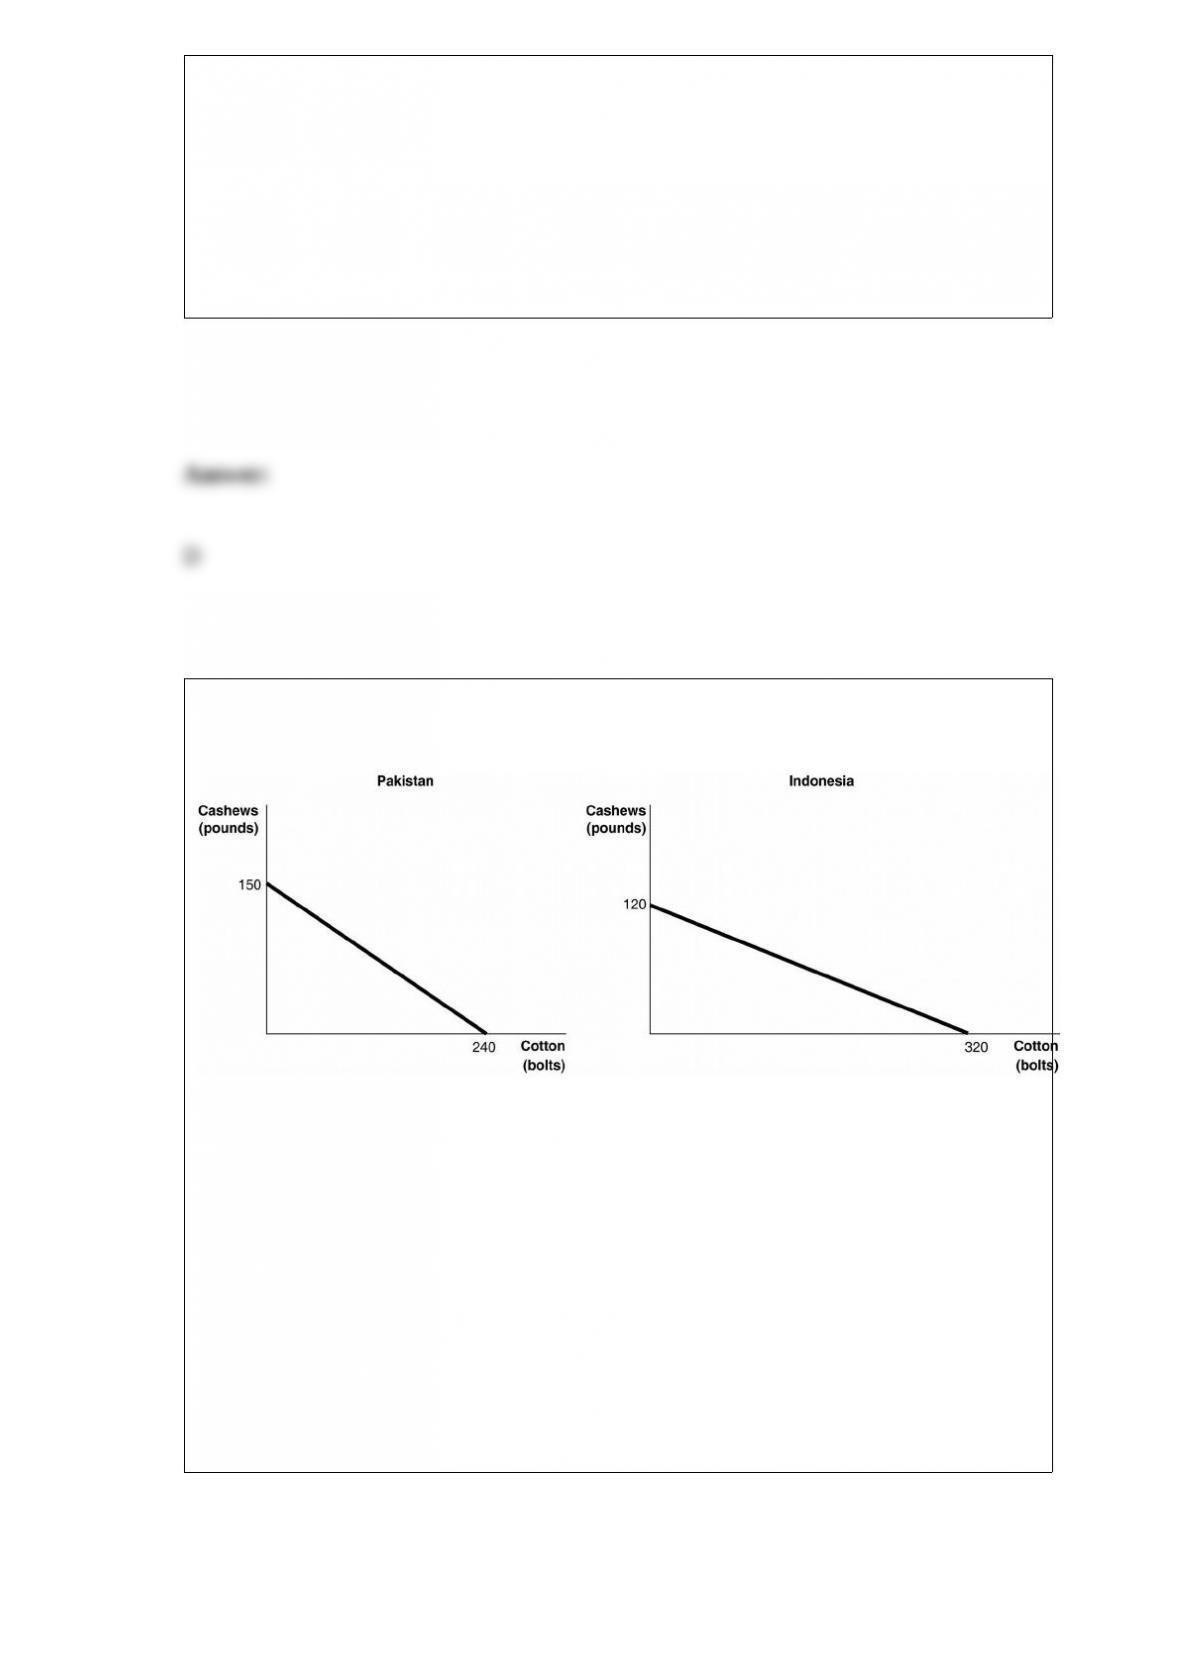
Figure 2-9
Figure 2-9 shows the production possibilities frontiers for Pakistan and Indonesia. Each
country produces two goods, cotton and cashews.
Refer to Figure 2-9. What is the opportunity cost of producing 1 bolt of cotton in
Indonesia?
A) 3/8 of a pound of cashews
B) 5/8 of a pound of cashews
C) 2 2/3 pounds of cashews
D) 120 pounds of cashews

At the state and local levels in the United States, the largest source of tax revenue is
A) individual income taxes.
B) property tax on real estate.
C) sales tax.
D) grants from the federal government.
If the selling price of a firm’s product is $500 and the estimated average cost of
producing this product is $400, what is the firm’s markup?
A) 15 percent
B) 20 percent
C) 25 percent
D) 40 percent
The price of a factor of production that is in fixed supply is called
A) economic rent.
B) economic profit.
C) a compensating differential.
D) opportunity cost.
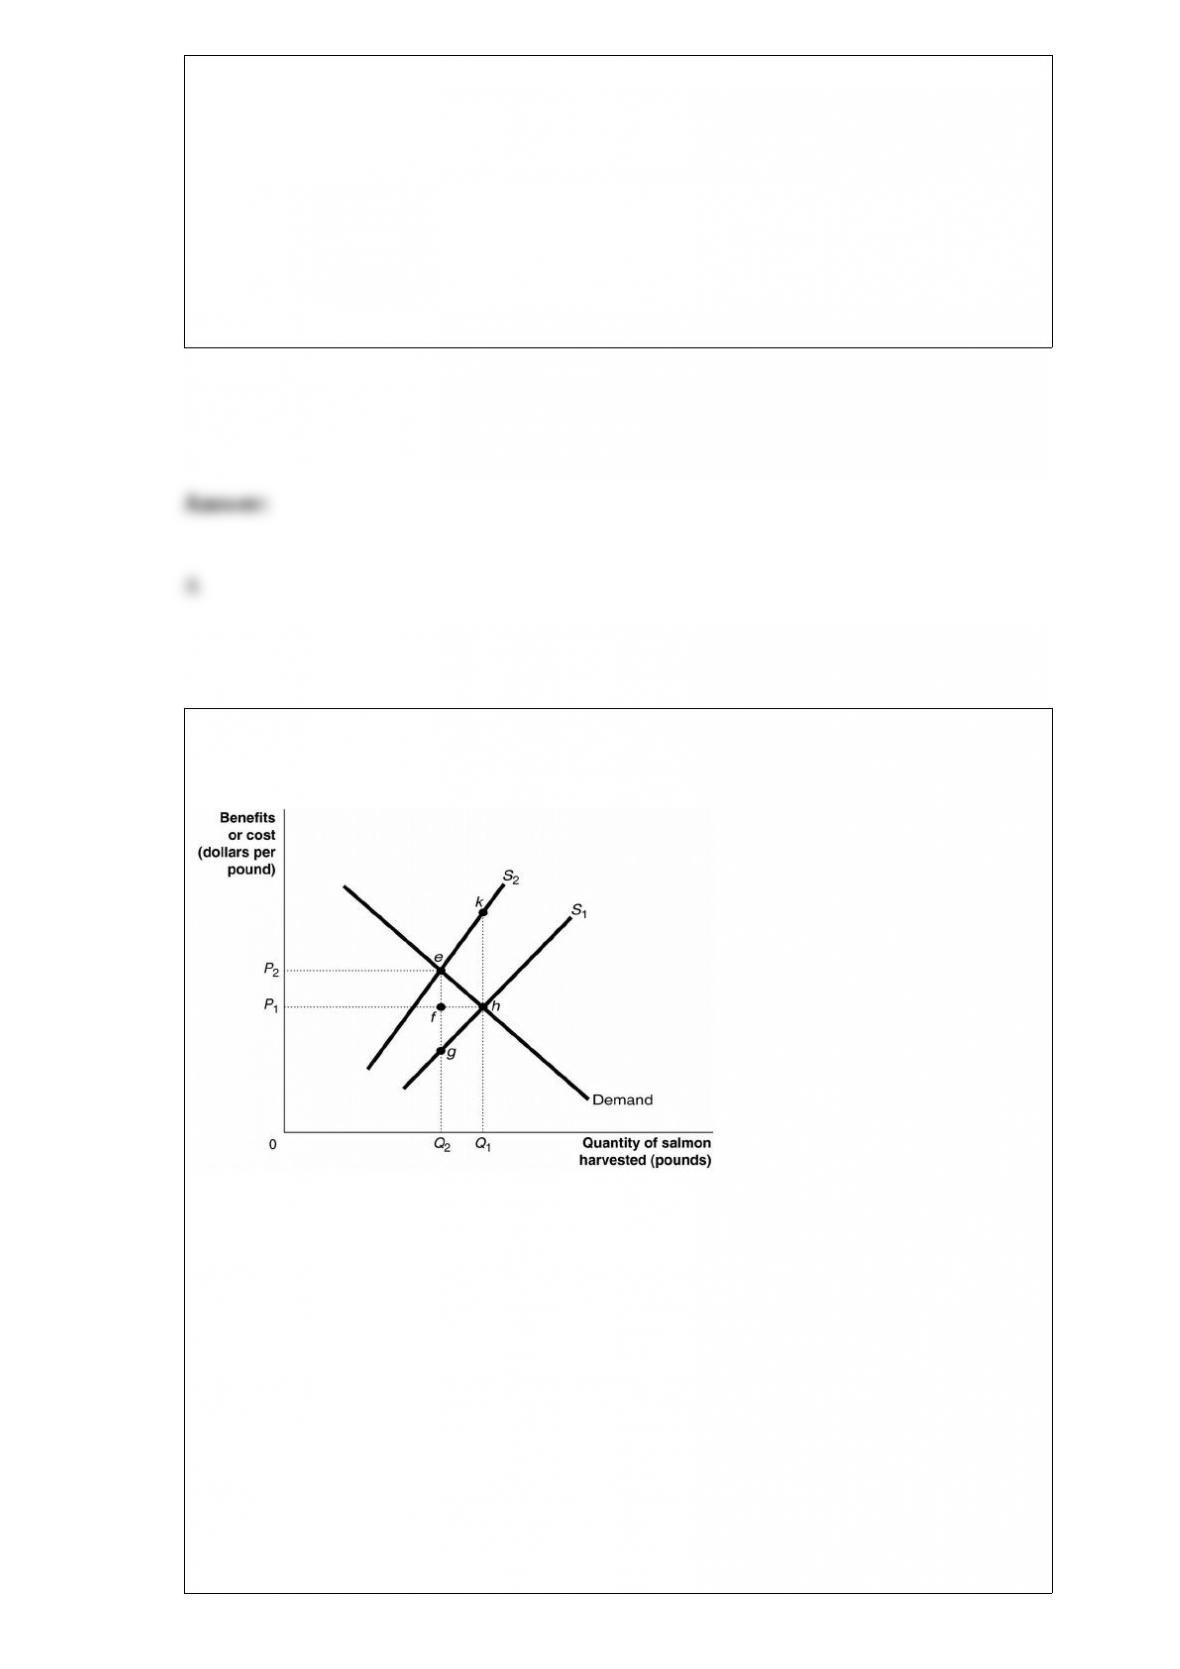
Figure 5-15
Figure 5-15 shows the market for Atlantic salmon, a common resource. The current
market equilibrium output of Q1 is not the economically efficient output. The
economically efficient output is Q2.
Refer to Figure 5-15. The current market equilibrium output is partly the result of
overfishing. In that case, what does S2 represent?
A) the private marginal benefit of harvesting salmon
B) the social marginal benefit of harvesting salmon
C) the private marginal cost of harvesting salmon

D) the social marginal cost of harvesting salmon
Article Summary
In an August 2013 speech from the Lincoln Memorial, President Obama was expected
to emphasize that increased economic equality is needed to improve racial equality.
Economic gaps based on race have endured for 50 years, with the differences in
unemployment rates between blacks and whites remaining virtually unchanged and the
gap in wealth actually increasing. “If you look at 50 years after the 1960s civil rights
movement, the most stubborn and persistent challenge when it comes to the nation’s
racial challenge remains in the areas of economics and wealth,” said Marc Morial,
president of the National Urban League.
Source: Zachary A. Goldfarb, “For Obama, 50 years after historic march, economic
equality the path to racial justice,” Washington Post, August 17, 2013.
When voluntary exchange takes place, both parties gain from the exchange.
Suppose an industry is made up of 25 firms, all with equal market share. The four-firm
concentration ratio of this industry is
A) 16%.
B) 20%.
C) 25%.

D) It cannot be determined from the information given.
Which of the following summarizes the information provided by a Lorenz curve?
A) the Lorenz coefficient
B) the income distribution ratio
C) the Gini coefficient
D) the slope (the rise divided by the run) of the Lorenz curve at a particular point on the
curve
Figure 10-3
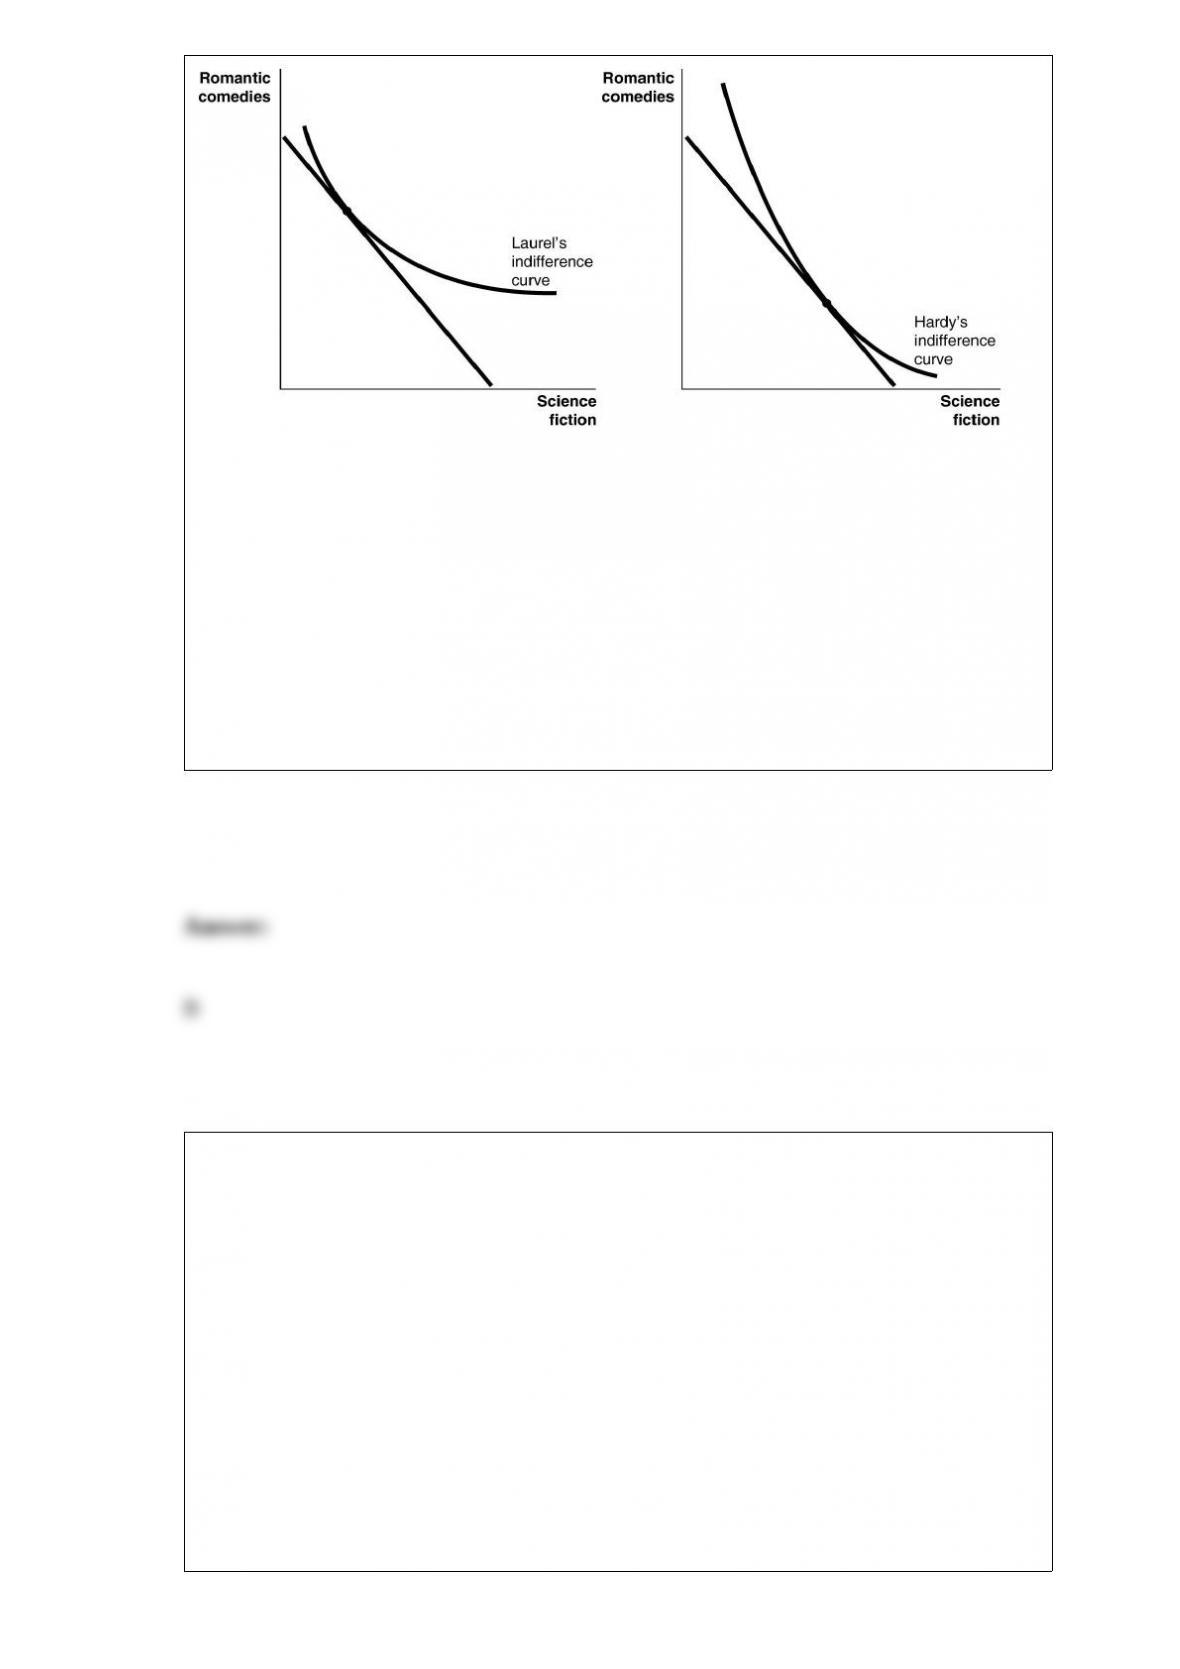
Refer to Figure 10-3. The Bobsey twins, Laurel and Hardy, both enjoy watching
romantic comedies and science fiction movies. Based on the diagrams above what can
you conclude about their movie preferences?
A) They have identical movie preferences.
B) Laurel enjoys romantic comedies more than Hardy.
C) Laurel enjoys science fiction movies more than Hardy.
D) The diagrams do not provide any information about relative preferences.
The first example used to explain comparative advantage used two countries (England
and Portugal) and two goods (wine and cloth) to show that
A) each country would be better off from trade if it had an absolute advantage in
producing one of the goods.
B) each country would have a comparative advantage in the production of the good for
which it had an absolute advantage.
C) mutually beneficial trade was possible between two countries even if one had an
absolute advantage in the production of both goods.
D) mutually beneficial trade was possible between two countries even if one had a
comparative advantage in the production of both goods.

Suppose the cross-price elasticity of demand between DVDs at Amazon.com and DVDs
at Buy.com is 3.5. Based on this information, predict what happens when Amazon.com
lowers its DVD prices by 10 percent.
A) The quantity of DVDs demanded on Amazon.com will increase by 35 percent.
B) The quantity of DVDs demanded on Buy.com will increase by 35 percent.
C) The quantity of DVDs demanded on Amazon.com will decrease by 35 percent.
D) The quantity of DVDs demanded on Buy.com will decrease by 35 percent.
Assume that production from an electric utility caused acid rain and that the
government imposed a tax on the utility equal to the cost of the acid rain. This is an
example of
A) a transaction cost.
B) a Pigovian tax.
C) a Pigovian subsidy.
D) the Coase Theorem.
Which of the following factors has significantly increased the supply of labor in the
United States since 1950?
A) a large increase in the substitution effect as a result of higher wages
B) a low birth rate and an aging population
C) an increase in the number of people who have received college degrees
D) an increase in the labor force participation rate of women
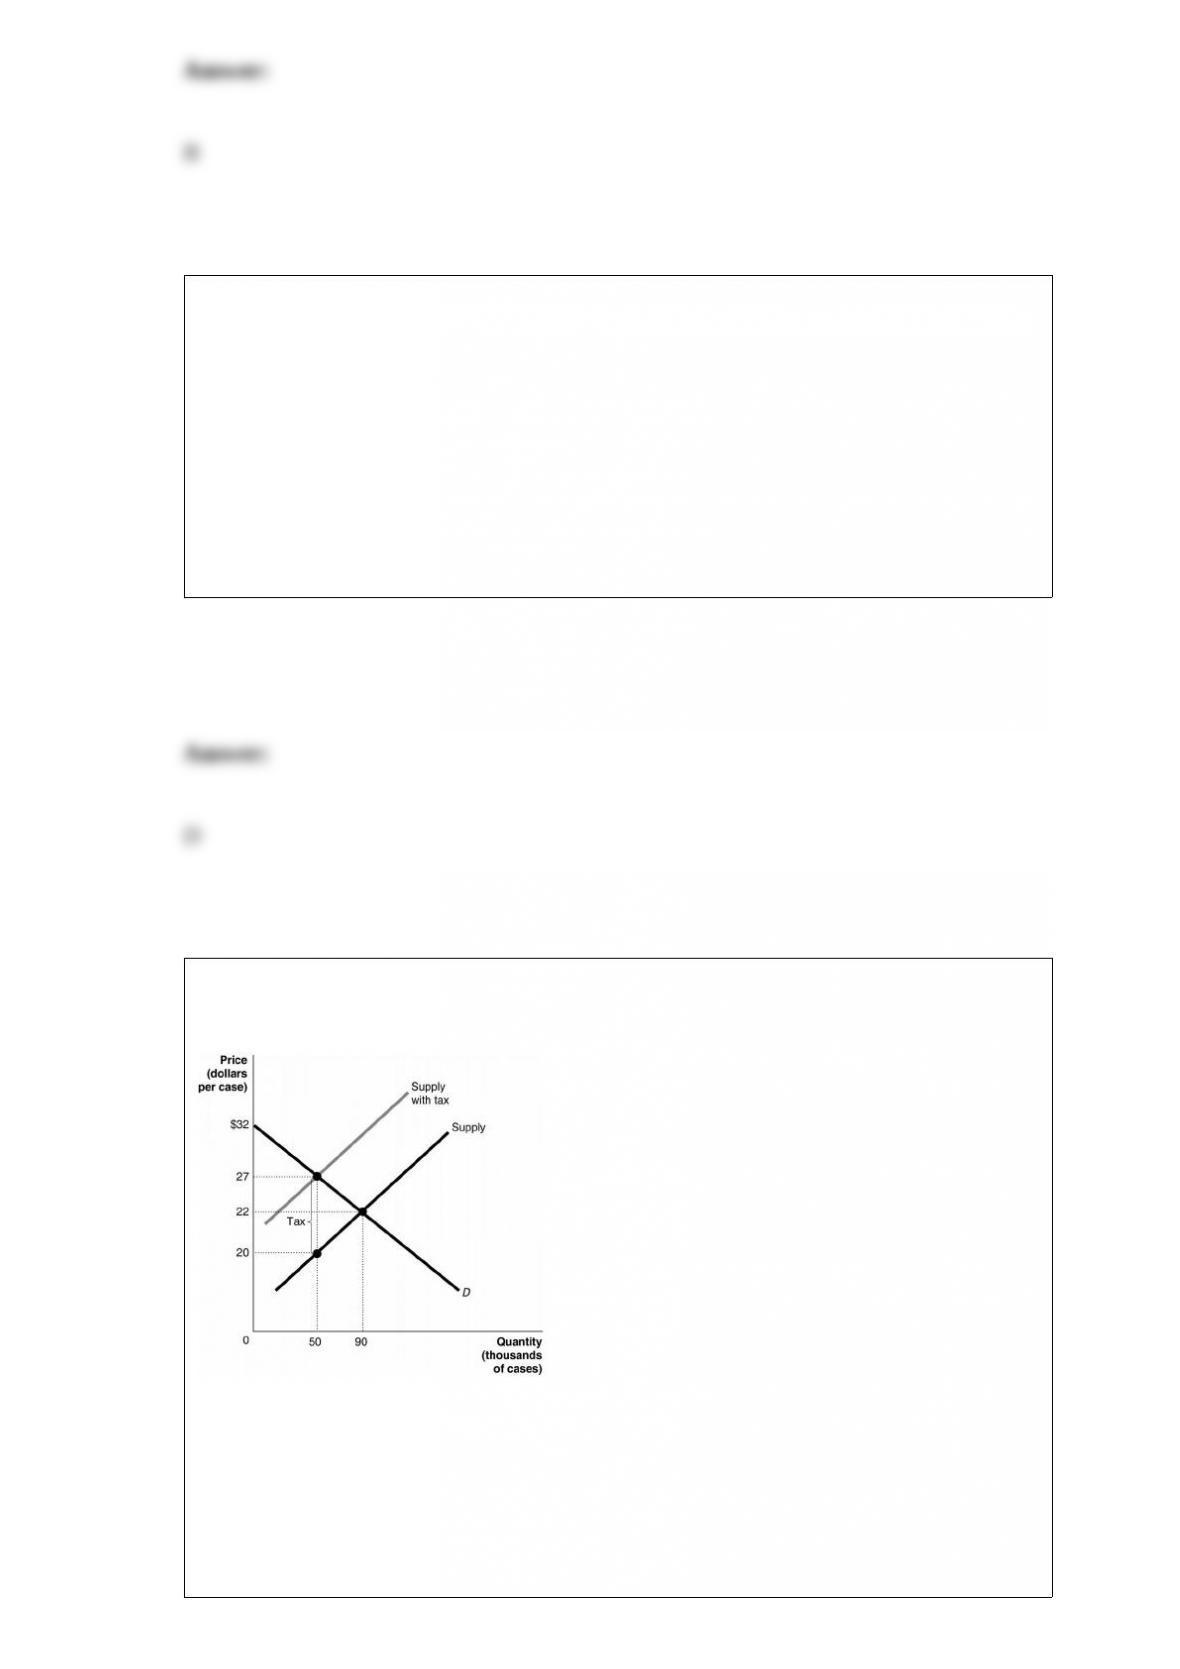
Figure 4-8
Figure 4-8 shows the market for beer. The government plans to impose a unit tax in this
market.
Refer to Figure 4-8. The price buyers pay after the tax is
A) $7.
B) $20.
C) $22.
D) $27.
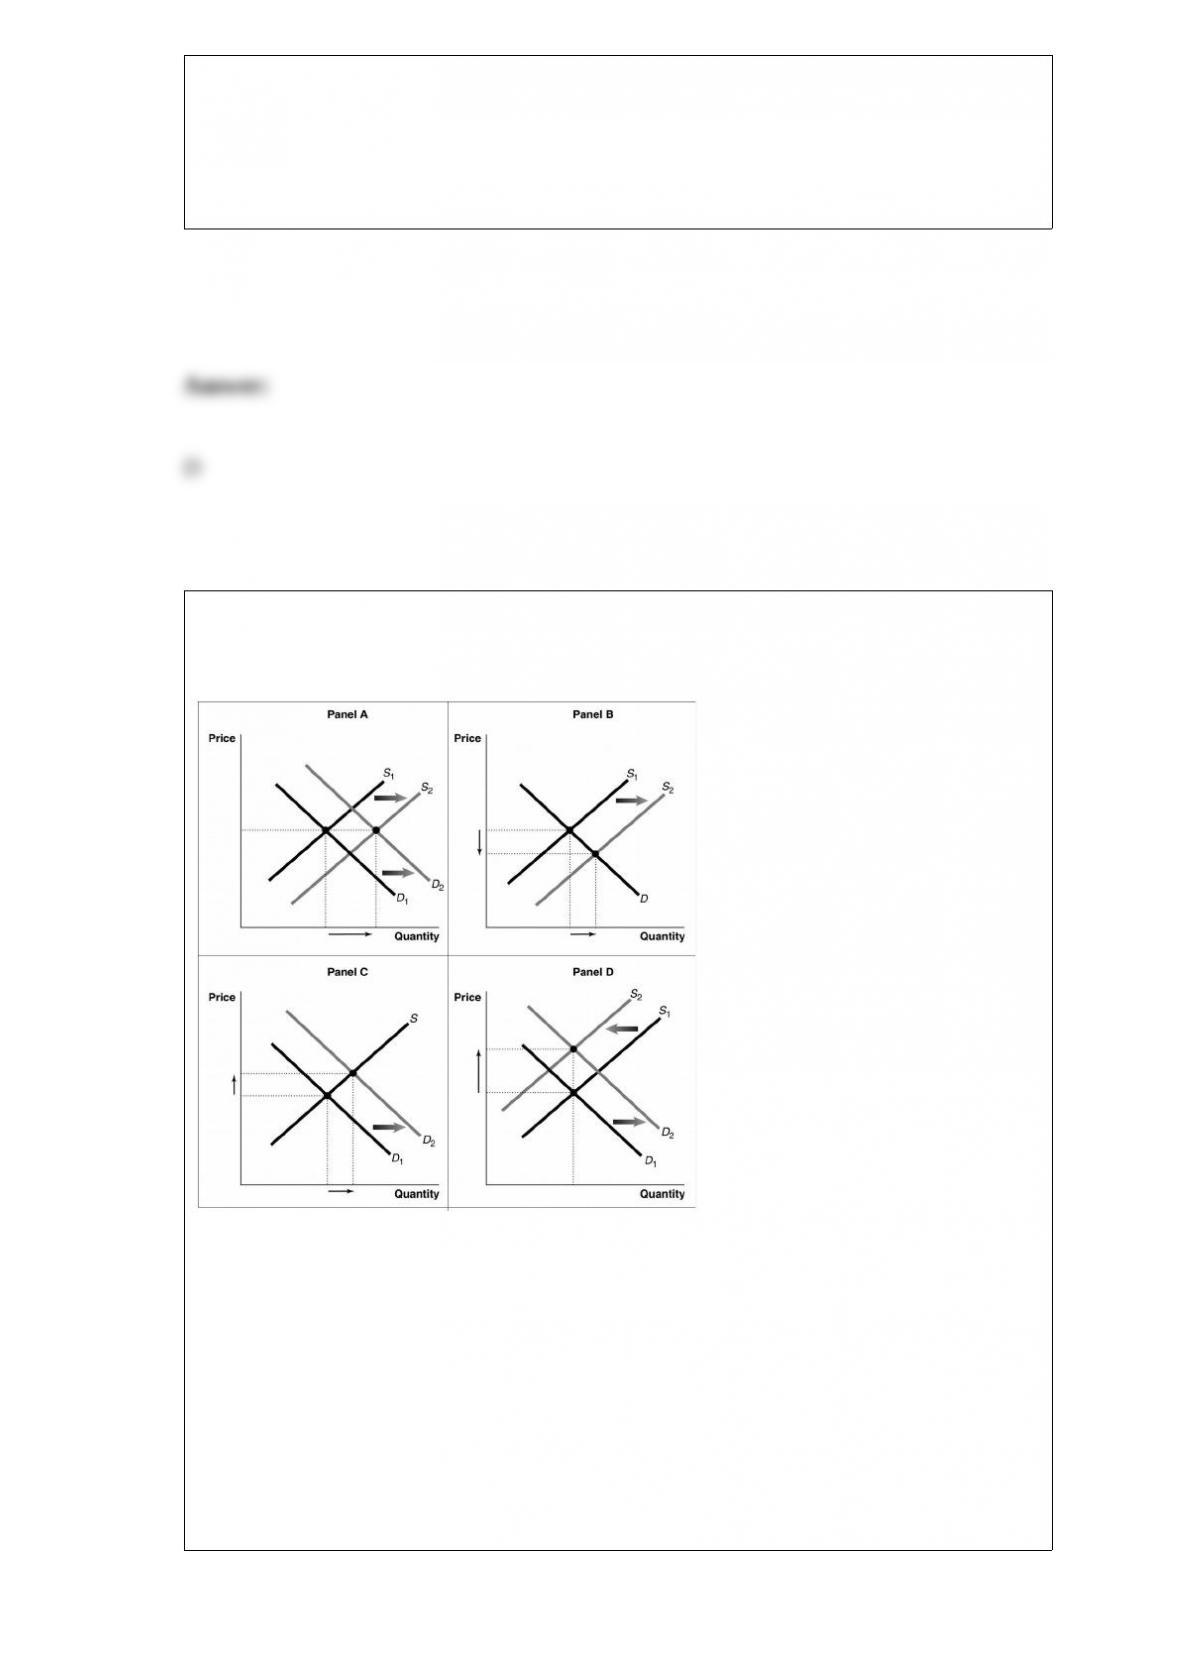
Figure 12-16
Refer to Figure 12-16. Which panel best represents the perfectly competitive organic
produce market’s transition to the long run when some firms in the market are earning
economic profits?
A) Panel A
B) Panel B
C) Panel C
D) Panel D

When the government taxes a good or service, it
A) affects the market equilibrium for that good or service.
B) eliminates the deadweight loss associated with the good or service.
C) increases consumer surplus for the good or service.
D) increases producer surplus for the good or service.
Paying a person a lower wage or excluding a person from an occupation on the basis of
an irrelevant characteristic such as race or gender
A) is economic discrimination.
B) violates federal comparable worth laws.
C) can be explained by negative feedback loops.
D) creates differences in wages that economists call “compensating differentials.”
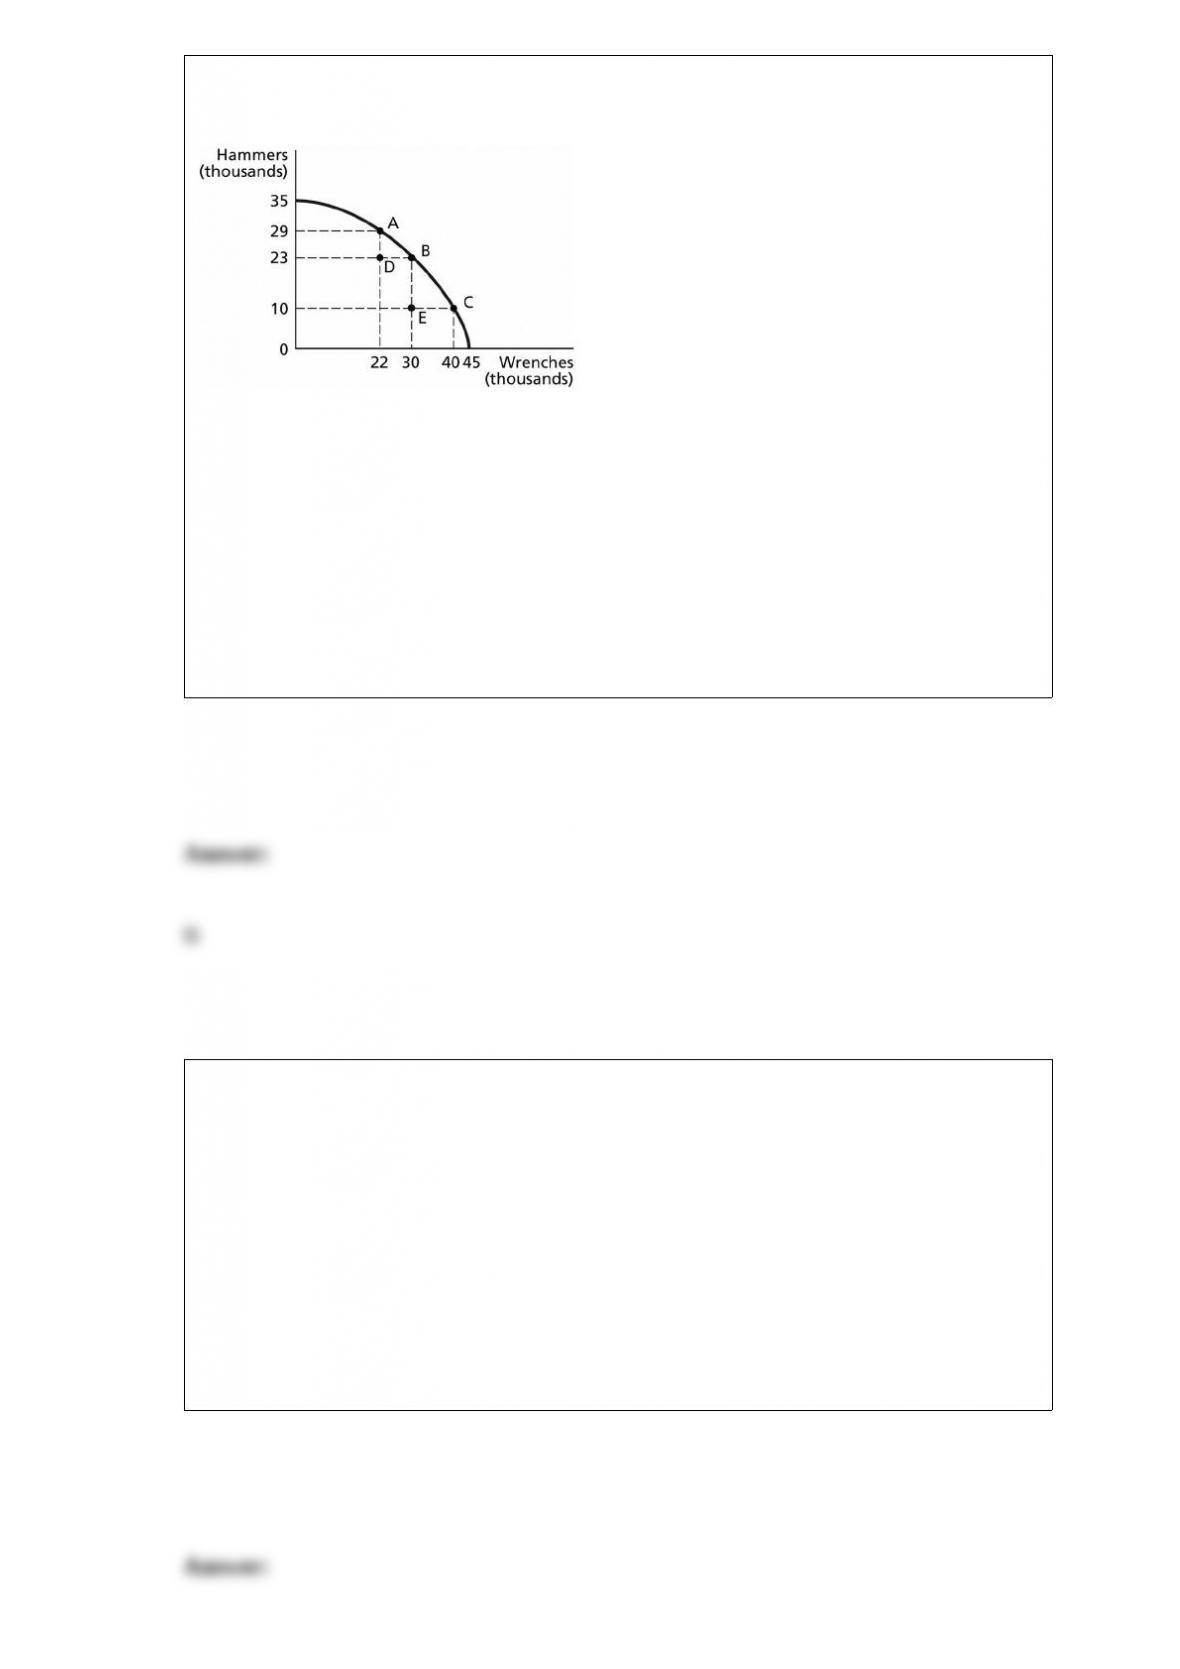
Figure 2-6
Refer to Figure 2-6. If the economy is currently producing at point A, what is the
opportunity cost of moving to point B?
A) 8 thousand wrenches
B) 6 thousand hammers
C) 30 thousand wrenches
D) 23 thousand hammers
At a price of $8 per dozen, Chuy sells 40 dozen homemade tamales per week. When he
raised her price to $12 per dozen, he still sold 40 dozen per week. Based on this
information, the demand for his tamales is
A) perfectly elastic.
B) inelastic.
C) perfectly inelastic.
D) unit-elastic.

Which of the following could explain why the demand for table salt is inelastic?
A) Salt is a luxury good.
B) Salt is a rare commodity.
C) Households devote a very small portion of their income to salt purchases.
D) Salt is a luxury for high income consumers but a necessity for low income
consumers.