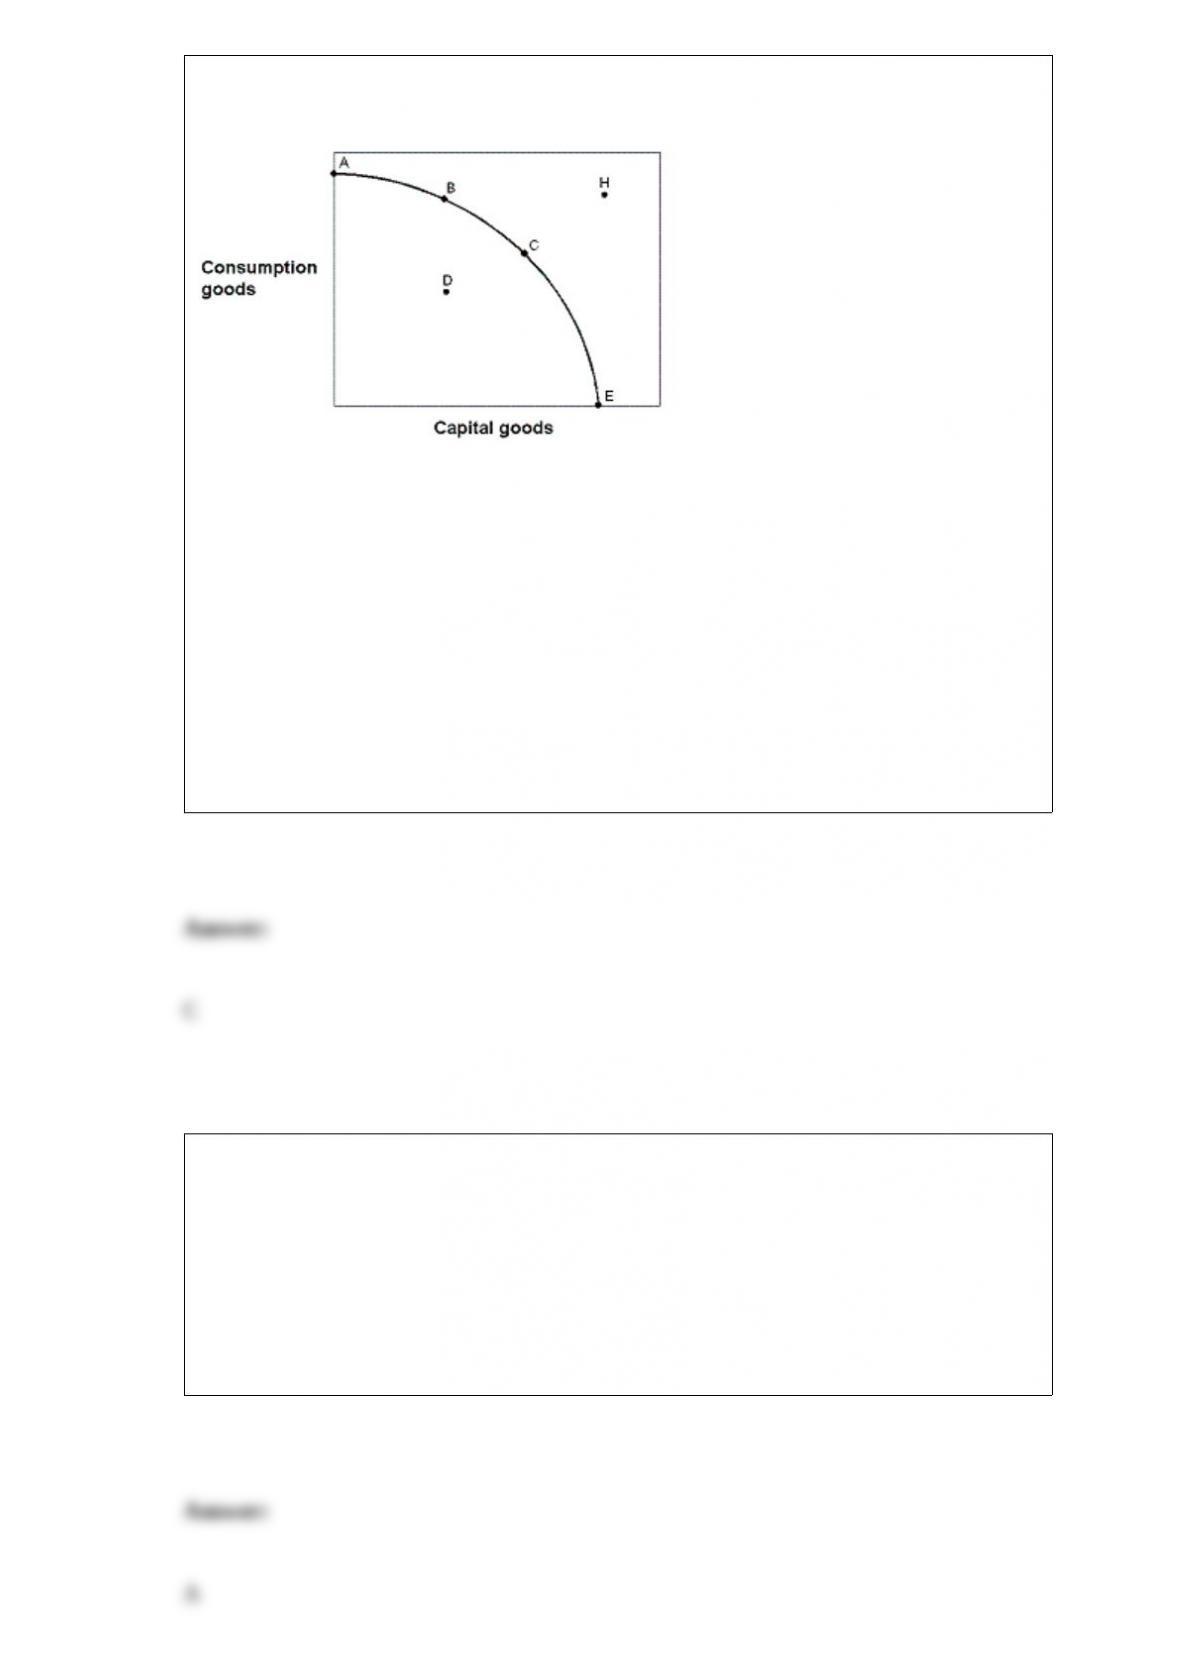
Exhibit 2-13 Production possibilities curve
In Exhibit 2-13, in terms of efficiency:
a. point A is preferred to point B.
b. point A is preferred to point E.
c. point A is preferred to point D.
d. point B is preferred to point A.
e. point B is preferred to point C.
Which of the following explain(s) better the fact that computers are cheaper now than
10 years ago?
a. c and d.
b. c and e.
c. The technology used in the production of computers has improved during this period.
d. Resources used in the production of computers have become cheaper during this
period.
e. The demand for computers has increased substantially during this period.
Suppose the government imposes a per unit tax on an item whose production process
creates a negative externality. Suppose the tax is exactly the value of the marginal
externality cost. If the government now uses the tax revenue to clean up pollution from
this process, the market will:
a. have internalized all costs and benefits.
b. be inefficient.
c. be destroyed.
d. not have failed.
e. be subject to obligatory controls.
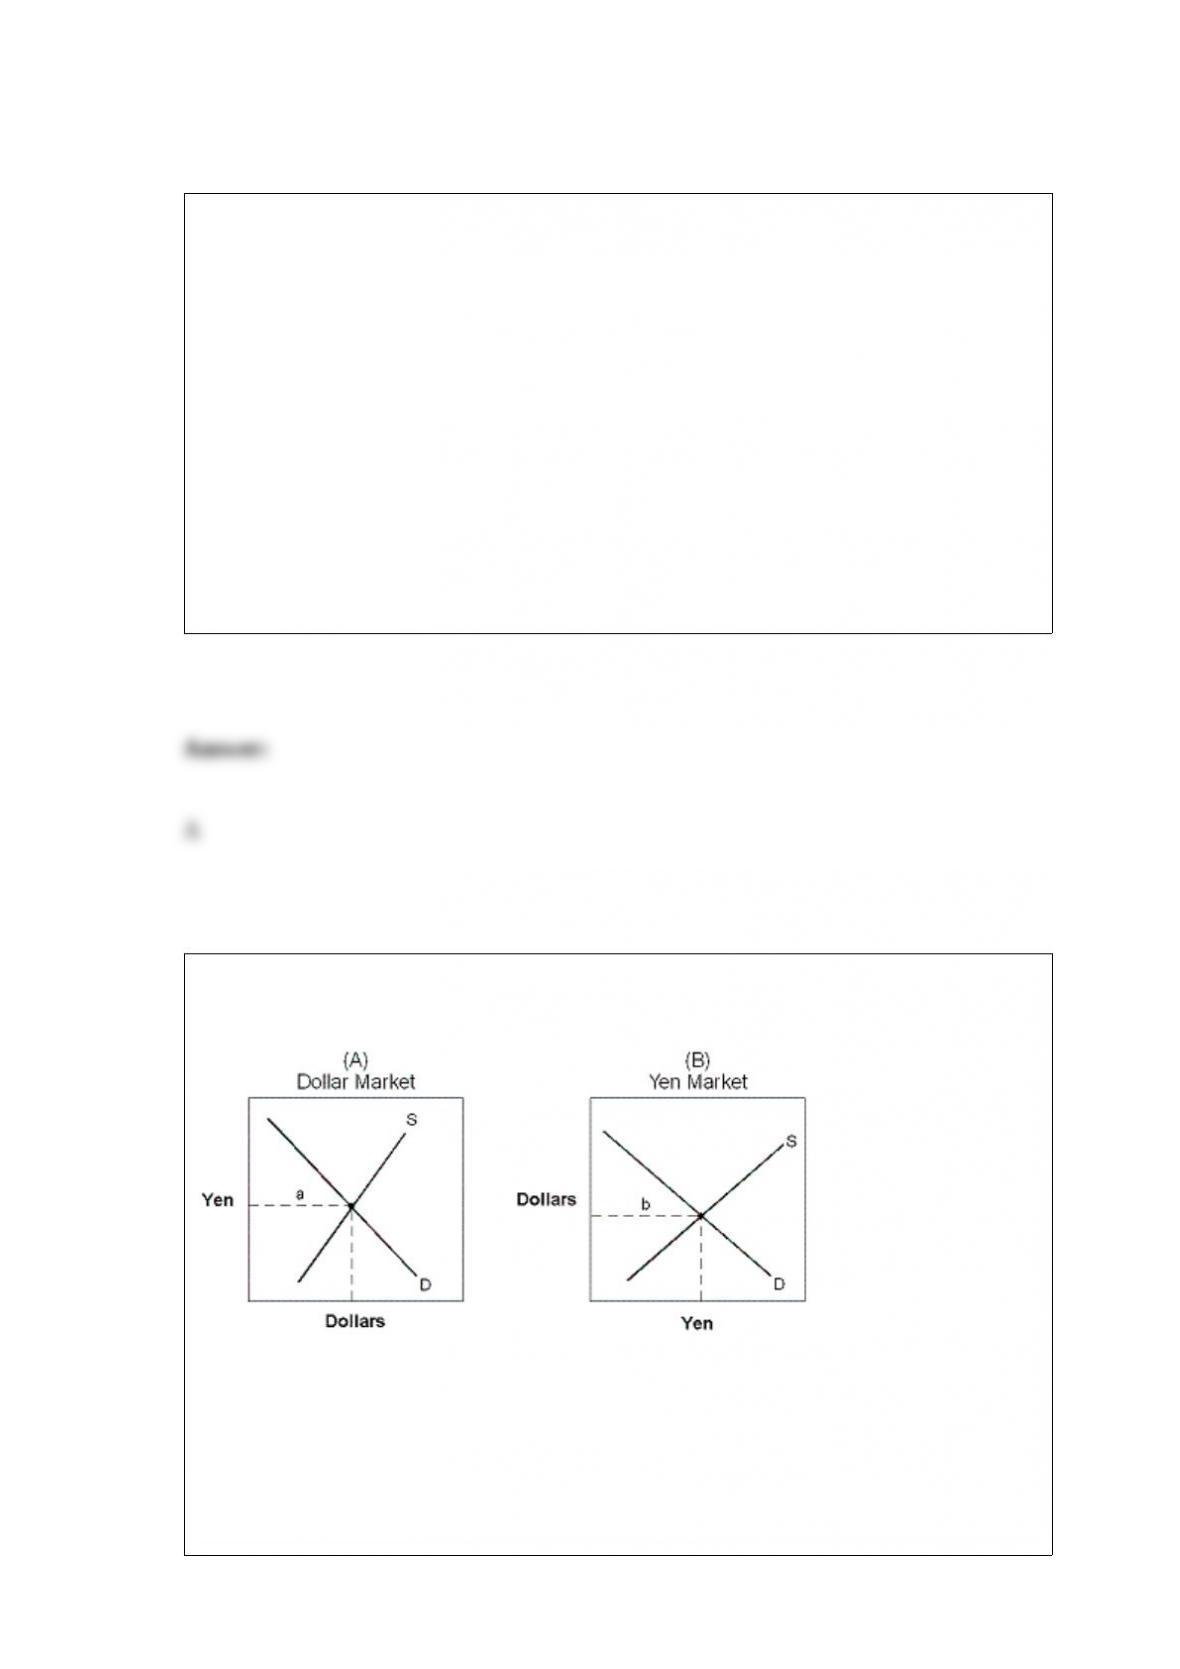
Exhibit 15-5 International currency markets
Exhibit 15-5 displays the international currency market for yen in terms of dollars and
dollars in terms of yen. The supply curve in graph 15-5(B) is determined by:
a. U.S. citizens attempting to purchase Japanese-made goods.
b. Japanese attempting to purchase U.S.-made goods.
c. U.S. businesses attempting to sell to the Japanese.
d. Japanese businesses attempting to sell to the U.S.
e. the U.S. government attempting to unload dollars to the international market.
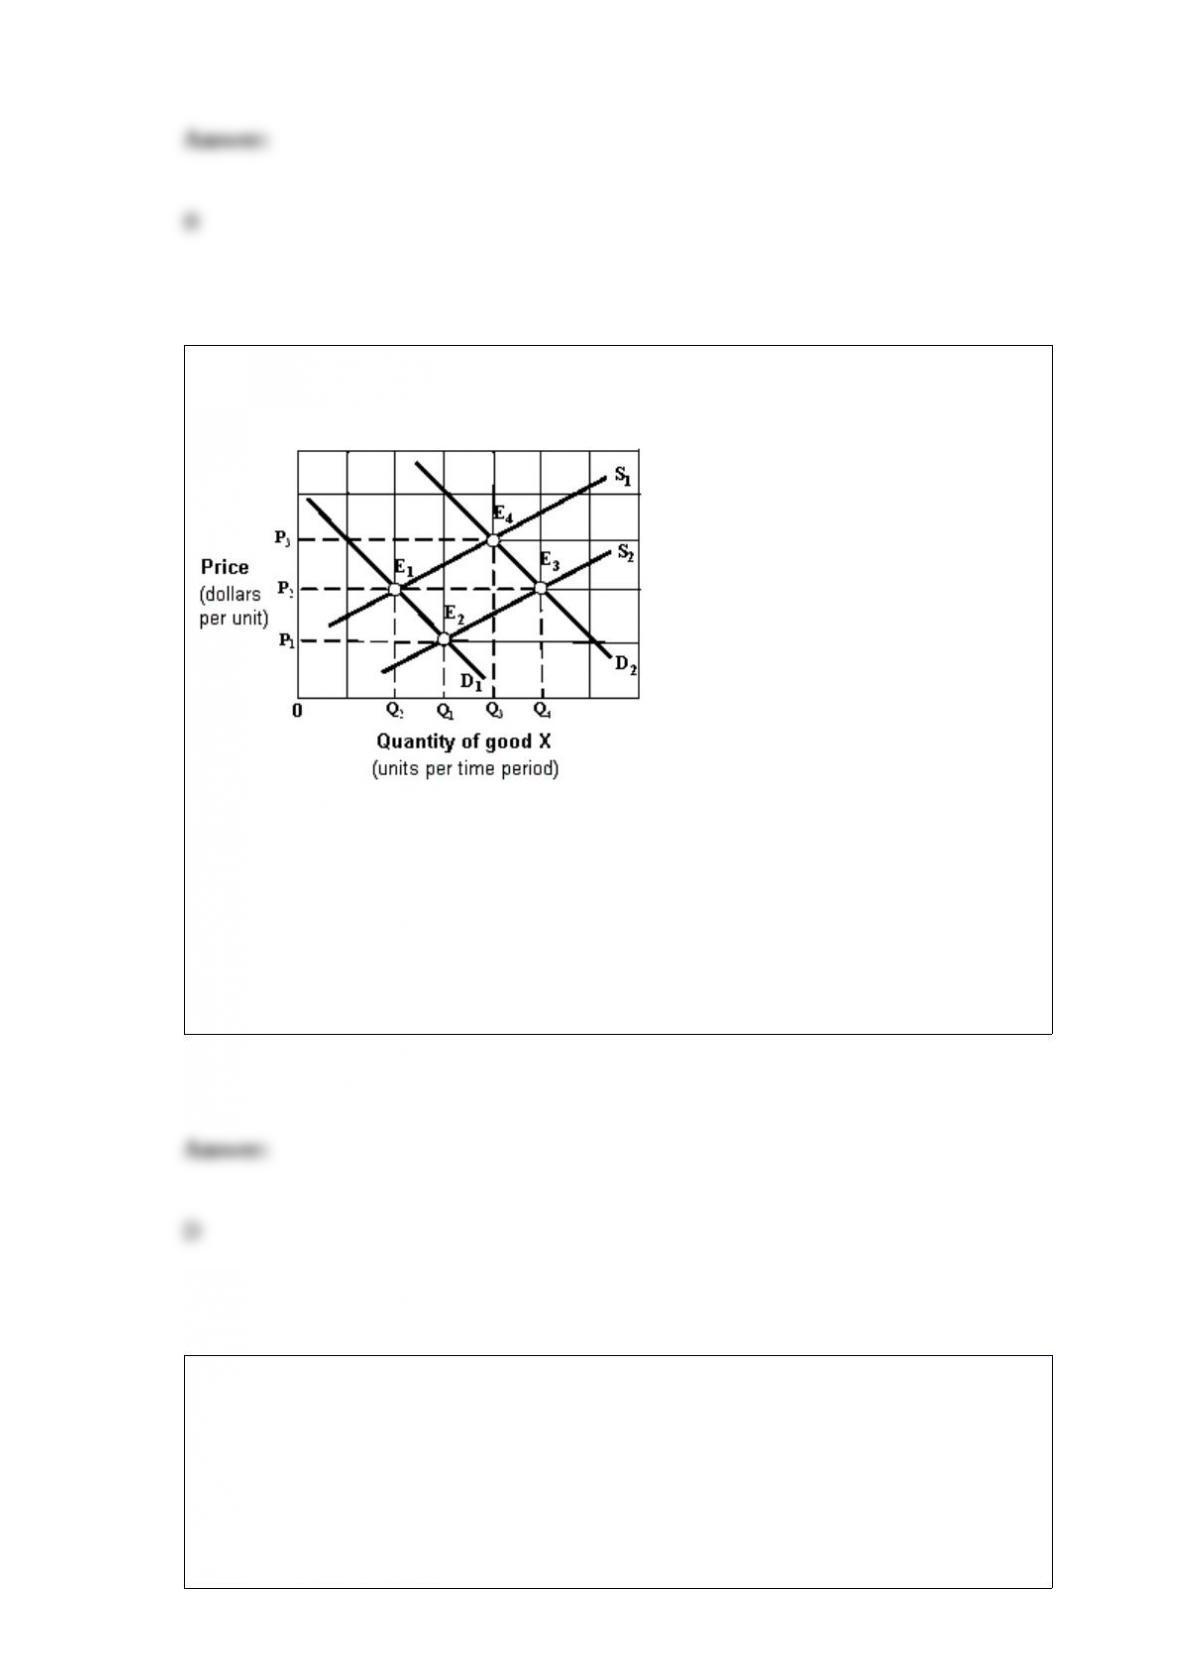
Exhibit 4-2 Supply and demand curves
Beginning from an equilibrium at point E1 in Exhibit 4-2, an increase in demand for
good X, other things being equal, would move the equilibrium point to:
a. E1, no change. c. E3.
b. E2. d. E4.
Which of the following best explains why the monopolist’s marginal revenue is less
than the selling price?
a. To sell more units, the monopolist must reduce price on all units sold.
b. As the monopolist expands output, the average total cost will decline.
c. The monopolist charges each consumer the highest possible price.
d. When a firm has a monopoly, consumers have no choice other than to pay the price
set by the monopolist.

In the context of the production possibilities curve, opportunity cost is measured in:
a. dollars paid for the goods.
b. the quantity of other goods given up.
c. the value of the resources used.
d. changing technology.
e. units of satisfaction.
A shift occurs in the supply curve for salt when:
a. the price of salt increases.
b. improvements are made in the production process.
c. salt is found to be associated with high blood pressure.
d. consumers expect the price of salt to increase in the future.
A lower price elasticity of demand coefficient occurs when:
a. many substitutes exist.
b. the quantity demanded is more responsive.
c. few substitutes exist.
d. the market is broadly defined.
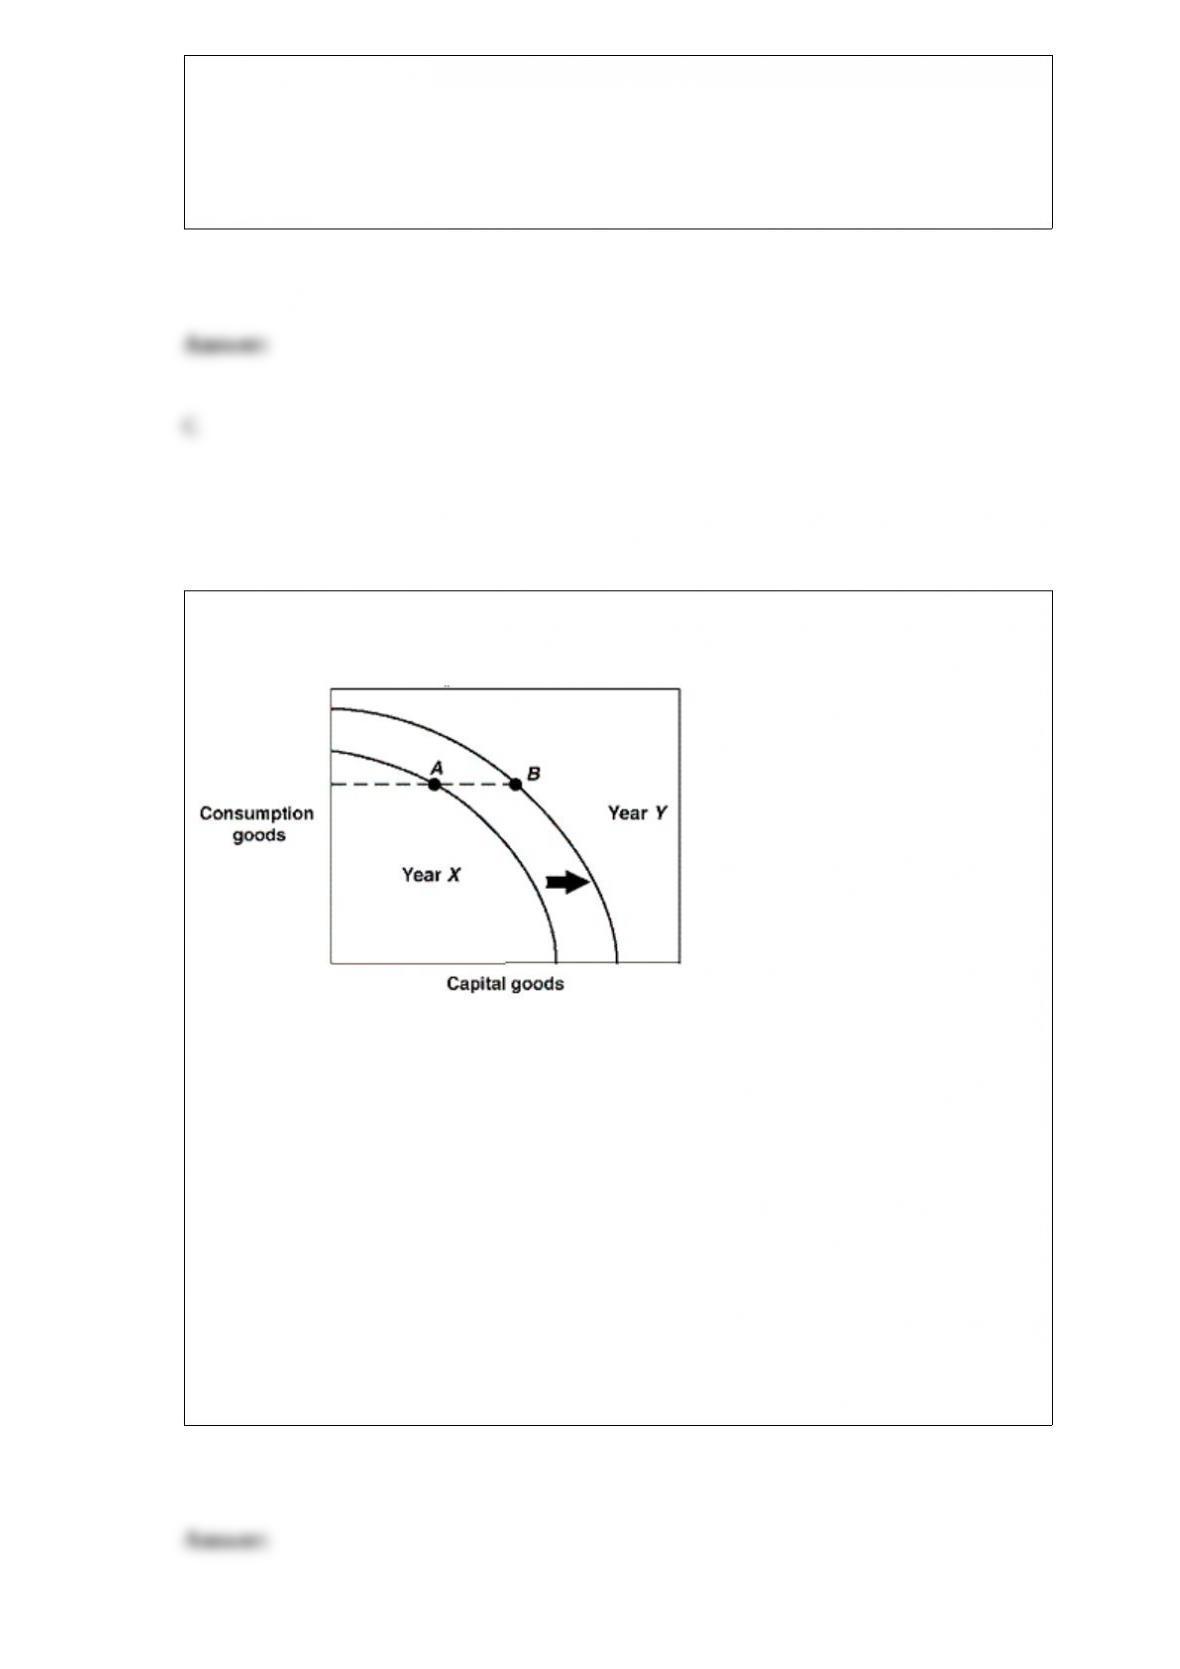
Exhibit 2-18 Production possibilities curves
In Exhibit 2-18, the production possibilities curves for a country are shown for the years
Year X and Year Y. Suppose this country was located at point A in Year X and point B
in Year Y. This economy:
a. is worse off in Year Y than in Year X.
b. has stagnated production in this two year period.
c. is more efficient in Year Y than in Year X.
d. has shown growth between these two years.
e. has higher unemployment in Year Y than in Year X.
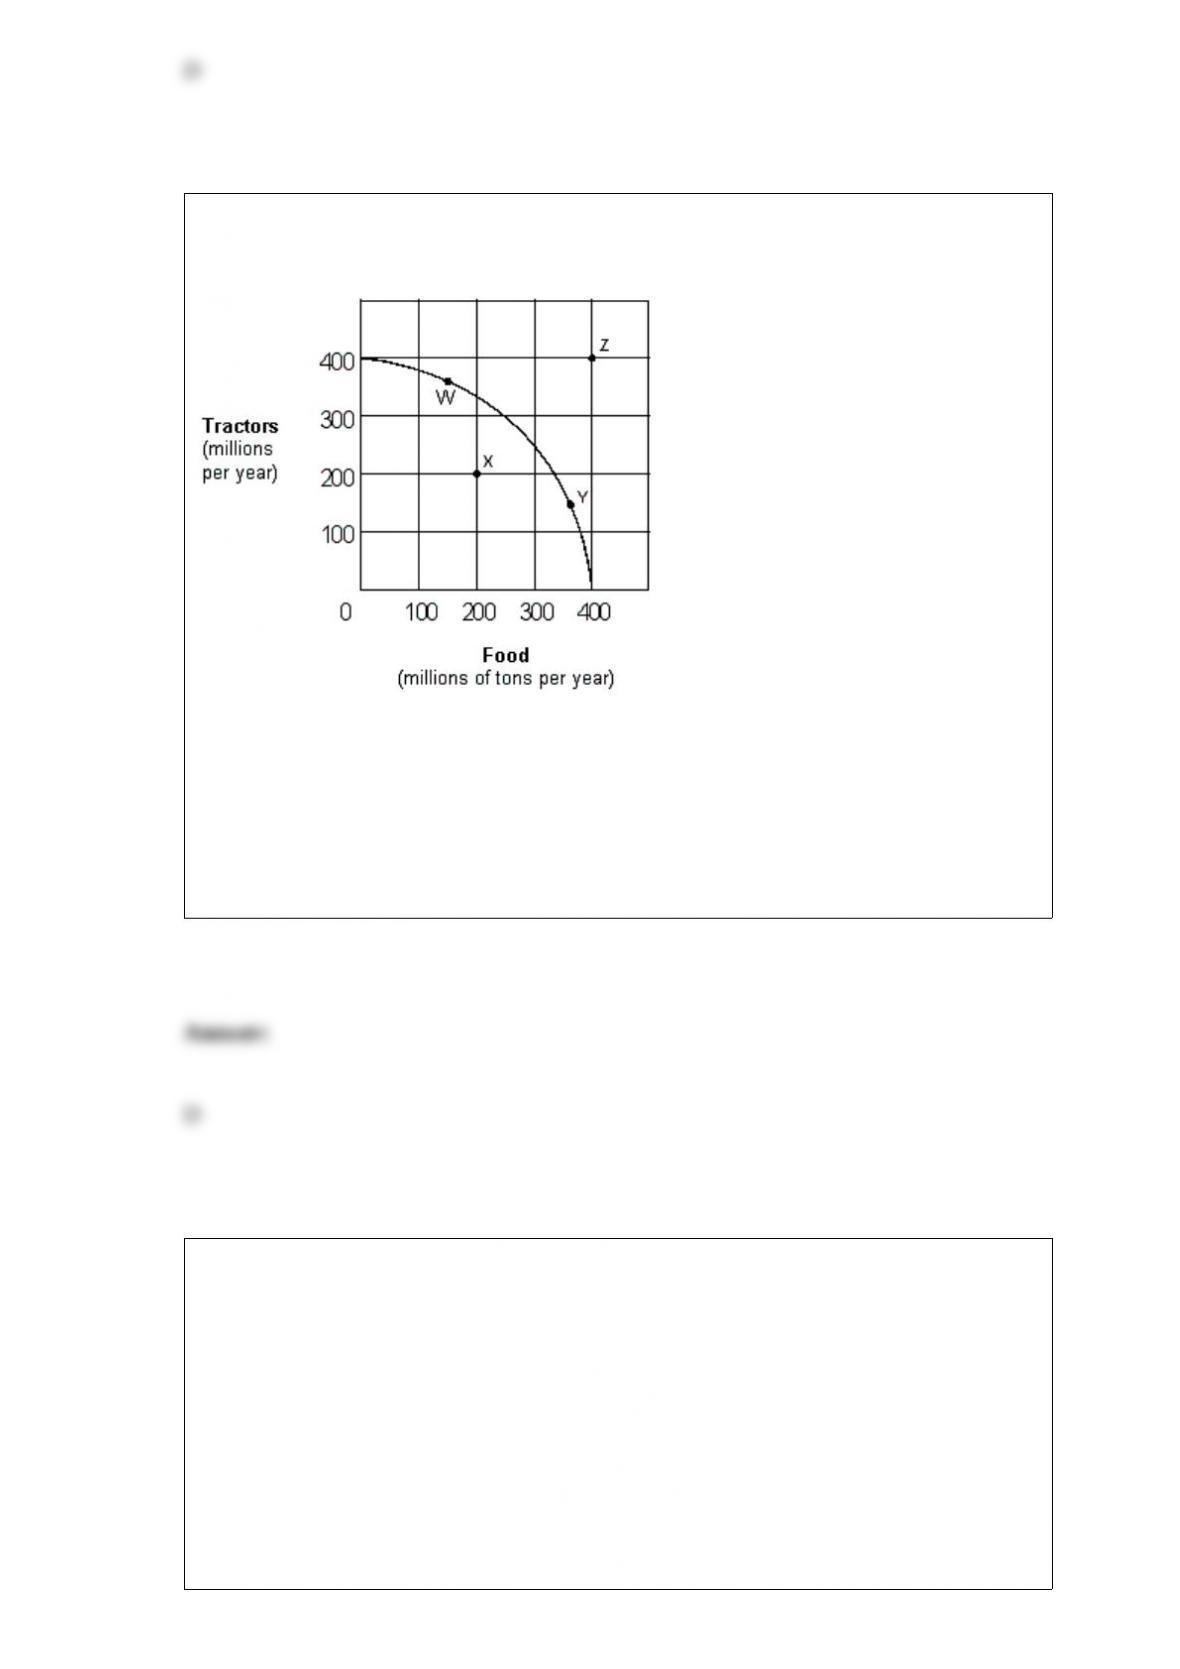
Exhibit 2-9 Production possibilities curve
Which of the following moves from one point to another in Exhibit 2-9 would represent
an increase in economic efficiency?
a. Z to W. c. W to X.
b. W to Y. d. X to Y.
The vicious circle of poverty refers to a condition where:
a. c and d.
b. c and e.
c. people are poor because they cannot invest in capital goods and they cannot invest in
capital goods because they are poor.
d. people cannot invest in capital goods because they are poor and they are poor
because they cannot invest in capital goods.

e. poverty is relative and poor people remain poor because the wealthy grow wealthier.
Three of the four events described below might reasonably be expected to shift the
demand curve for beef to a new position. One would not shift that demand curve. The
single exception is a(n):
a. change in people’s tastes for beef.
b. increase in the money incomes of beef consumers.
c. fall in the price of beef.
d. change in the price of a product competitive with beef (e.g. pork).
In the short run, if average variable cost equals $50, average total cost equals $75, and
output equals 100, the total fixed cost must be:
a. $25.
b. $2,500.
c. $5,000.
d. $7,500.
Since 1929, the distribution of income in the United States has become:
a. substantially more equal.
b. slightly more equal.
c. slightly more unequal.
d. substantially more unequal.
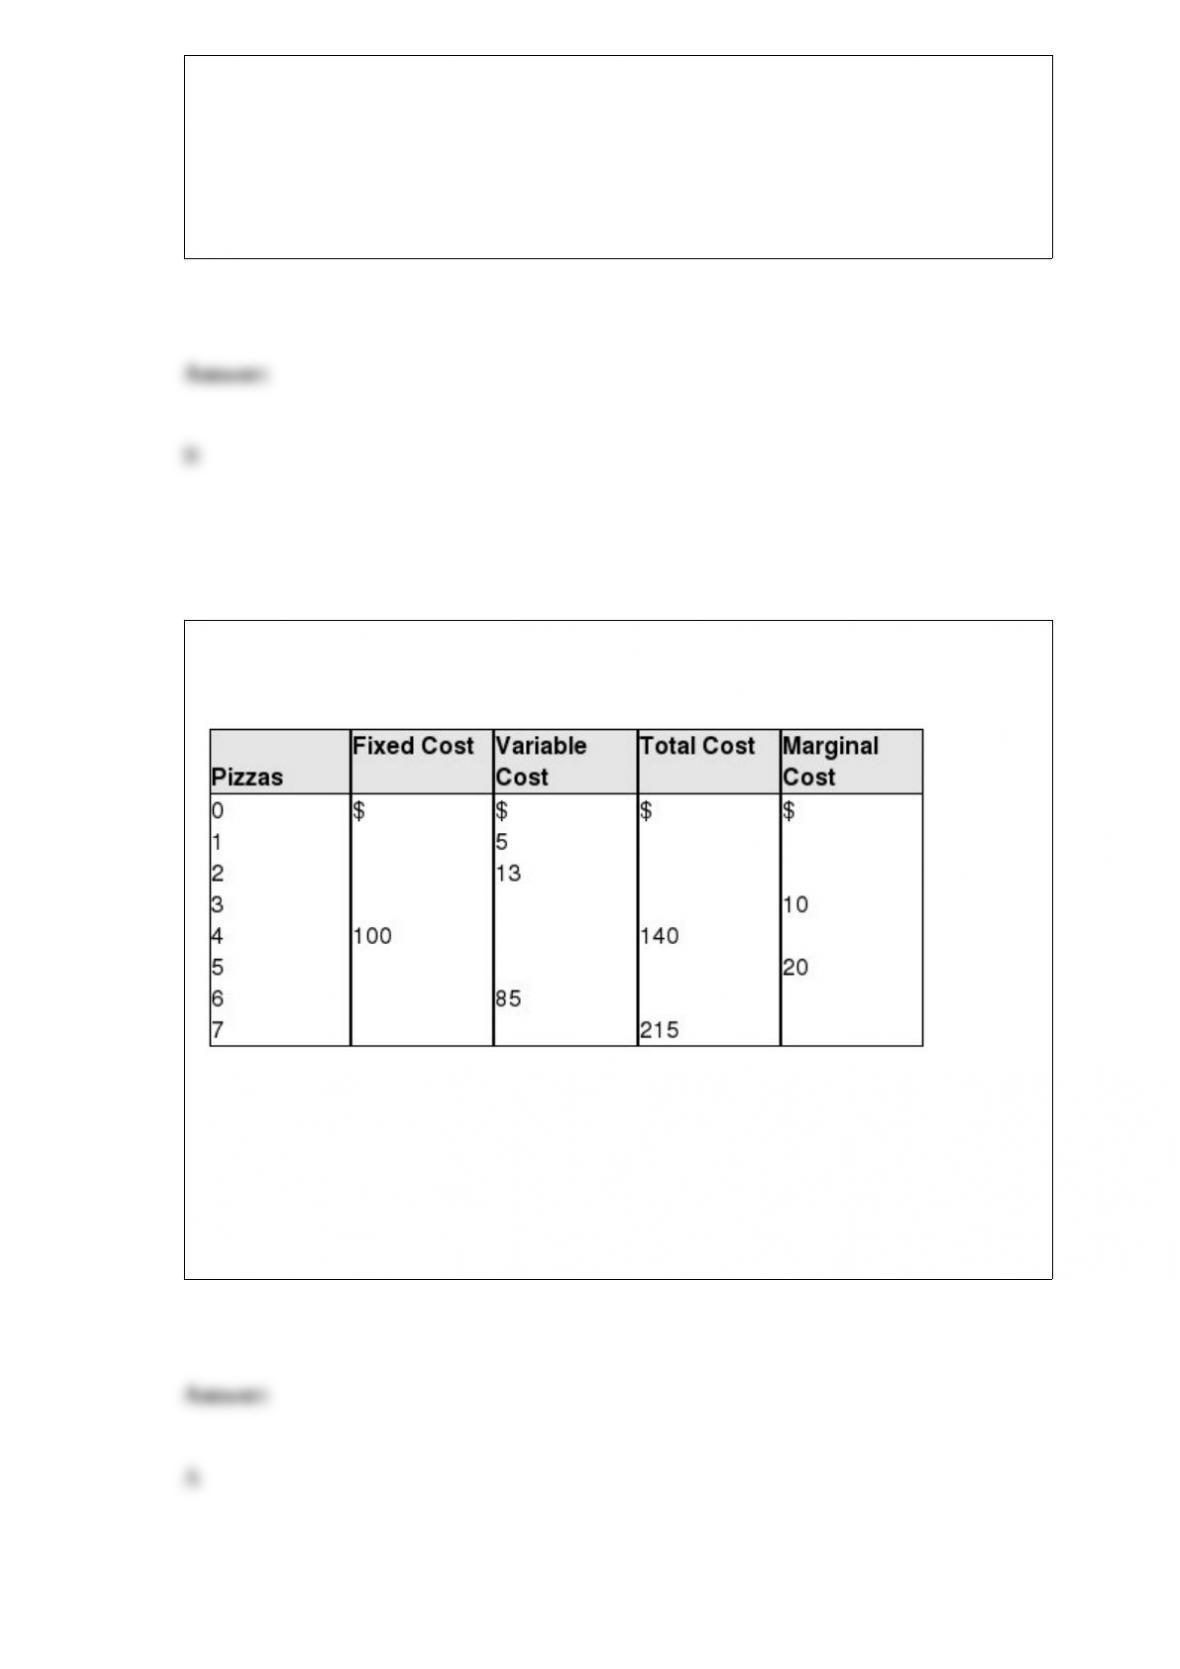
Exhibit 7-8 Costs schedules for producing pizza
By filling in the blanks in Exhibit 7-8, the average variable cost of producing 4 pizzas is
shown to be equal to:
a. $10.
b. $15.
c. $20.
d. $40.
e. $85.