The property of society getting the most it can from its scarce resources is called
a. equity.
b. efficiency.
c. equality.
d. efficacy.
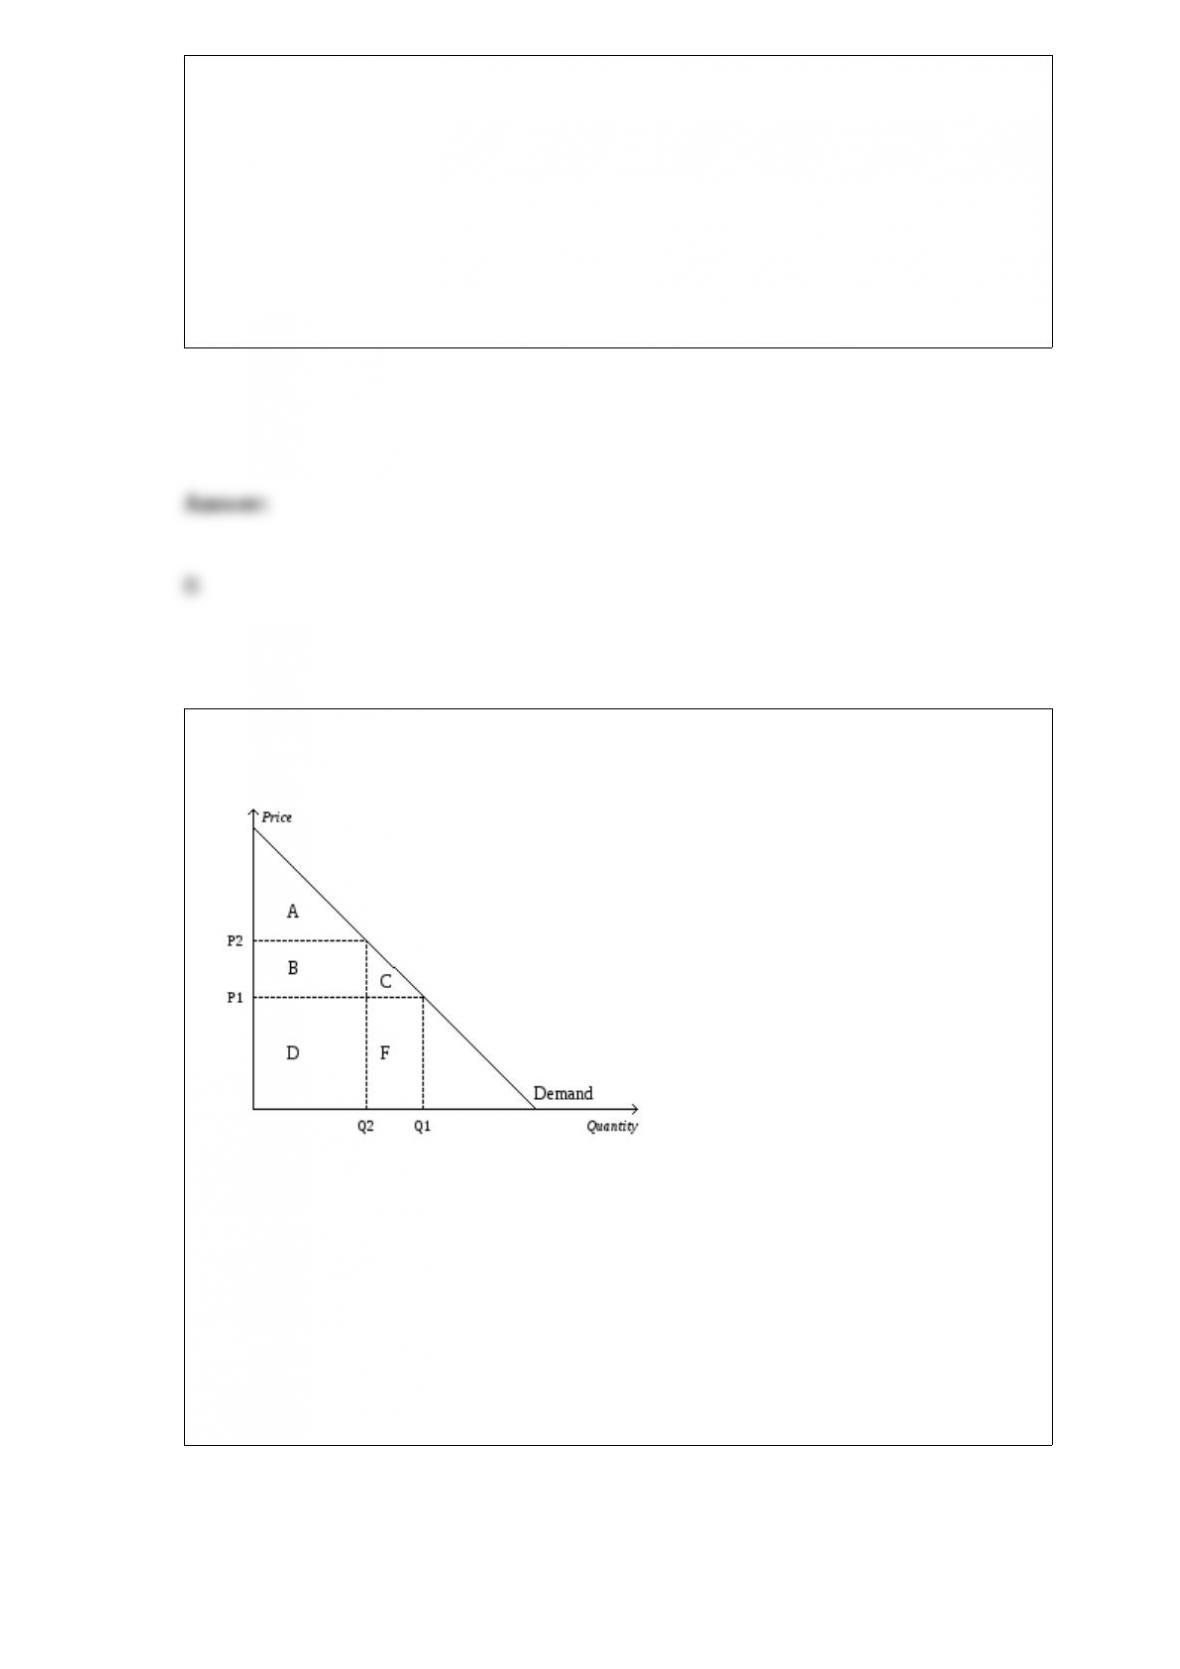
Figure 7-2
Refer to Figure 7-2. When the price rises from P1 to P2, consumer surplus
a. increases by an amount equal to A.
b. decreases by an amount equal to B+C.
c. increases by an amount equal to B+C.
d. decreases by an amount equal to C.

Under the assumptions of the Fisher effect and monetary neutrality, if the money supply
growth rate rises, then
a. both the nominal and the real interest rate rise.
b. neither the nominal nor the real interest rate rise.
c. the nominal interest rate rises, but the real interest rate does not.
d. the real interest rate rises, but the nominal interest rate does not.
Which of the following is correct?
a. In the U.S. it is only among the least skilled and least experienced members of the
labor force that minimum-wage laws cause unemployment. Unions may keep wages
above their equilibrium level.
b. In the U.S. it is only among the least skilled and least experienced members of the
labor force that minimum-wage laws cause unemployment. Unions cannot keep wages
above their equilibrium level.
c. In the U.S. minimum-wage laws cause unemployment even for people with high
skills and much experience. Unions may keep wages above their equilibrium level.
d. In the U.S. minimum-wage laws cause unemployment even for people with high
skills and much experience. Unions cannot keep wages above their equilibrium level.
According to the misperceptions theory of aggregate supply, if a firm thought that
inflation was going to be 5 percent and actual inflation was 6 percent, then the firm
would believe that the relative price of what it produce had
a. increased, so it would increase production.
b. increased, so it would decrease production.
c. decreased, so it would increase production.
d. decreased, so it would decrease production.
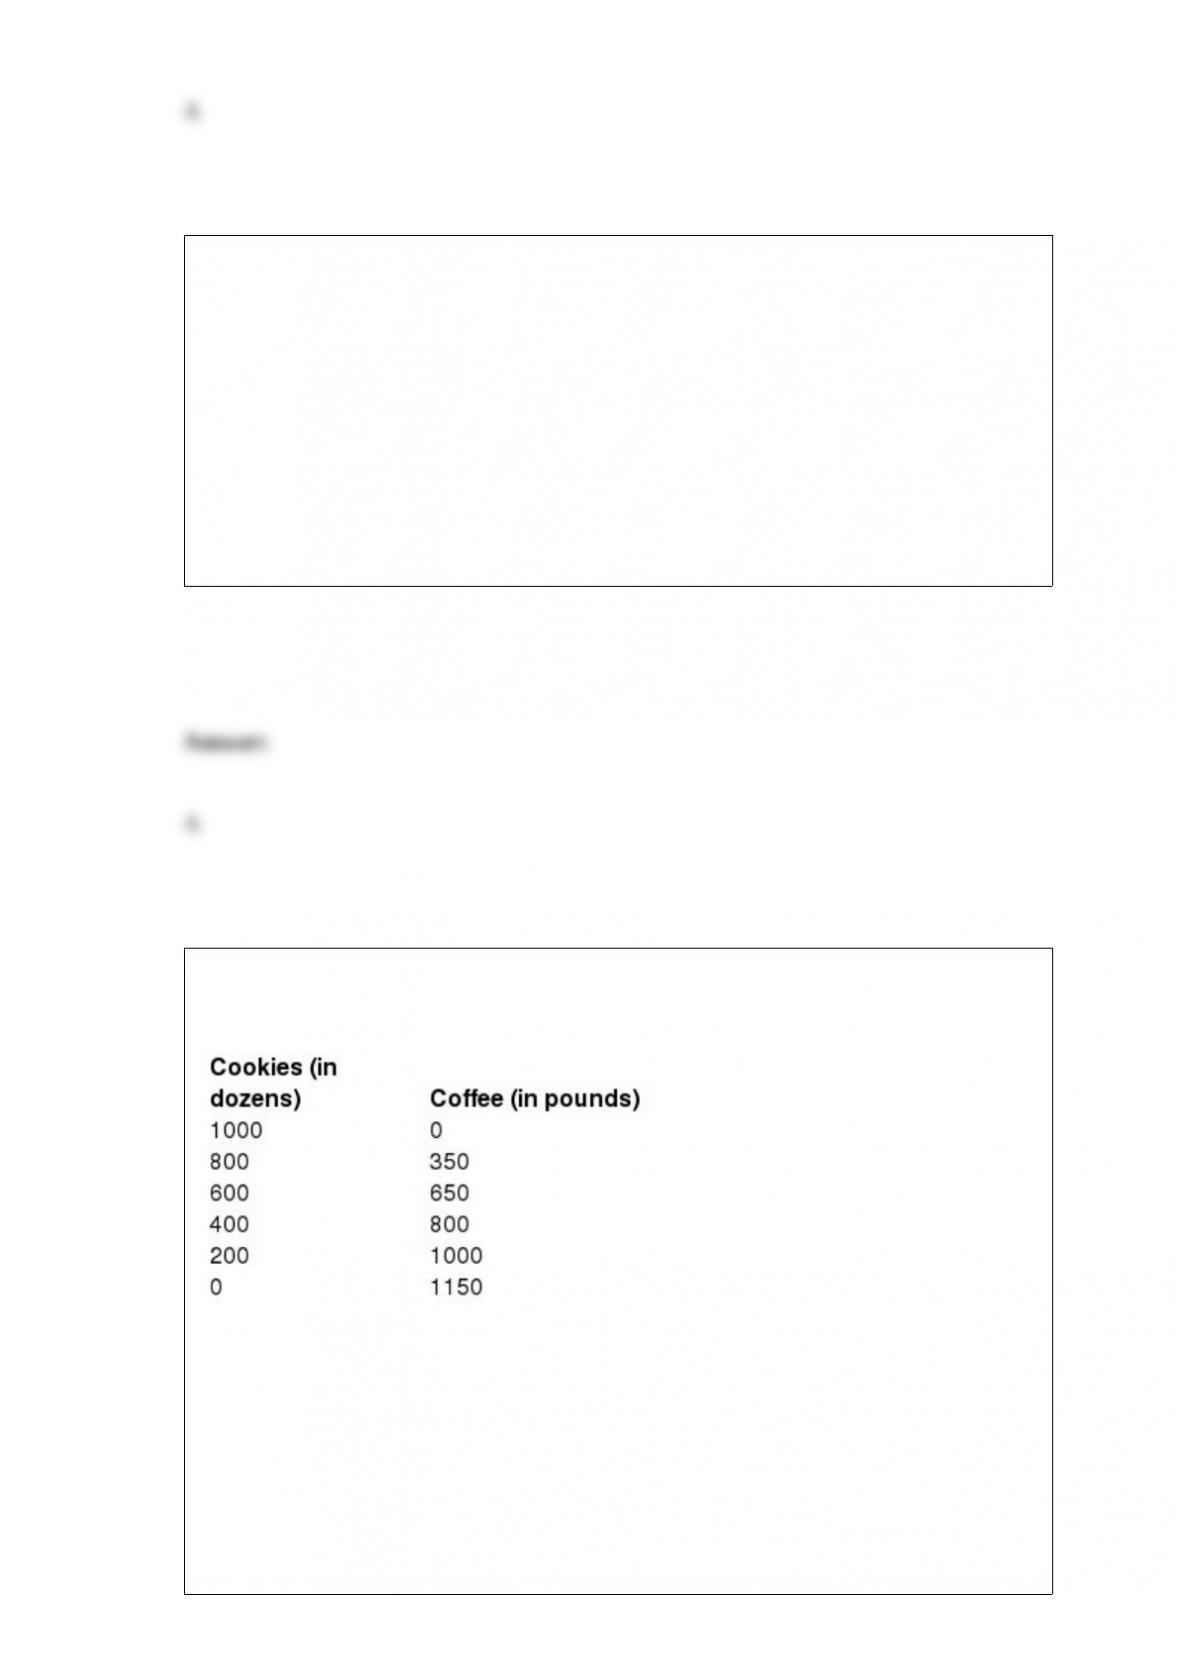
Table 2-5
Refer to Table 2-5. Table 2-5 shows one set of production possibilities. What is the
opportunity cost of increasing the production of cookies from 200 dozen to 400 dozen?
a. 100 pounds of coffee
b. 200 pounds of coffee
c. 300 pounds of coffee

d. 400 pounds of coffee
The consumer price index and the GDP deflator are two alternative measures of the
overall price level. Which of the following statements about the two measures is
correct?
a. The CPI involves a base year; the GDP deflator does not involve a base year.
b. The CPI can be used to compute the inflation rate; the GDP deflator cannot be used
to compute the inflation rate.
c. The CPI reflects the prices of goods and services produced domestically; the GDP
deflator reflects the prices of all goods and services bought by consumers.
d. The CPI reflects a fixed basket of goods and services; the GDP deflator reflects
current production of goods and services.
If the nominal interest rate is 6 percent and the rate of inflation is 10 percent, then the
real interest rate is
a. -16 percent.
b. -4 percent.
c. 4 percent.
d. 16 percent.

Suppose Lauren, Leslie and Lydia all purchase bulletin boards for their rooms for $15
each. Lauren’s willingness to pay was $35, Leslie’s willingness to pay was $25, and
Lydia’s willingness to pay was $30. Total consumer surplus for these three would be
a. $15.
b. $30.
c. $45.
d. $90.
An MP3 player in Singapore costs 200 Singaporean dollars. In the U.S. it costs 100 US
dollars. Which of the following is correct?
a. if the nominal exchange rate is 2.0 Singaporean dollars per U.S. dollar, purchasing
power parity holds.
b. if the nominal exchange rate is 1 Singaporean dollars per U.S. dollar, purchasing
power parity holds.
c. if the nominal exchange rate is .50 Singaporean dollars per U.S. dollar, purchasing
power parity holds.
d. purchasing power parity does not hold at any of the above exchange rates.
You know that a candy bar cost five cents in 1962. You also know the CPI for 1962 and
the CPI for today. Which of the following would you use to compute the price of the
candy bar in today’s prices?
a. five cents (1962 CPI / today’s CPI)
b. five cents ((today’s CPI – 1962 CPI)/1962 CPI)
c. five cents (today’s CPI / 1962 CPI)
d. five cents today’s CPI – five cents 1962 CPI.
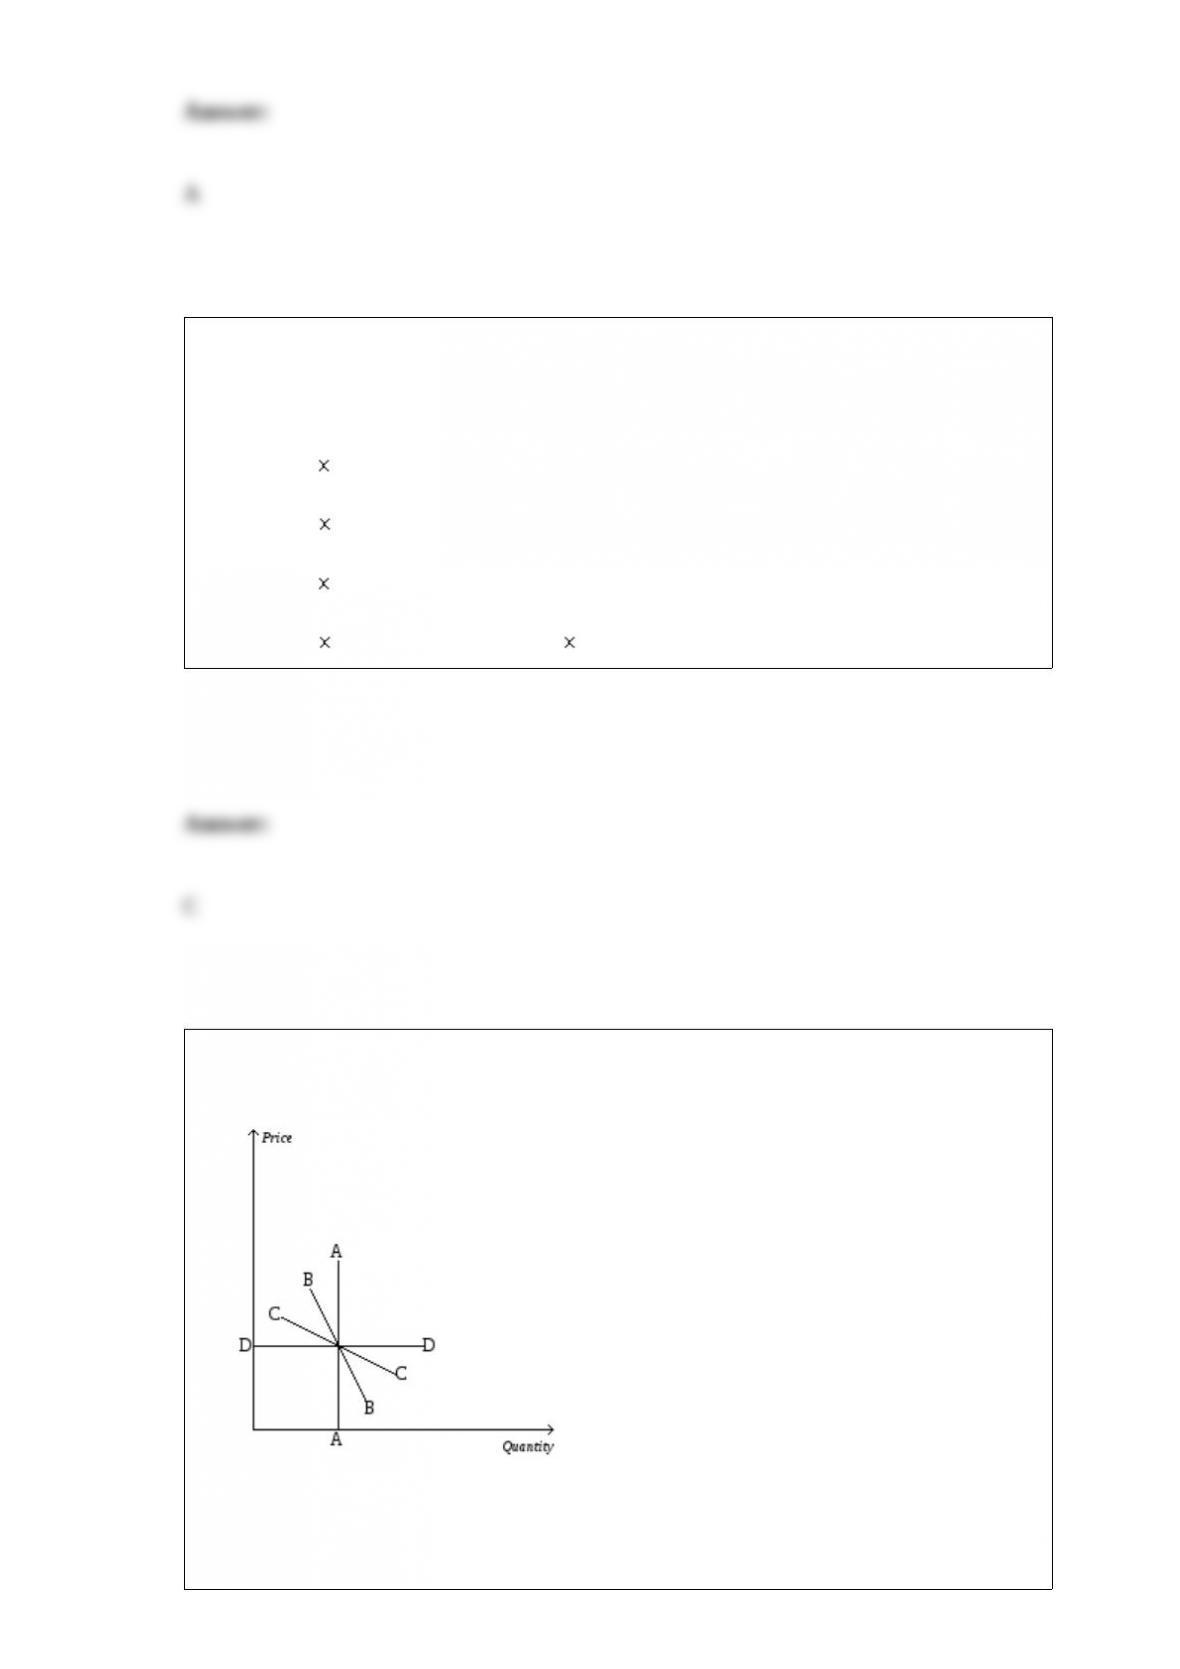
Figure 5-3
Refer to Figure 5-3. Which demand curve is perfectly elastic?
a. A

b. B
c. C
d. D
Suppose the cross-price elasticity of demand between hot dogs and mustard is -2.00.
This implies that a 20 percent increase in the price of hot dogs will cause the quantity of
mustard purchased to
a. fall by 200 percent.
b. fall by 40 percent.
c. rise by 200 percent.
d. rise by 40 percent.
Tara, the CEO of a corporation operating in a relatively poor country where wages are
low, decides to raise the wages of her workers even though she faces an excess supply
of labor. Her decision
a. might increase profits if it means that the wage is high enough for her workers to eat
a nutritious diet that makes them more productive.
b. will help eliminate the excess supply of labor.

c. may cause her workers to increase shirking.
d. All of the above are correct.
When the money market is drawn with the value of money on the vertical axis, if the
money supply rises
a. the price level and the value of money rise.
b. the price level rises and the value of money falls.
c. the price level falls and the value of money rises.
d. the price level and the value of money fall.
Suppose aggregate demand fell. In order to stabilize the economy, the government
might
a. increase the money supply.
b. decrease government expenditures.
c. increase taxes.
d. do nothing.

Credit cards
a. defer payments.
b. are a store of value.
c. have led to wider use of currency.
d. are part of the money supply.
In 1949, Sycamore, Illinois built a hospital for about $500,000. In 1987, the county
restored the courthouse for about $1.7 million. A price index for nonresidential
construction was 24 in 1949, 108 in 1987, and 126.5 in 2000. According to these
numbers, the hospital cost about
a. $2.1 million in 2000 dollars, which is less than the cost of the courthouse restoration
in 2000 dollars.
b. $2.1 million in 2000 dollars, which is more than the cost of the courthouse
restoration in 2000 dollars.
c. $2.6 million in 2000 dollars, which is less than the cost of the courthouse restoration
in 2000 dollars.
d. $2.6 million in 2000 dollars, which is more than the cost of the courthouse
restoration in 2000 dollars.
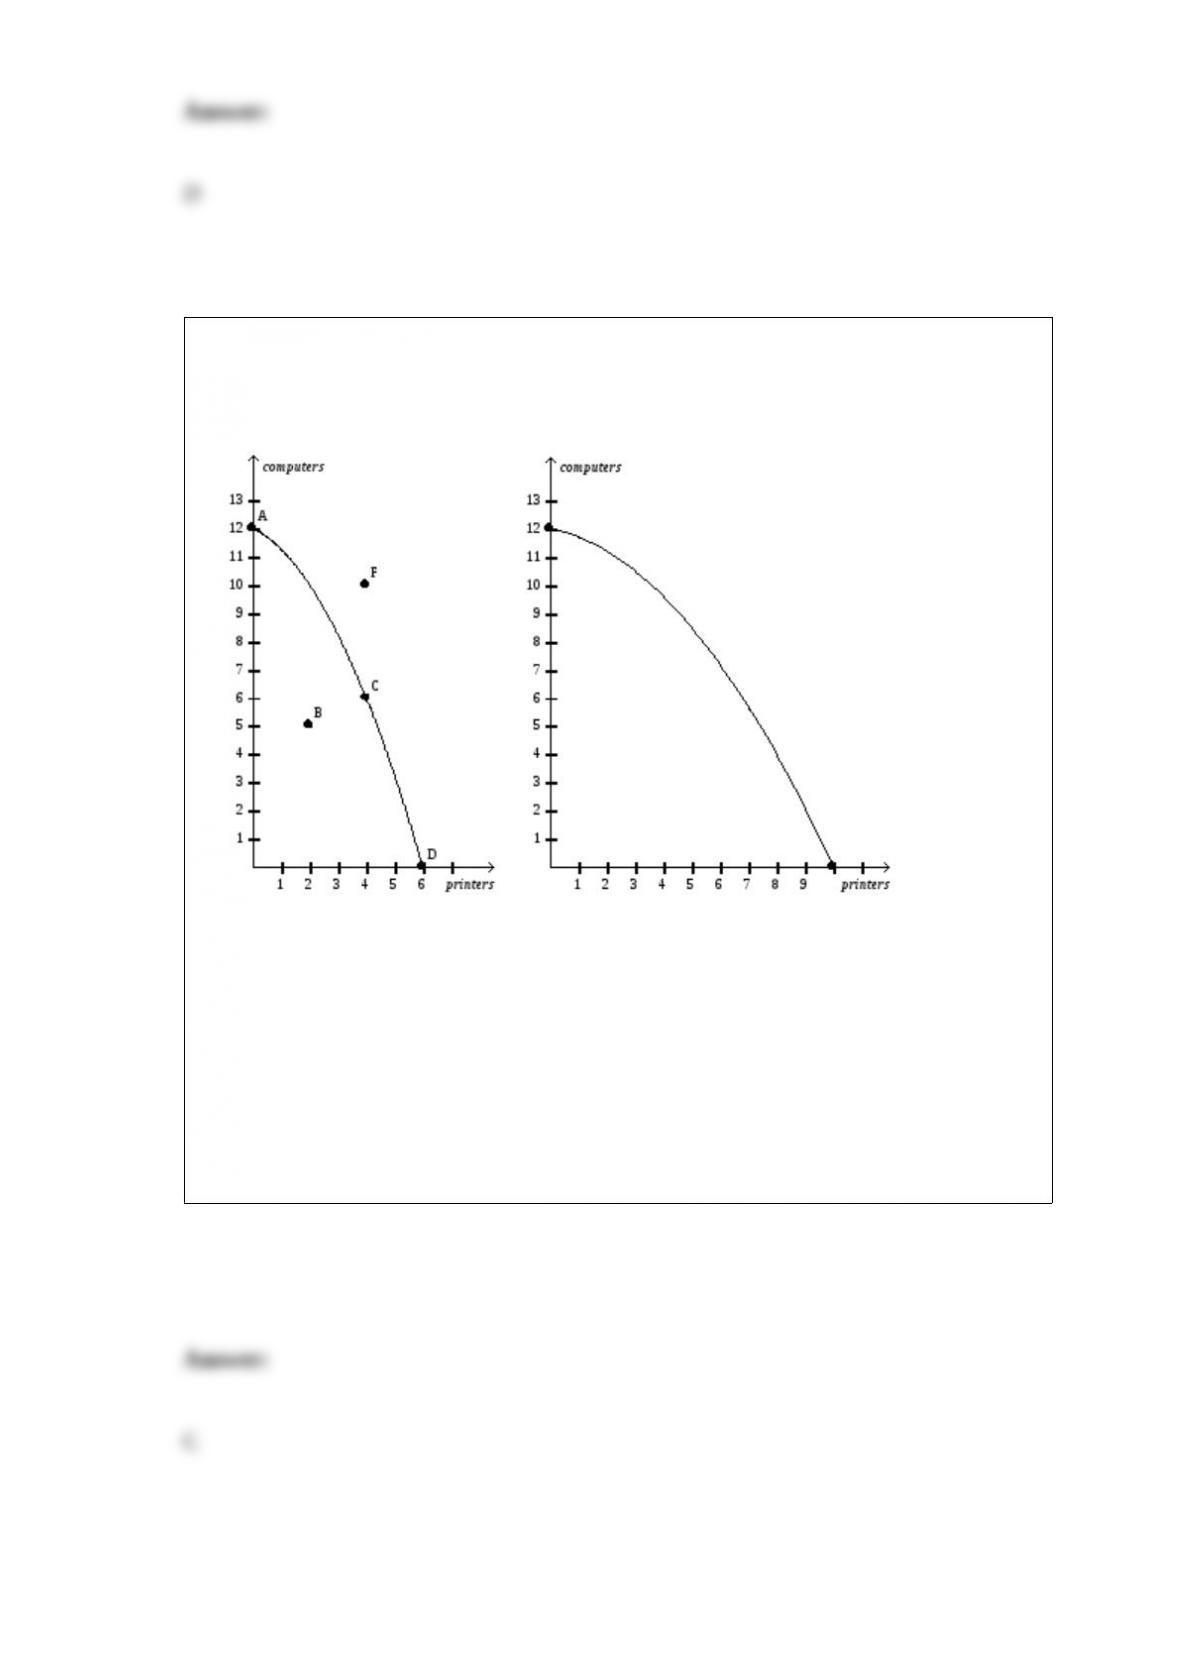
Figure 2-9
Panel (a) Panel (b)
Refer to Figure 2-9, Panel (a). Production at point B is
a. impossible and inefficient.
b. impossible but efficient.
c. possible but inefficient.
d. possible and efficient.
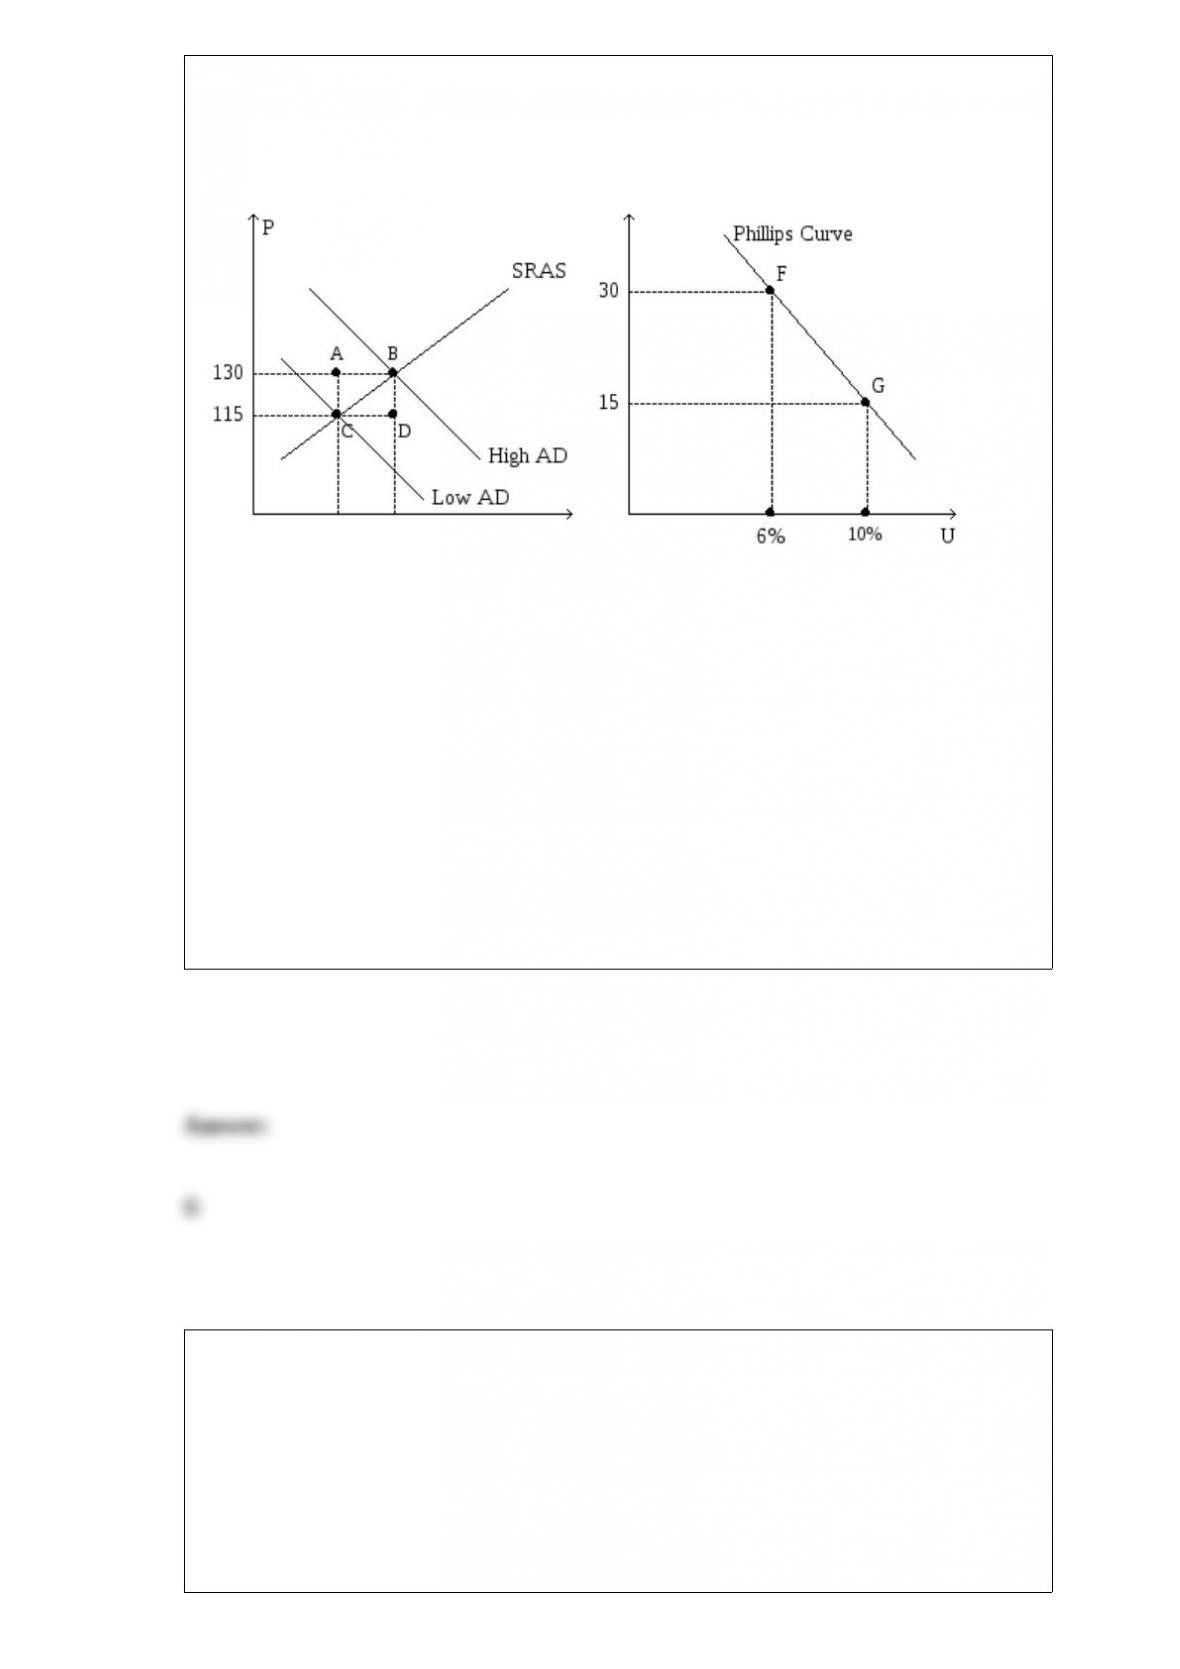
Figure 22-1. The left-hand graph shows a short-run aggregate-supply (SRAS) curve
and two aggregate-demand (AD) curves. On the right-hand diagram, U represents the
unemployment rate.
Refer to Figure 22-1. Suppose points F and G on the right-hand graph represent two
possible outcomes for an imaginary economy in the year 2012, and those two points
correspond to points B and C, respectively, on the left-hand graph. Also suppose we
know that the price index equaled 120 in 2011. Then the numbers 115 and 130 on the
vertical axis of the left-hand graph would have to be replaced by
a. 155 and 175, respectively.
b. 138 and 156, respectively.
c. 137.5 and 154.75, respectively.
d. 135 and 150, respectively.
Which of the following is correct?
a. Unemployment insurance raises structural unemployment because it reduces the job
search efforts of the unemployed.
b. Most economists are skeptical of the value of unemployment insurance primarily
because they believe that it results in a poorer match between workers and jobs.

c. Studies show that when the unemployed become ineligible for benefits, the
probability of their finding a job rises markedly.
d. All of the above are correct.
If the price index was 90 in year 1, 100 in year 2, and 95 in year 3, then the economy
experienced
a. 10 percent inflation between years 1 and 2 ,and 5 percent inflation between years 2
and 3.
b. 10 percent inflation between years 1 and 2, and 5 percent deflation between years 2
and 3.
c. 11.1 percent inflation between years 1 and 2, and 5 percent inflation between years 2
and 3.
d. 11.1 percent inflation between years 1 and 2, and 5 percent deflation between years 2
and 3.
If Germany chooses to engage in trade, it
a. will only benefit if it trades with countries that produce goods Germany cannot
produce.
b. cannot benefit if it trades with less developed countries.

c. should first attempt to produce the good itself.
d. can benefit by trading with any other country.
There are fewer farmers in the United States today than 200 years ago because of
a. improvements in farm technology.
b. increased government regulations in farming.
c. an elastic demand for food.
d. environmental programs designed to reduce soil erosion.
If the government levies a $1,000 tax per boat on sellers of boats, then the price paid by
buyers of boats would
a. increase by more than $1,000.
b. increase by exactly $1,000.
c. increase by less than $1,000.
d. decrease by an indeterminate amount.
Which of the following would increase the price level?
a. an increase in the money supply.
b. an increase in taxes.
c. a decrease in the expected price level.
d. a decrease in the natural rate of unemployment.
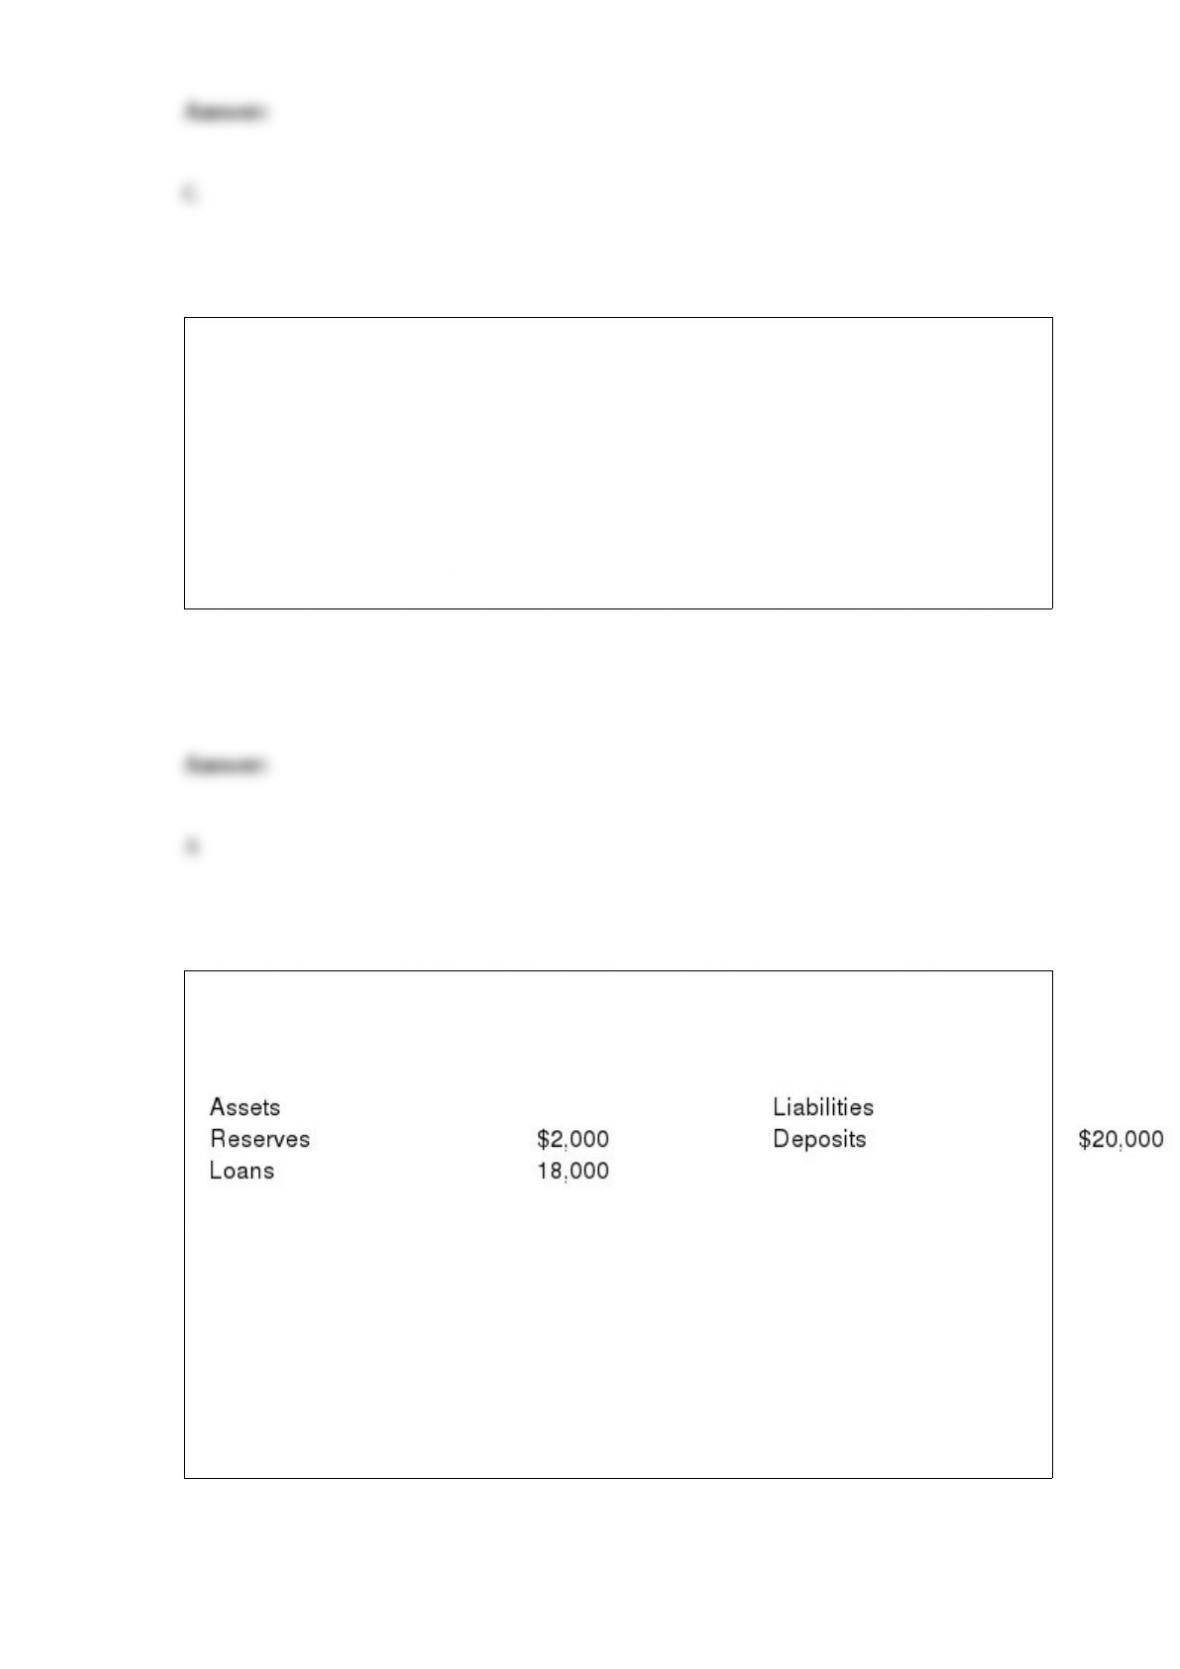
Table 16-5.
Bank of Pleasantville
Refer to Table 16-5. The Bank of Pleasantville’s reserve ratio is
a. 1 percent.
b. 5 percent.
c. 10 percent.
d. 20 percent.

An associate professor of physics gets a $200 a month raise. She figures that with her
new monthly salary she can buy more goods and services than she could buy last year.
a. Her real and nominal salary have risen.
b. Her real and nominal salary have fallen.
c. Her real salary has risen and her nominal salary has fallen.
d. Her real salary has fallen and her nominal salary has risen.
Jay and Joyce meet George, the banker, to work out the details of a mortgage. They all
expect that inflation will be 2 percent over the term of the loan, and they agree on a
nominal interest rate of 6 percent. As it turns out, the inflation rate is 5 percent over the
term of the loan.
a. What was the expected real interest rate?
b. What was the actual real interest rate?
c. Who benefited and who lost because of the unexpected inflation?

The income that households and noncorporate businesses receive is called
a. personal income.
b. net national product.
c. disposable personal income.
d. national income.
Janine would be willing to pay $50 to see Les Misérables, but she buys a ticket for only
$30. Janine values the performance at
a. $20.
b. $30.
c. $50.
d. $80.
Consider a good to which a per-unit tax applies. The greater the price elasticities of
demand and supply for the good, the
a. smaller the deadweight loss from the tax.
b. greater the deadweight loss from the tax.
c. more efficient is the tax.
d. more equitable is the distribution of the tax burden between buyers and sellers.
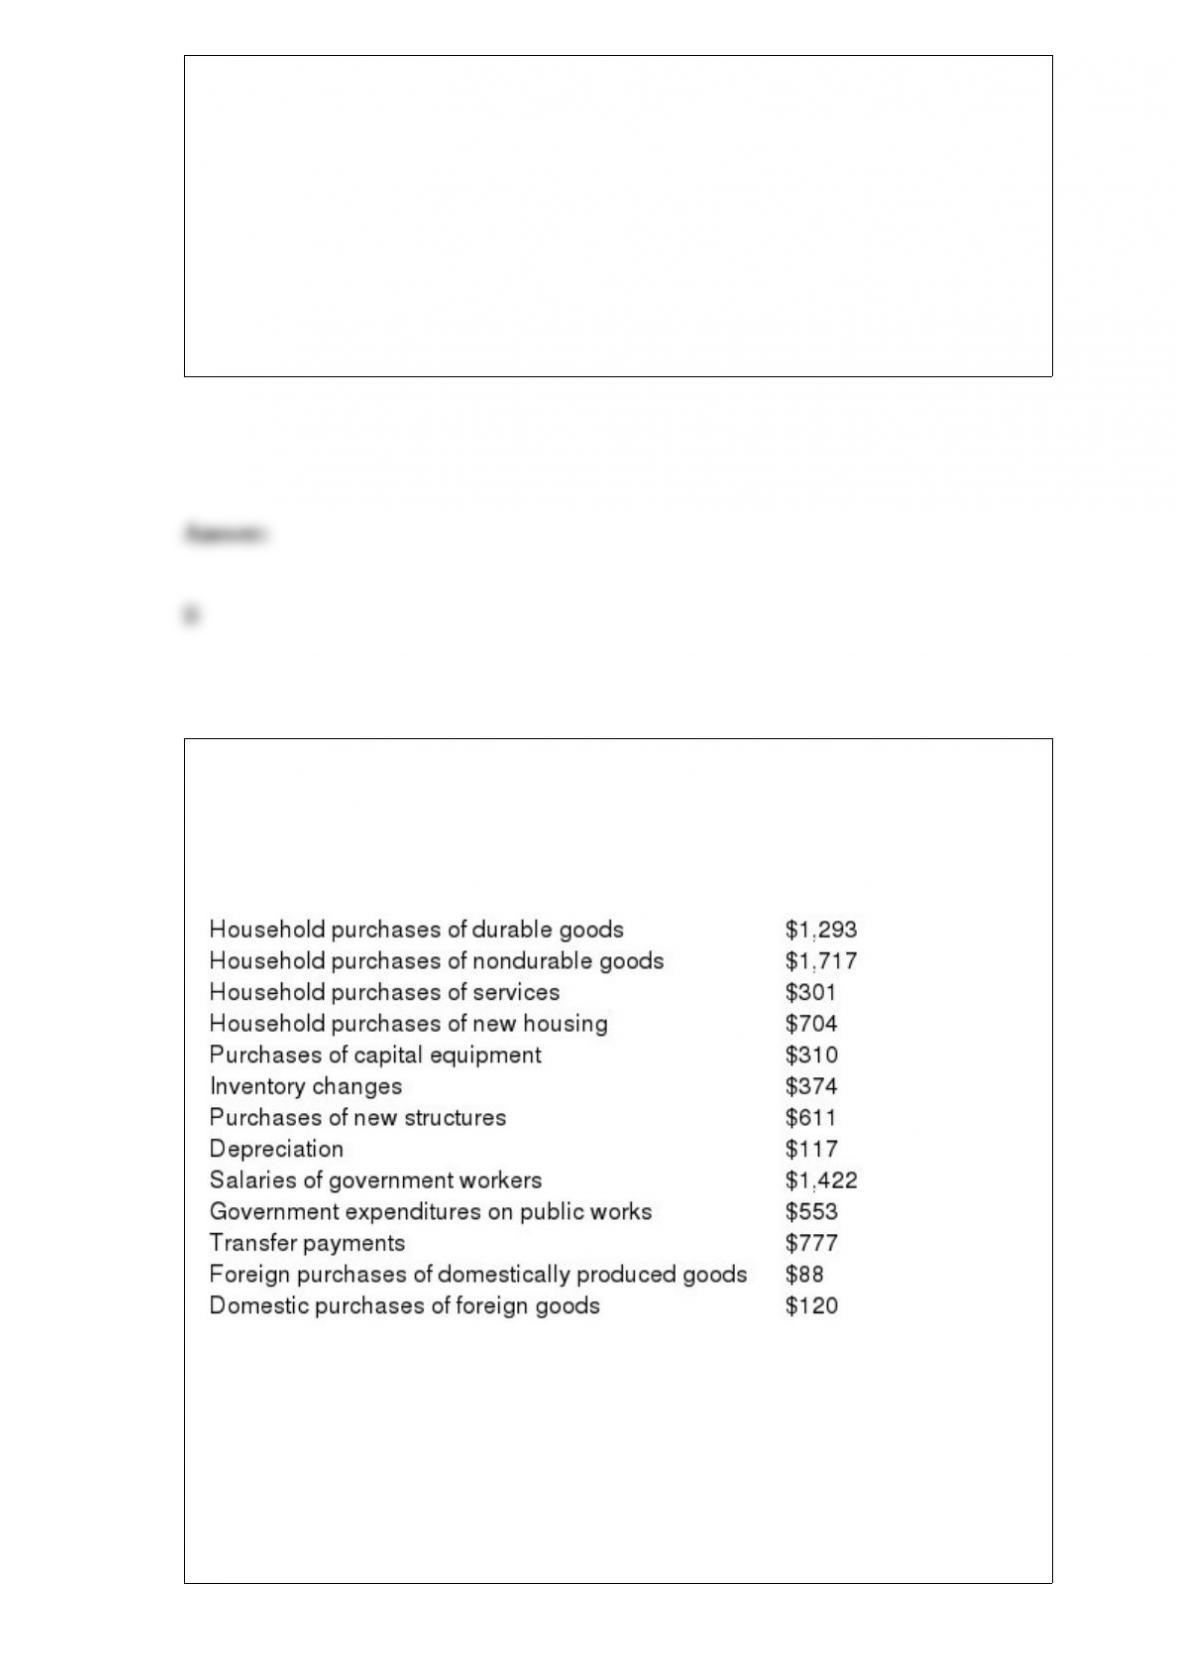
Table 10-1
The table below contains data for country A for the year 2010.
Refer to Table 10-1. What were country A’s government purchases in 2010?
a. $553
b. $1198
c. $1975

d. $2752
Paul Volcker, former chair of the Fed, implemented
a. contractionary policy which increased the popularity of the U.S. president who had
appointed him.
b. contractionary policy which decreased the popularity of the U.S. president who had
appointed him.
c. expansionary policy which increased the popularity of the U.S. president who had
appointed him.
d. expansionary policy which decreased the popularity of the U.S. president who had
appointed him.
If traveler’s checks were $500 higher and saving deposits were $1,000 higher, M1
would be
a. $500 higher and M2 would be $1,000 higher
b. $500 higher and M2 would be $1,500 higher
c. M2 and M1 would be $1,500 higher
d. None of the above are correct.