Figure: Production Possibility Frontier
(Figure: Production Possibility
Frontier) Look at the figure Production Possibilities Frontier. This production
possibility frontier is:
A) bowed out because of increasing opportunity costs.
B) bowed in because of increasing opportunity costs.
C) bowed in because of constant cost of cars and computers.
D) linear because of constant costs.
In Thailand, the land, labor, and capital in society are used to exploit all opportunities to
make everyone better off. This statement best represents this economic concept:
A) Markets move toward equilibrium.
B) Resources should be used as efficiently as possible to achieve society’s goals.
C) Markets usually lead to efficiency.
D) When markets don’t achieve efficiency, government intervention can improve
society’s welfare.
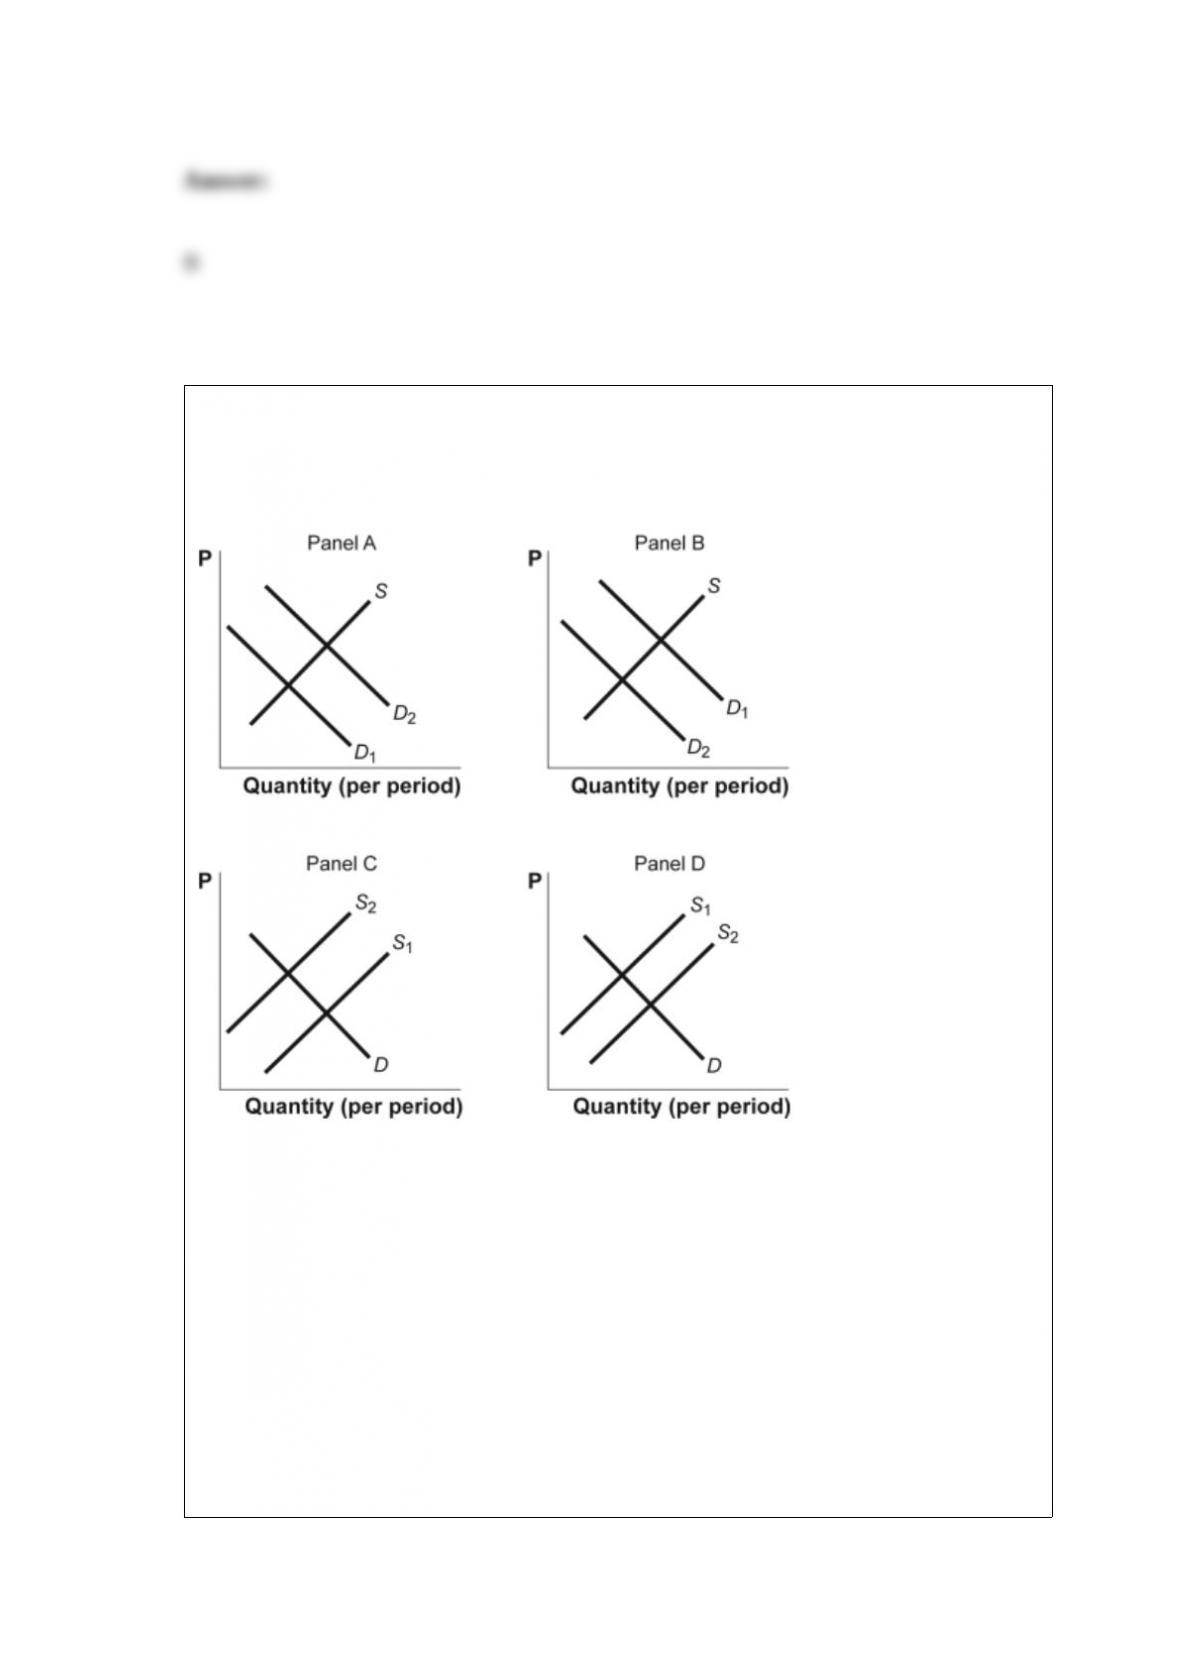
Figure: Shifts in Demand and Supply II
(Figure: Shifts in Demand and Supply II) Look at the figure Shifts in Demand and
Supply II. The figure shows how supply and demand might shift in response to specific
events. Suppose the birthrate decreases. Which panel BEST describes how this will
affect the market for diapers?
A) panel A
B) panel B
C) panel C
D) panel D
Utility is the:
A) difference between a firm’s total revenue and its total economic cost.
B) good not adequately provided by a free market and usually provided by the
government.
C) satisfaction consumers derive from their consumption of goods and services.
D) lowest price that buyers are willing to pay for a given quantity of a good.
Which of the following would make it difficult for oligopolists to collude?
A) few firms
B) few buyers
C) similar costs of production
D) a homogeneous product
Suppose the Chicago Cubs could rent out Wrigley Field (the field they play on) to local
youth leagues for $11,000 per month. The $11,000 per month is the _____ cost of
capital.
A) implicit
B) explicit
C) direct
D) total
Scarcity in economics means that:
A) we do not have sufficient resources to produce all of the goods and services we
want.
B) the wants of people are limited.
C) there must be poor people in rich countries.
D) shortages exist in nearly all markets.
Suppose the price of cereal rose by 25% and the quantity of milk sold decreased by
50%. We know that the:
A) cross-price elasticity between cereal and milk is “2.
B) cross-price elasticity between cereal and milk is “0.5.
C) price elasticity of demand for milk is 2.
D) cross-price elasticity of demand between cereal and milk is 2.
Figure: Profit Maximization in Monopolistic Competition
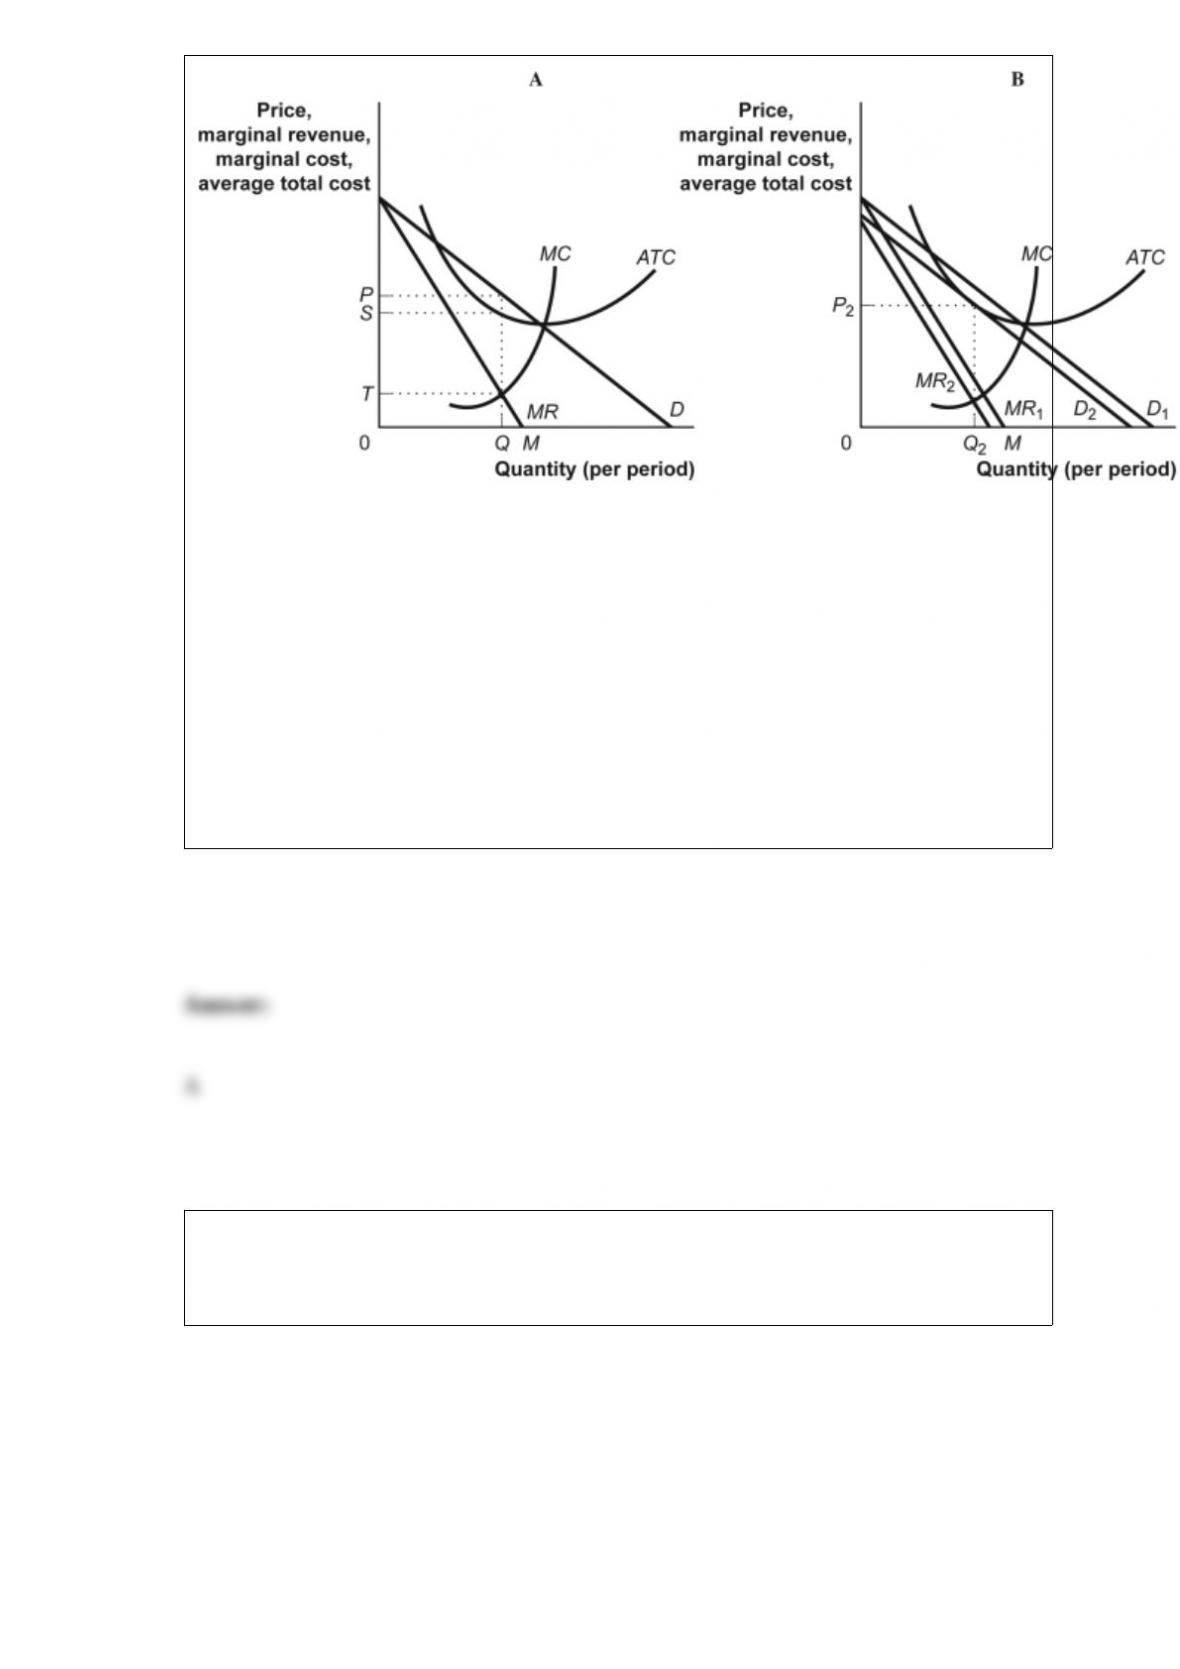
(Figure: Profit Maximization in Monopolistic Competition) Look at the figure Profit
Maximization in Monopolistic Competition. When the demand curve for a firm in
monopolistic competition shifts, the marginal revenue curve:
A) must also shift.
B) shifts in the opposite direction.
C) will stay the same.
D) will shift, but the profit-maximizing quantity will not change.
Figure: An Individual’s Marginal Benefit from a Public Good
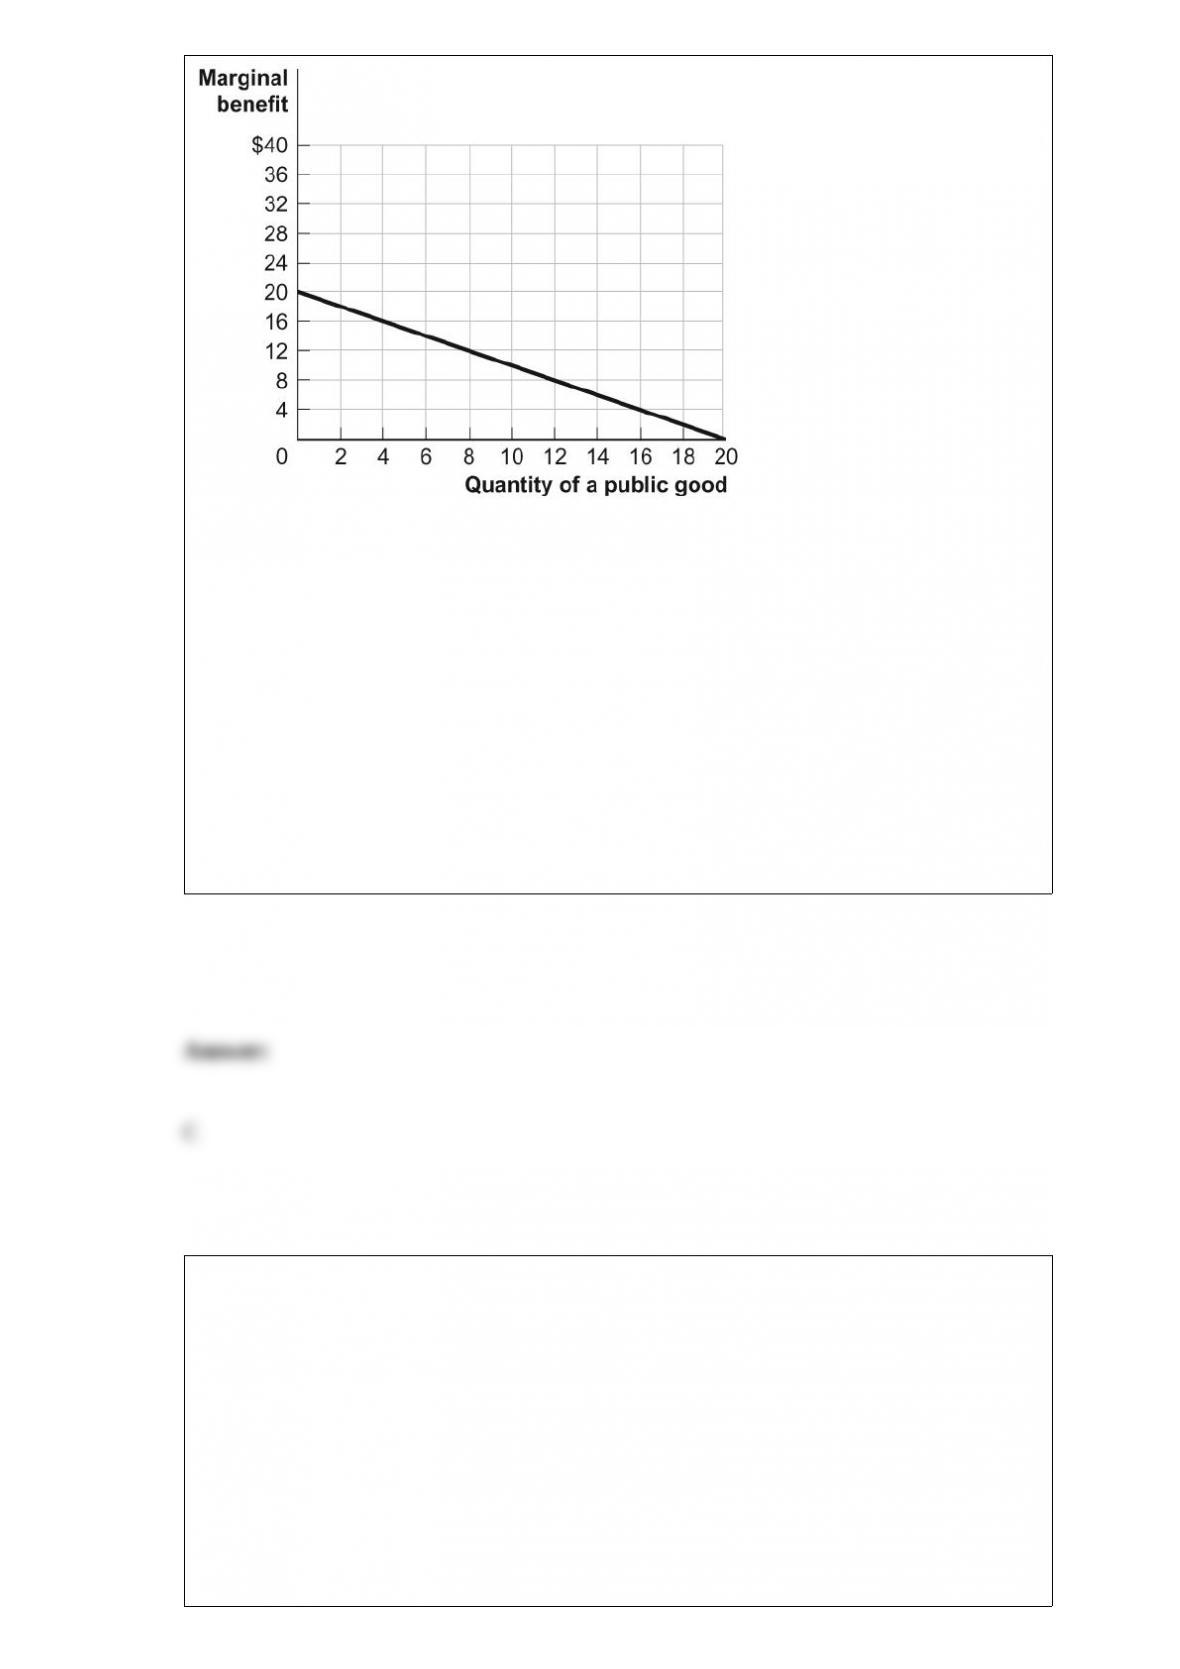
(Figure: An Individual’s Marginal Benefit from a Public Good) Look at the figure An
Individual’s Marginal Benefit from a Public Good. Assume that two individuals will
share consumption of a public good; each individual has the marginal benefit curve
shown in the figure. What is the total social benefit from four units of the public good?
A) $16
B) $60
C) $144
D) $200
The model of monopolistic competition characterizes the market for plumbing services.
This market is initially in long-run equilibrium, but then there is an increase in the
market demand for plumbing services. We expect that in the long run, the economic
profits of typical firms will be:
A) typical of those earned by monopoly firms.
B) negative.
C) zero.
D) positive but less than the level typically earned by monopoly firms.
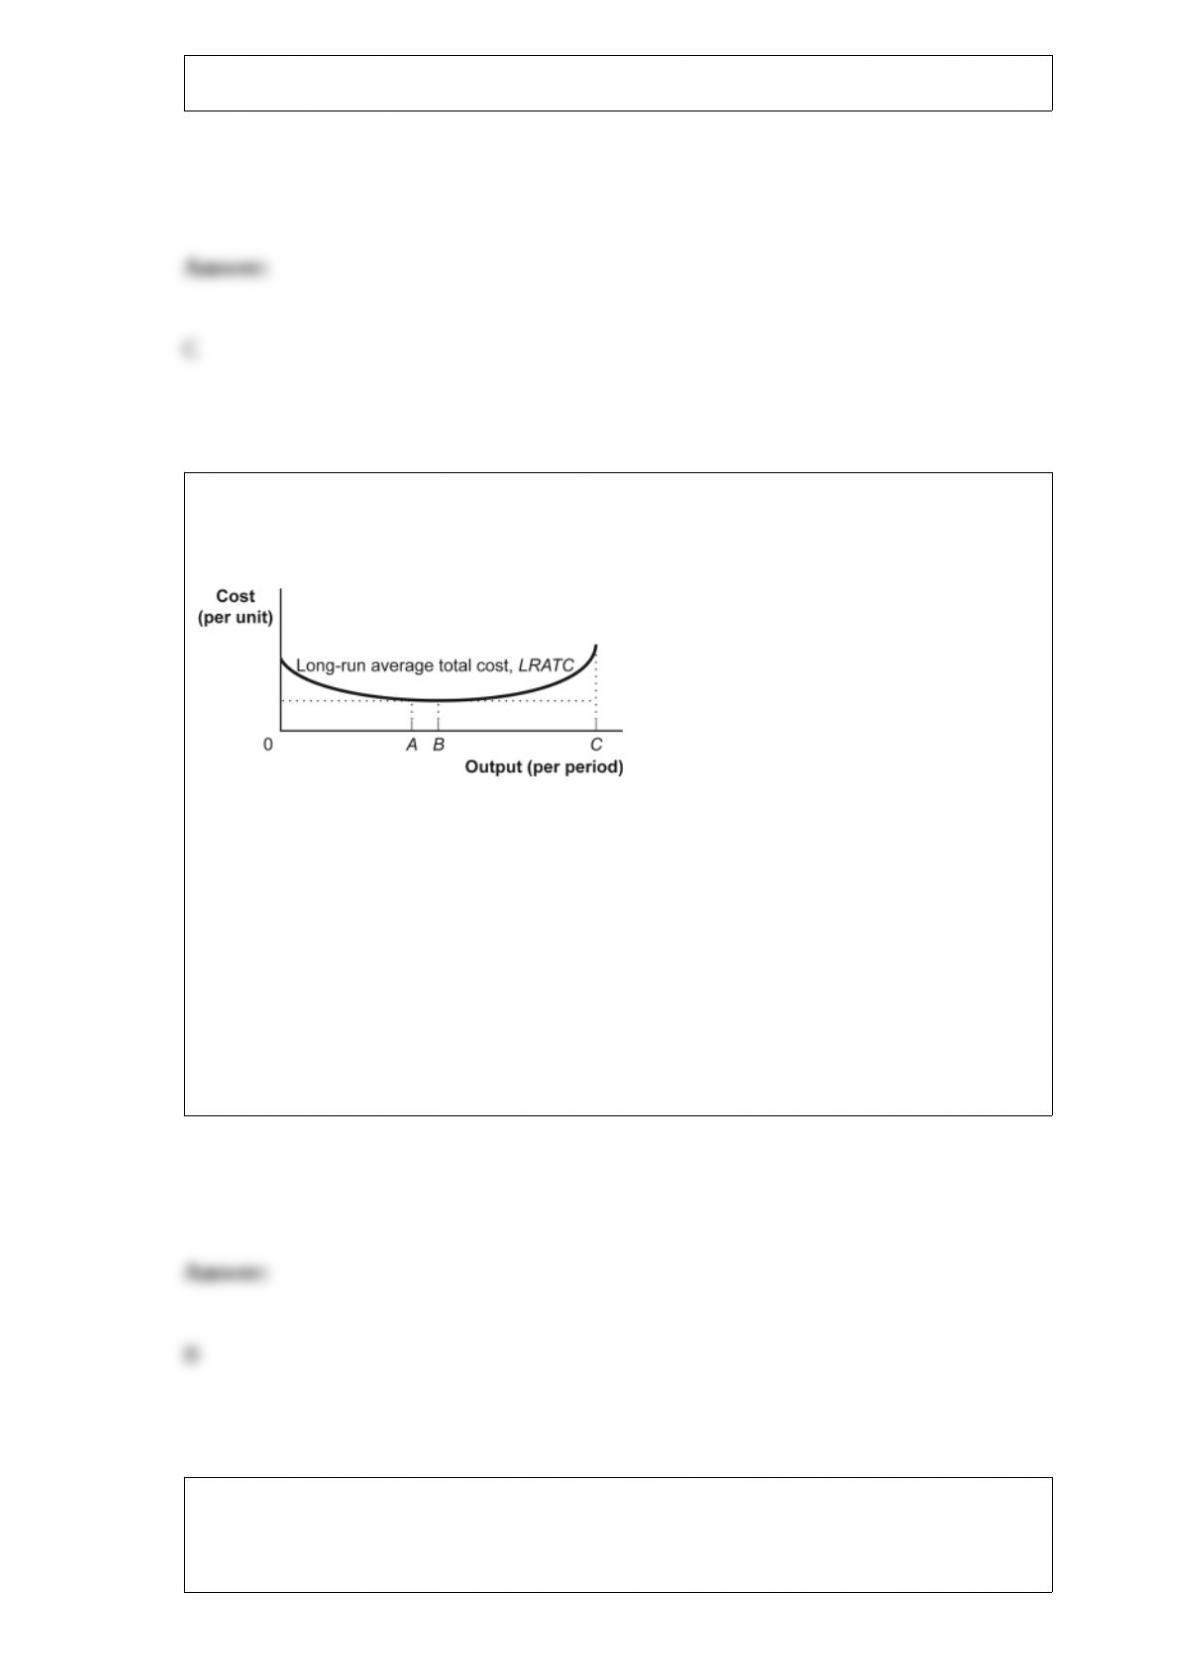
Figure: Long-Run Average Cost
(Figure: Long-Run Average Cost) Look at the figure Long-Run Average Cost. This firm
has _____ in the output region from B to C.
A) constant returns to scale
B) diseconomies of scale
C) economies of scale
D) falling marginal cost
Figure: Pollution and Efficiency
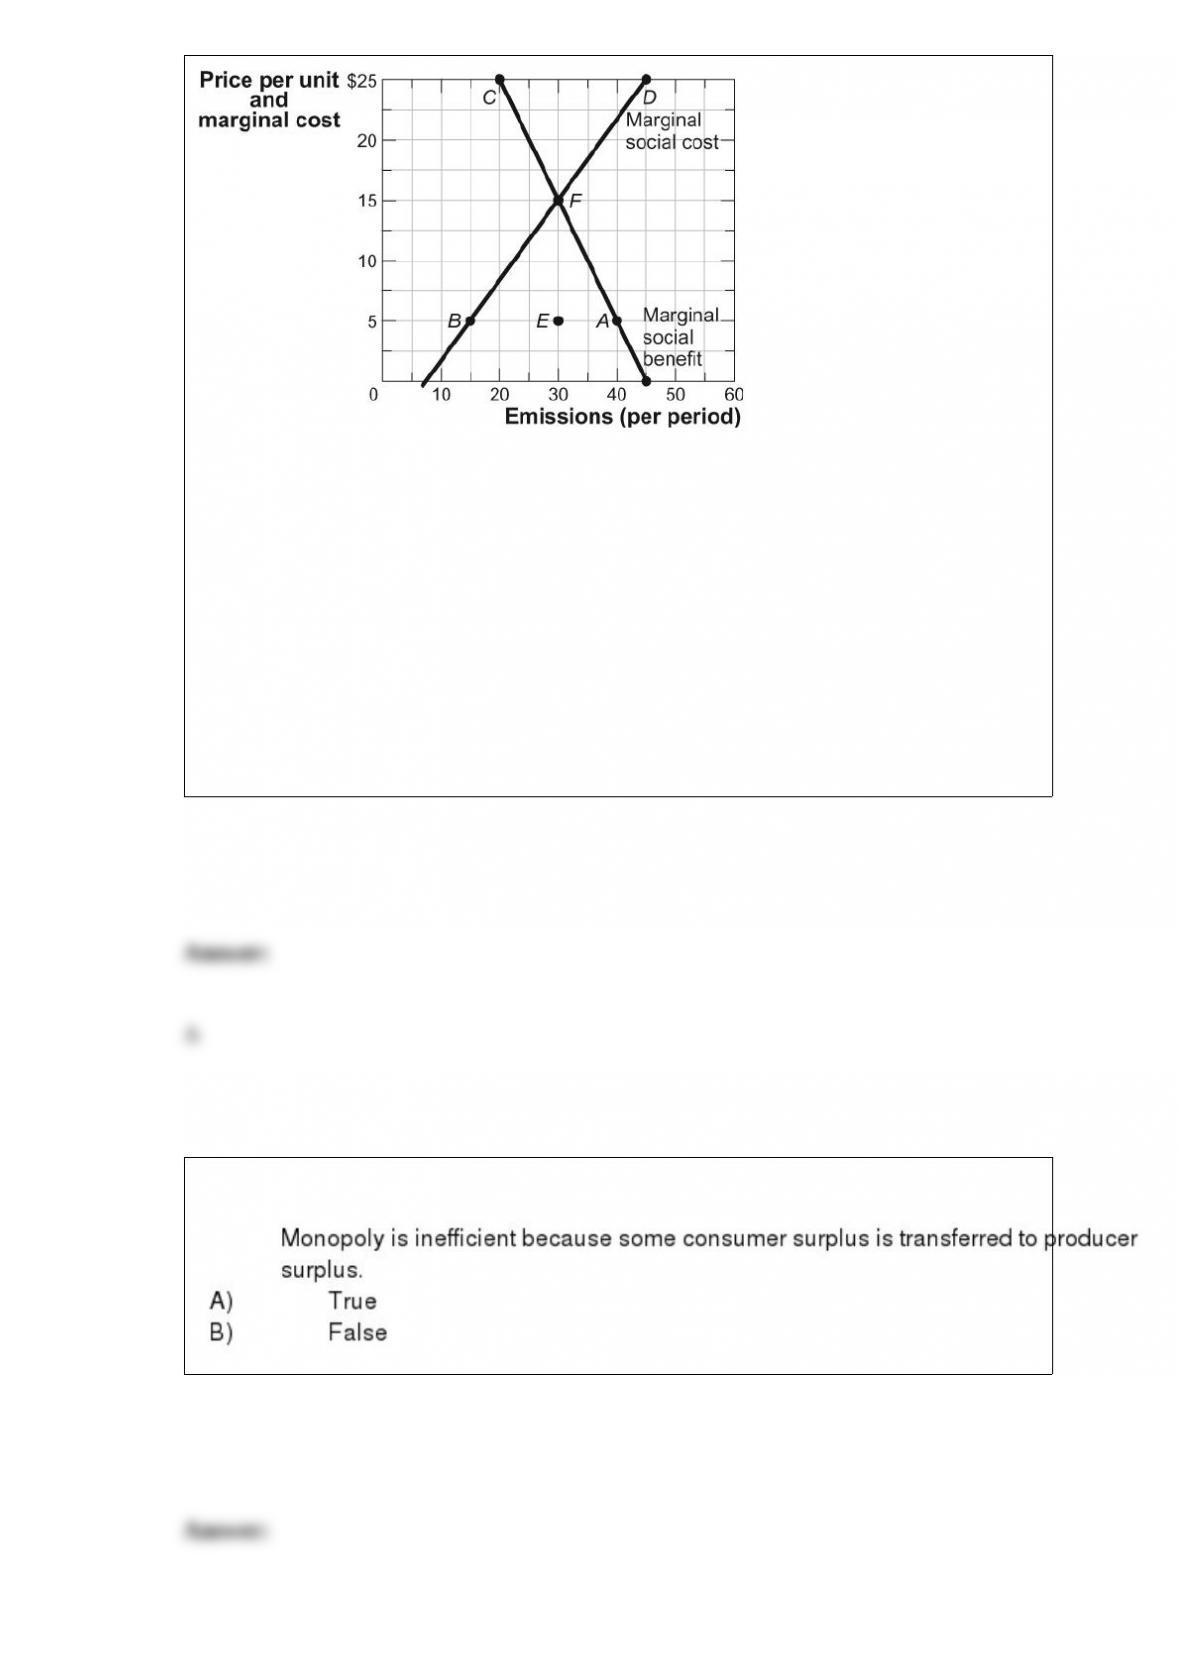
(Figure: Pollution and Efficiency) Look at the figure Pollution and Efficiency. If this
market, whose sulfur emission is a result of production, produced _____ units of
emissions, then _____.
A) 30; it would be efficient
B) 30; MSB > MSC
C) 45; total cost would equal total benefits
D) 45; MSC = 0
Defenders of advertising argue that it:
A) seeks to persuade rather than inform buyers.
B) provides education and information about products.
C) facilitates the concentration of monopoly power.
D) encourages artificial product differentiation.
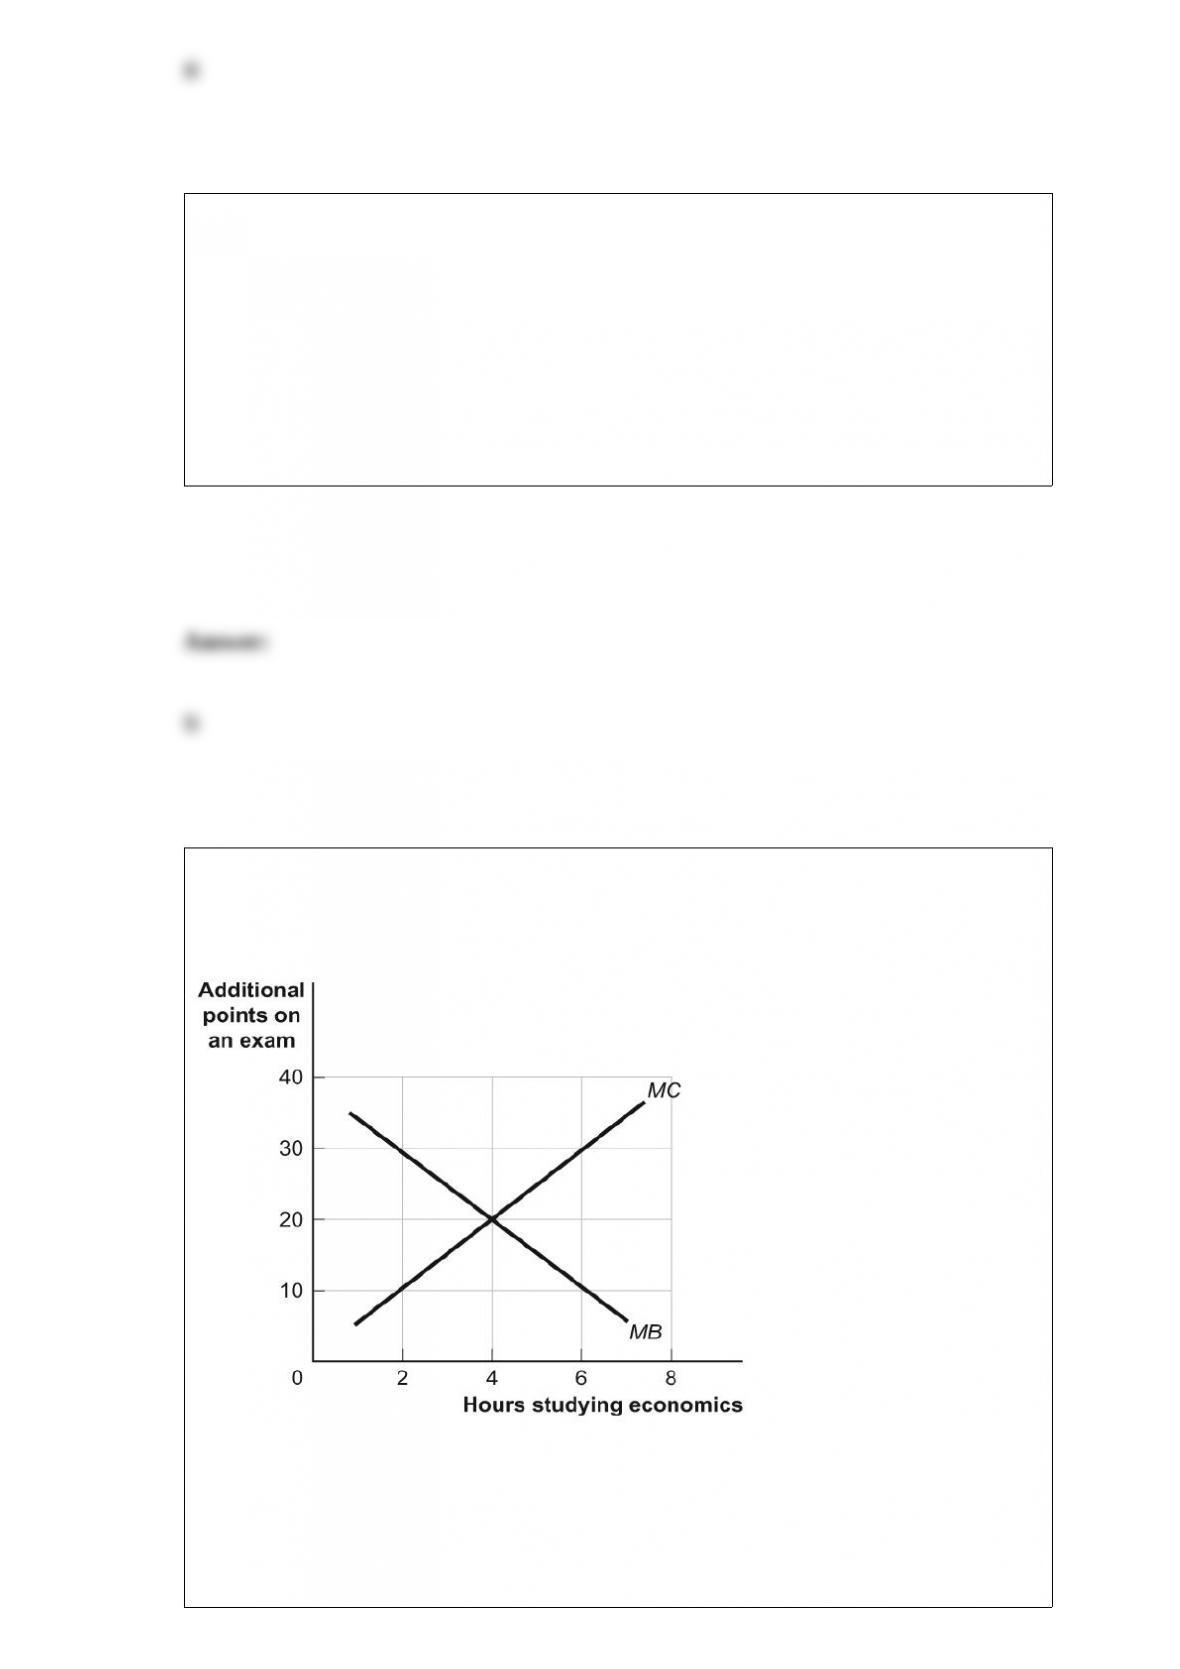
Figure: Marginal Benefits and Marginal Costs
(Figure: Marginal Benefits and Marginal Costs) Look at the figure Marginal Benefits
and Marginal Costs. More time spent studying economics adds points to economics
scores but (MB) subtracts points from accounting scores (MC). When Claudia studies
economics for four hours, the marginal benefit is _____ points; when she studies for six
hours, the marginal benefit is _____ points.

A) 20; 10
B) 30; 10
C) 20; 0
D) 20; 30
If an economy is producing a level of output that is on its production possibility
frontier, the economy has:
A) idle resources.
B) idle resources but is using resources efficiently.
C) no idle resources but is using resources inefficiently.
D) no idle resources and is using resources efficiently.
Suppose the labor market for plumbers is in equilibrium. Which of the following might
DECREASE the wage for plumbers?
A) An economic boom increases the demand for new homes.
B) The plumbers union establishes a rigorous certification test that is difficult for
aspiring plumbers to pass.
C) Unemployed manufacturing workers attend technical schools to learn the plumbing
trade.
D) A minimum wage is imposed in the market for plumbers.
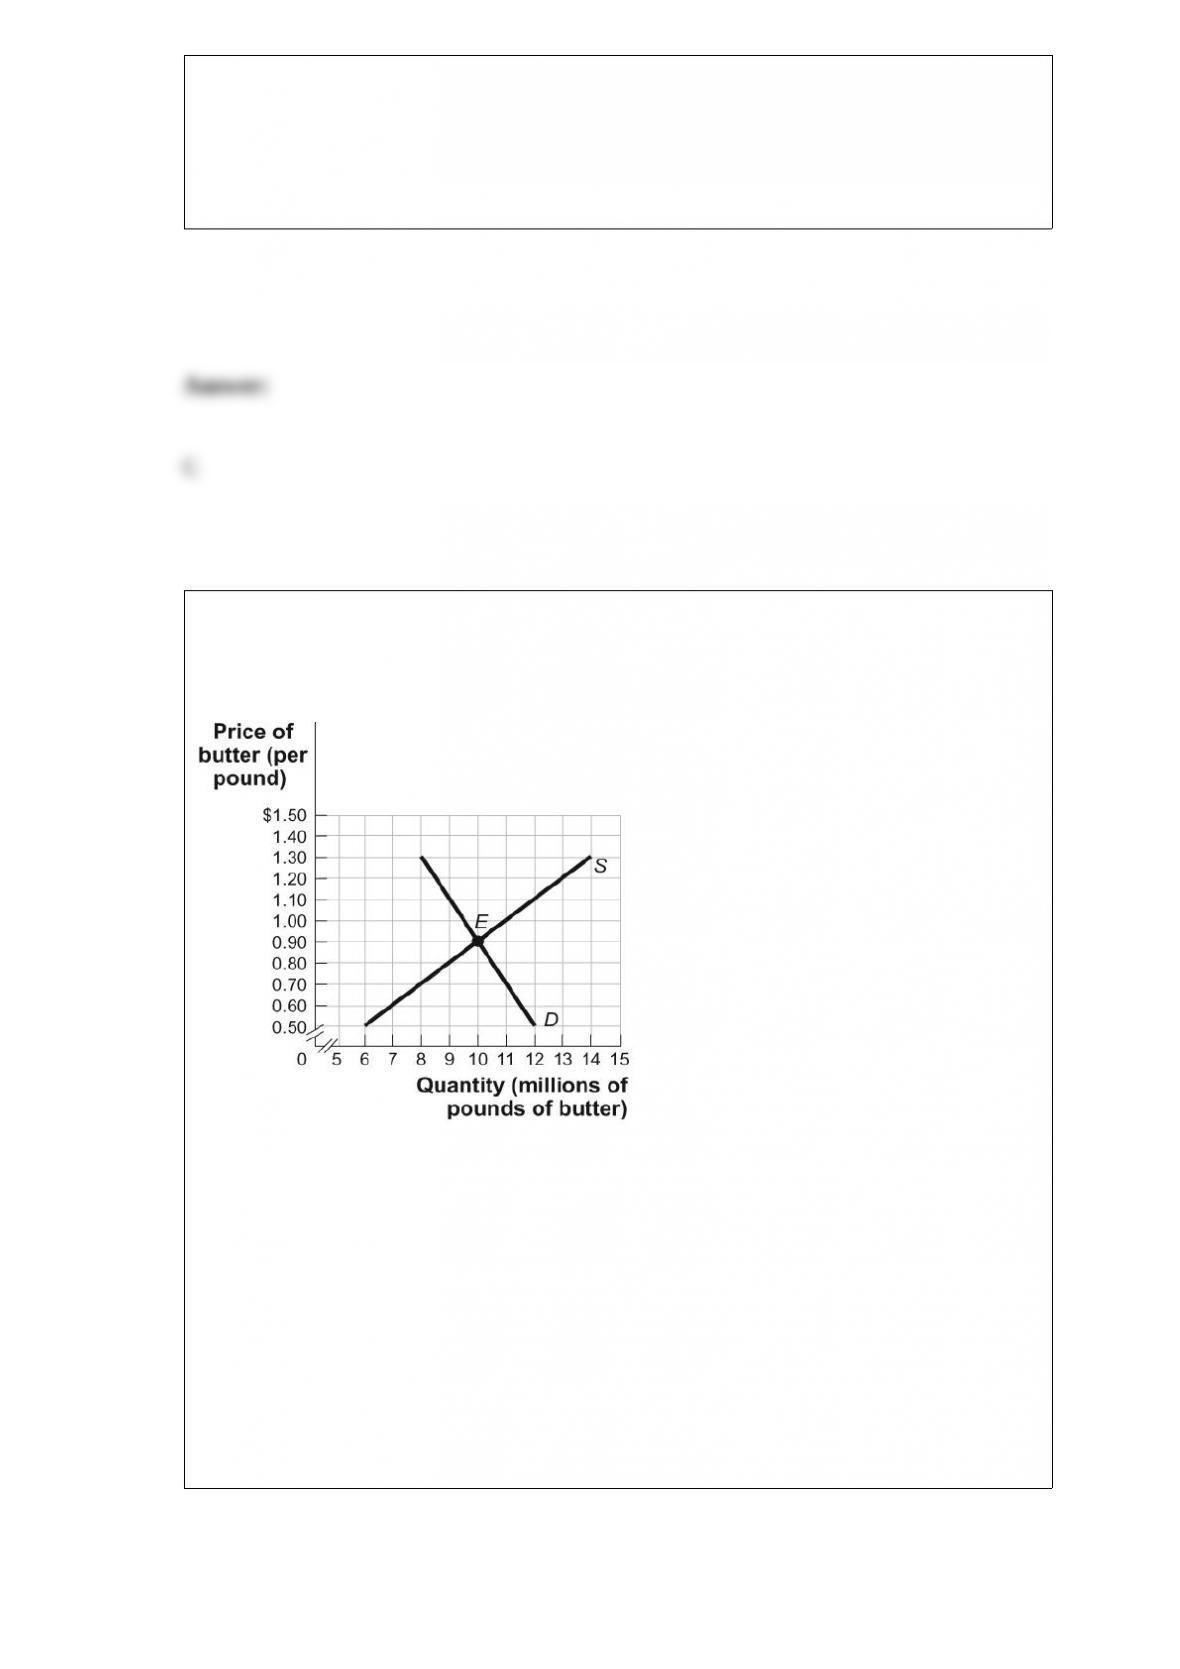
Figure: The Market for Butter
(Figure: The Market for Butter) Look at the figure The Market for Butter. If a
government price floor at $1.10 is imposed on this market, an inefficiency will result in
the form of a _____ of _____ million pounds of butter.
A) surplus; 4.5
B) shortage; 4.5
C) surplus; 3
D) shortage; 1.5

In terms of contribution to total U.S. income, the factor of production that receives the
SMALLEST share is:
A) capital.
B) labor.
C) natural resources.
D) entrepreneurship.
Which of the following is the best example of a good whose consumption is NOT
excludable?
A) clothing
B) ice cream
C) a taco
D) national defense
The best example of a public good is:
A) legal services.
B) national defense.
C) a municipal library.
D) cable television programming.
(Table: Utility for Terri and Mary) Look at the table Utility for Terri and Mary. Each has
an income of $300. _____ is more risk-averse because _____ has a _____ drop in total

utility if income were to fall by $100.
A) Mary; Mary; larger
B) Terri; Mary; larger
C) Mary; Terri; smaller
D) Terri; Terri; larger
Which of the following is a necessary condition for perfect competition?
A) A small number of firms control a large share of the total market.
B) Movement into and out of the market is limited.
C) Firms produce a standardized product.
D) Extensive advertising is used to promote the firm’s product.
Figure: Comparative Advantage Eastland and Westland produce only two goods,
boxes of peaches and boxes of oranges, and this figure shows each nation’s production
possibility frontier for the two goods.
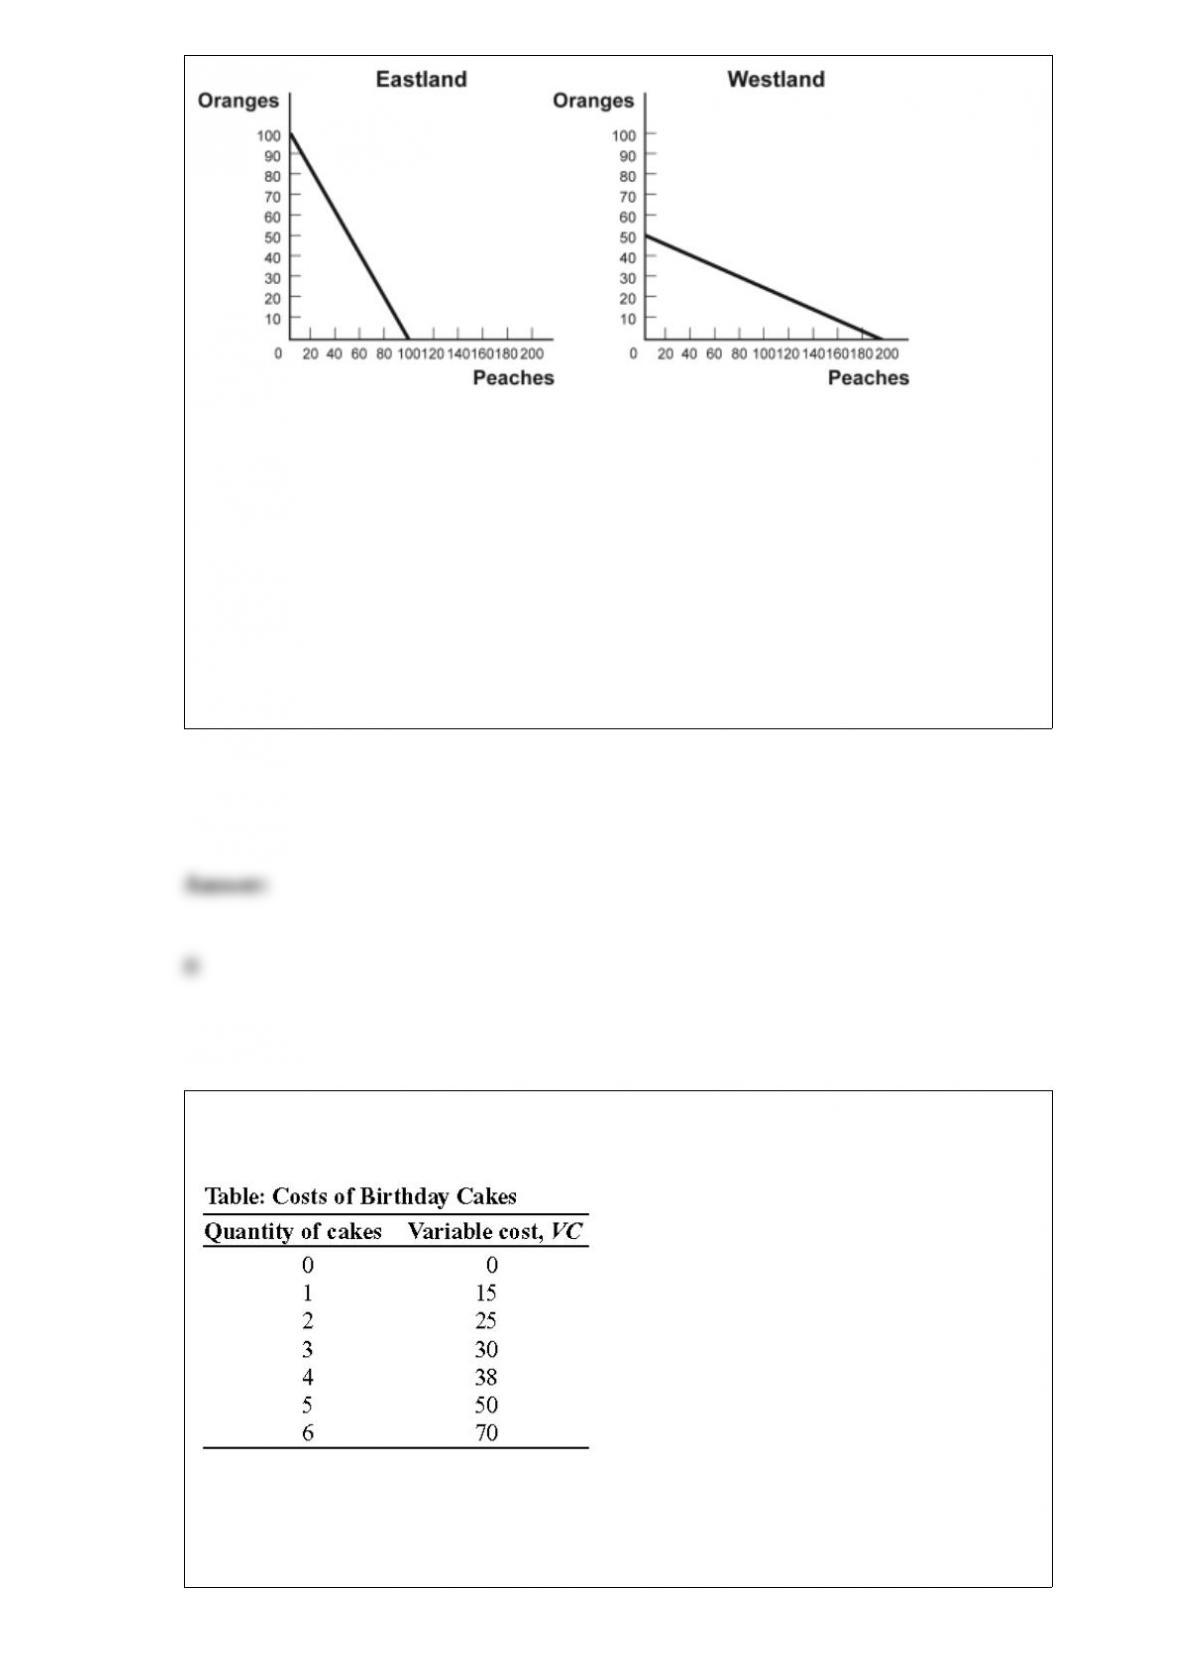
(Figure: Comparative Advantage) Look at the figure Comparative Advantage. Westland
has a comparative advantage in producing:
A) oranges only.
B) peaches only.
C) both oranges and peaches.
D) neither oranges nor peaches.
(Table: Costs of Birthday Cakes) Look at the table Costs of Birthday Cakes. Assume
that fixed costs are $10. What is the average variable cost of 5 cakes?
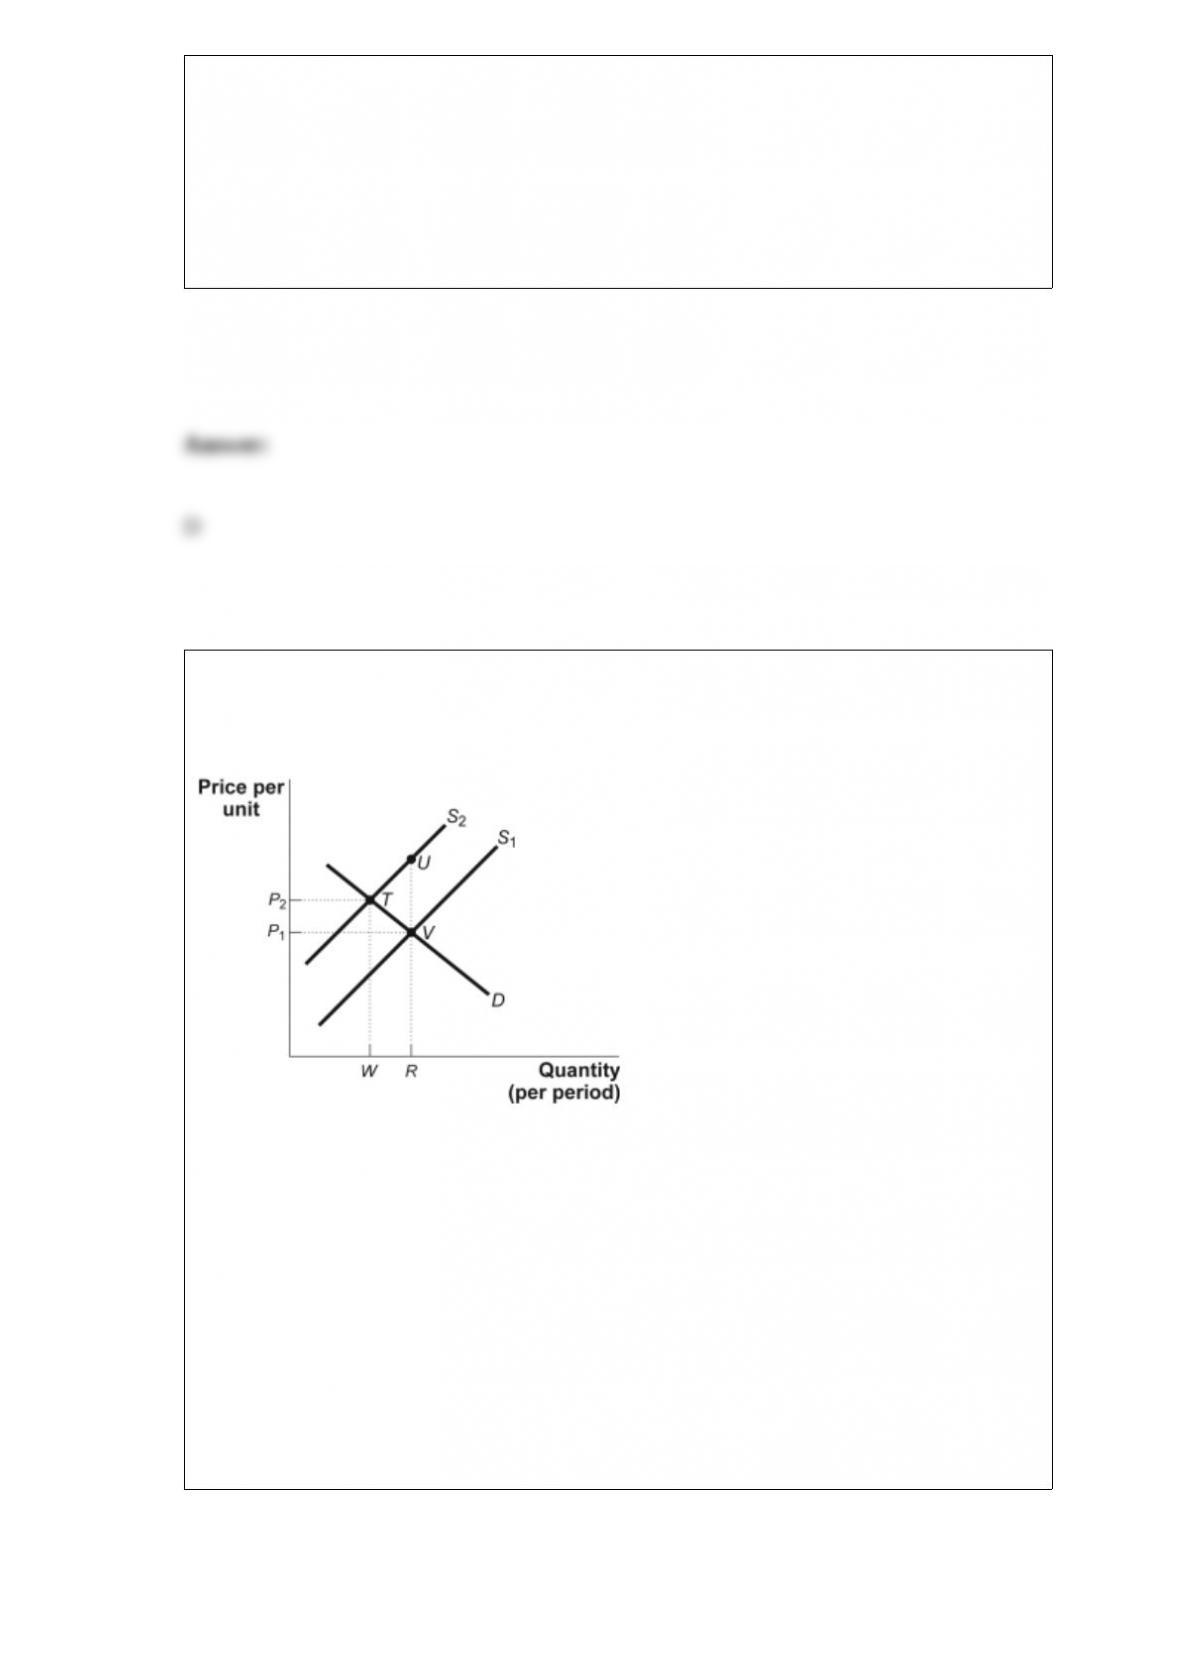
A) $300
B) $250
C) $50
D) $10
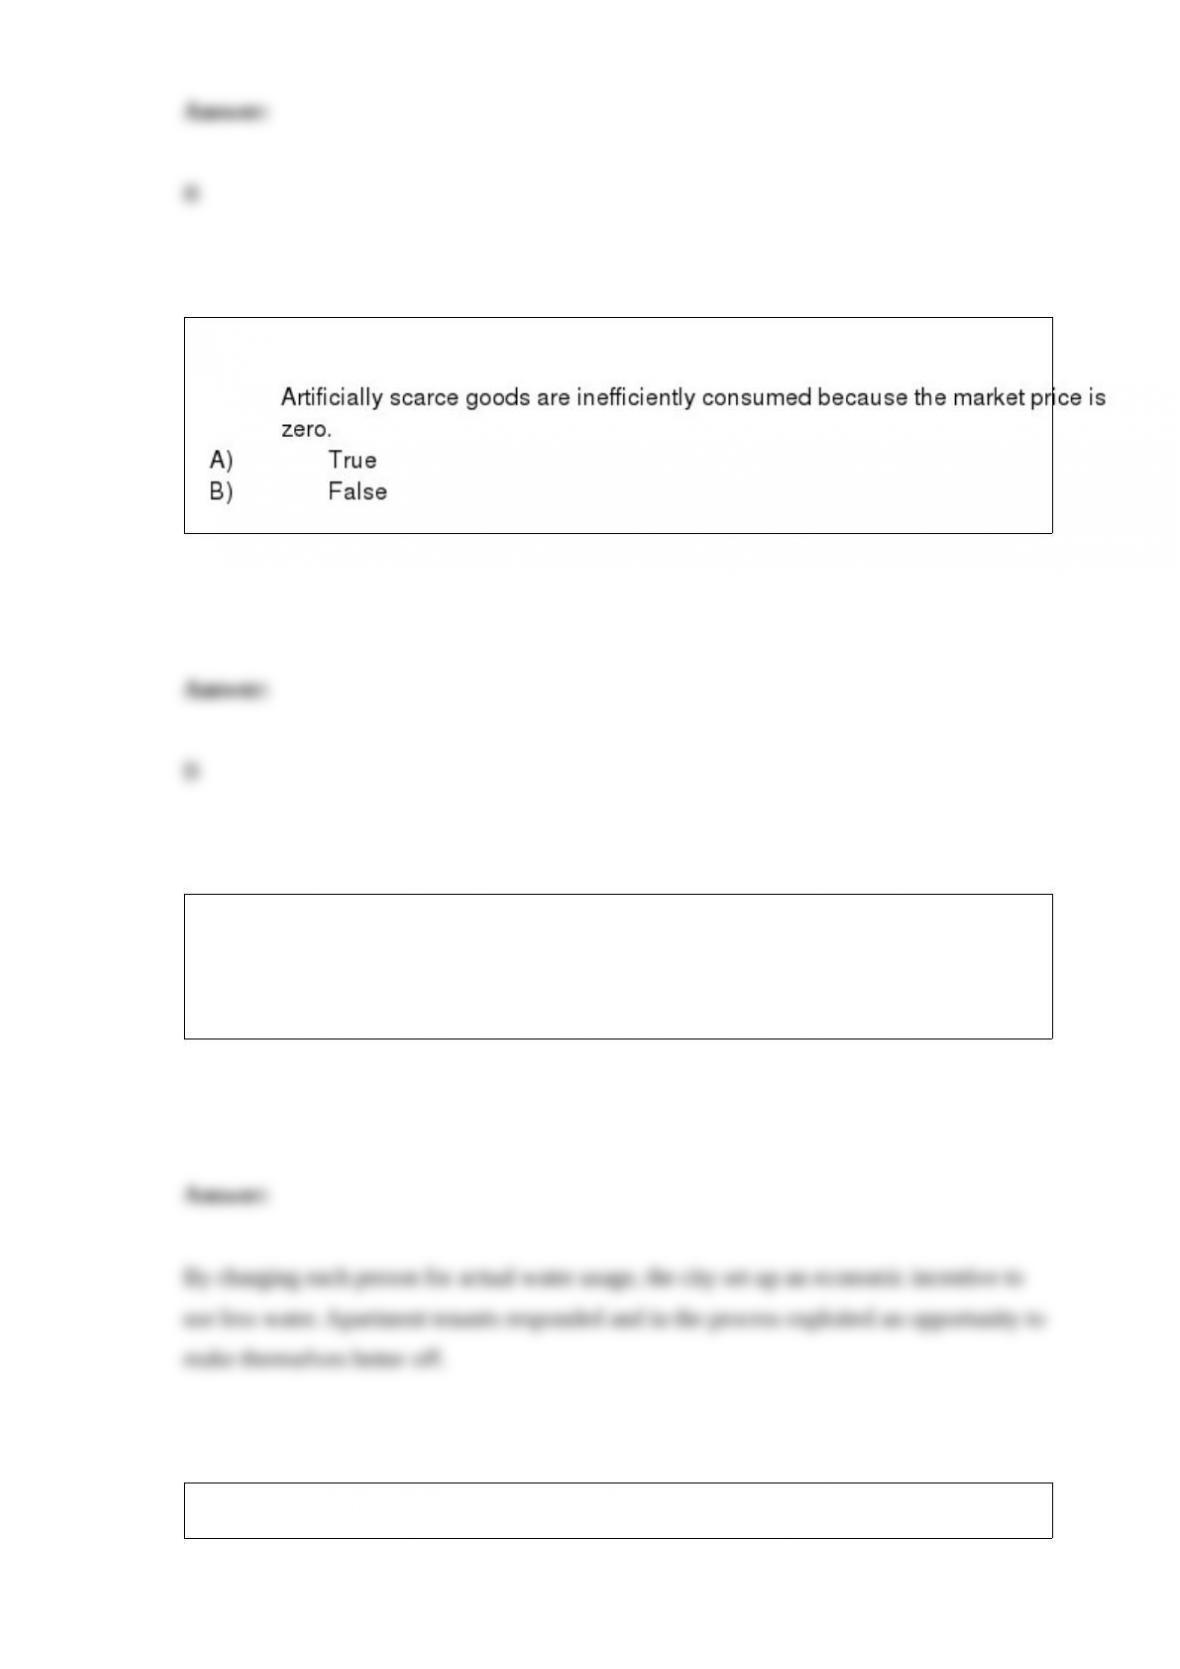
Figure: Correcting for Market Failure
(Figure: Correcting for Market Failure) There is an external cost in the market
illustrated in the figure Correcting for Market Failure. If the government forces the
private-sector firms to face the external cost:
A) the supply curve shifts to the right, from S2 to S1.
B) the supply curve shifts to the left, from S1 to S2.
C) the supply curve is unaffected.
D) price per unit decreases.
An apartment complex included a fixed price of water in the monthly rent. One day the
city decided to attach a water meter to each individual apartment and charge the tenant
for actual water usage. As a result, water usage in the apartment complex went way
down. Explain this situation using a principle of economics.

Suppose the income elasticity for cross-country bus trips is “2 and the income elasticity
for cross-country plane trips is +2. Does this make sense? Explain your answer.
Suppose you are told that the short-run price elasticity of supply for a movie theater is
zero. Does this make sense?

Since about 1950, the share of income going to the richest 10% of Americans has
steadily increased. What explains this trend?

Explain the law of demand. What does it tell us about the shape of a demand curve?
It is time to pay the bills. You pay the rent, the basic cable bill, the electricity bill, and
your grocery bill. Which of these are good examples of fixed costs and which are
variable costs? Explain your reasoning.

If the quantity demanded is 5,000 gallons at $3.00 per gallon, the price elasticity of
demand for gasoline is 0.5, and the price rises to $3.15 per gallon, how many gallons of
gas will be sold at this higher price? (Use the conventional method, not the midpoint
method, of calculating price elasticity of demand.)
The competitive labor market for economists is in equilibrium. Suppose that more
college students decide to major in economics. How will this affect the labor market?

Consider the statement, “When the marginal cost is rising, the average total cost must
also be rising.” Is this statement true or false? Explain your reasoning.
The supply curves for goods and services are almost universally upward-sloping. How
is it that labor supply can be downward-sloping in certain cases?
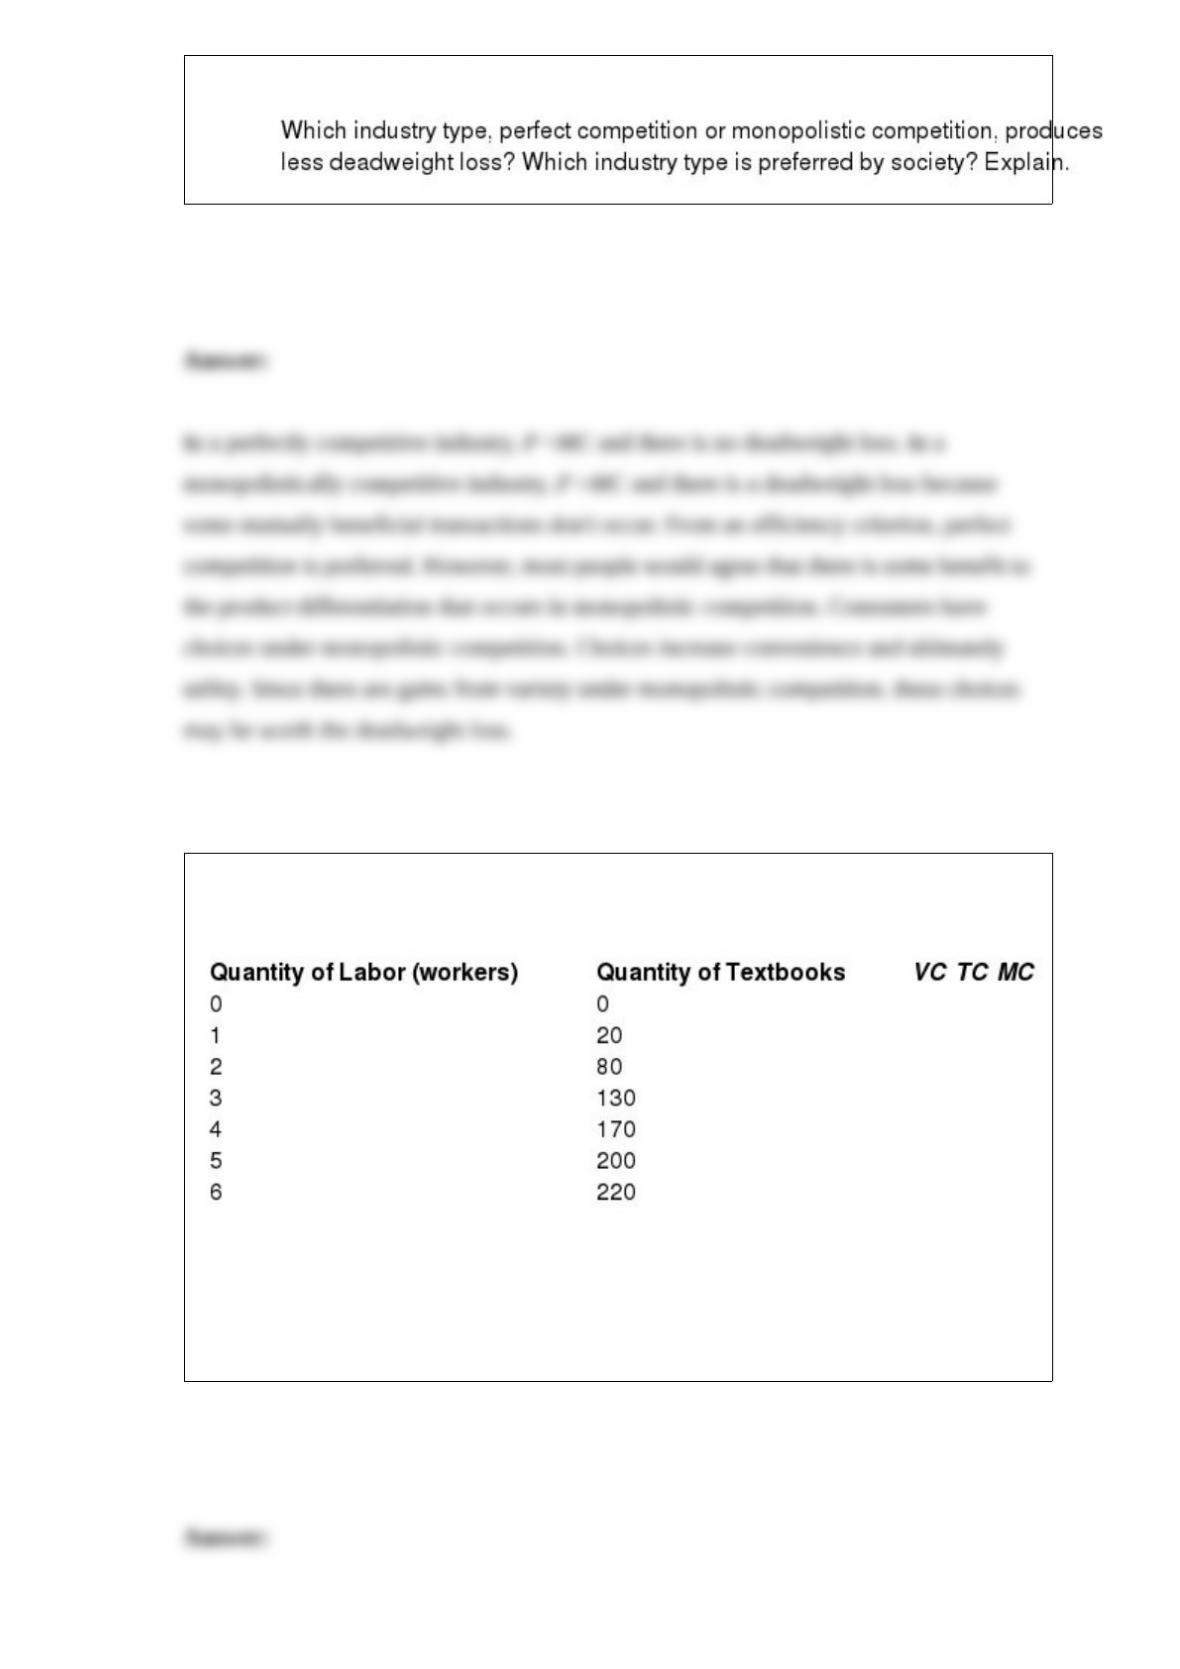
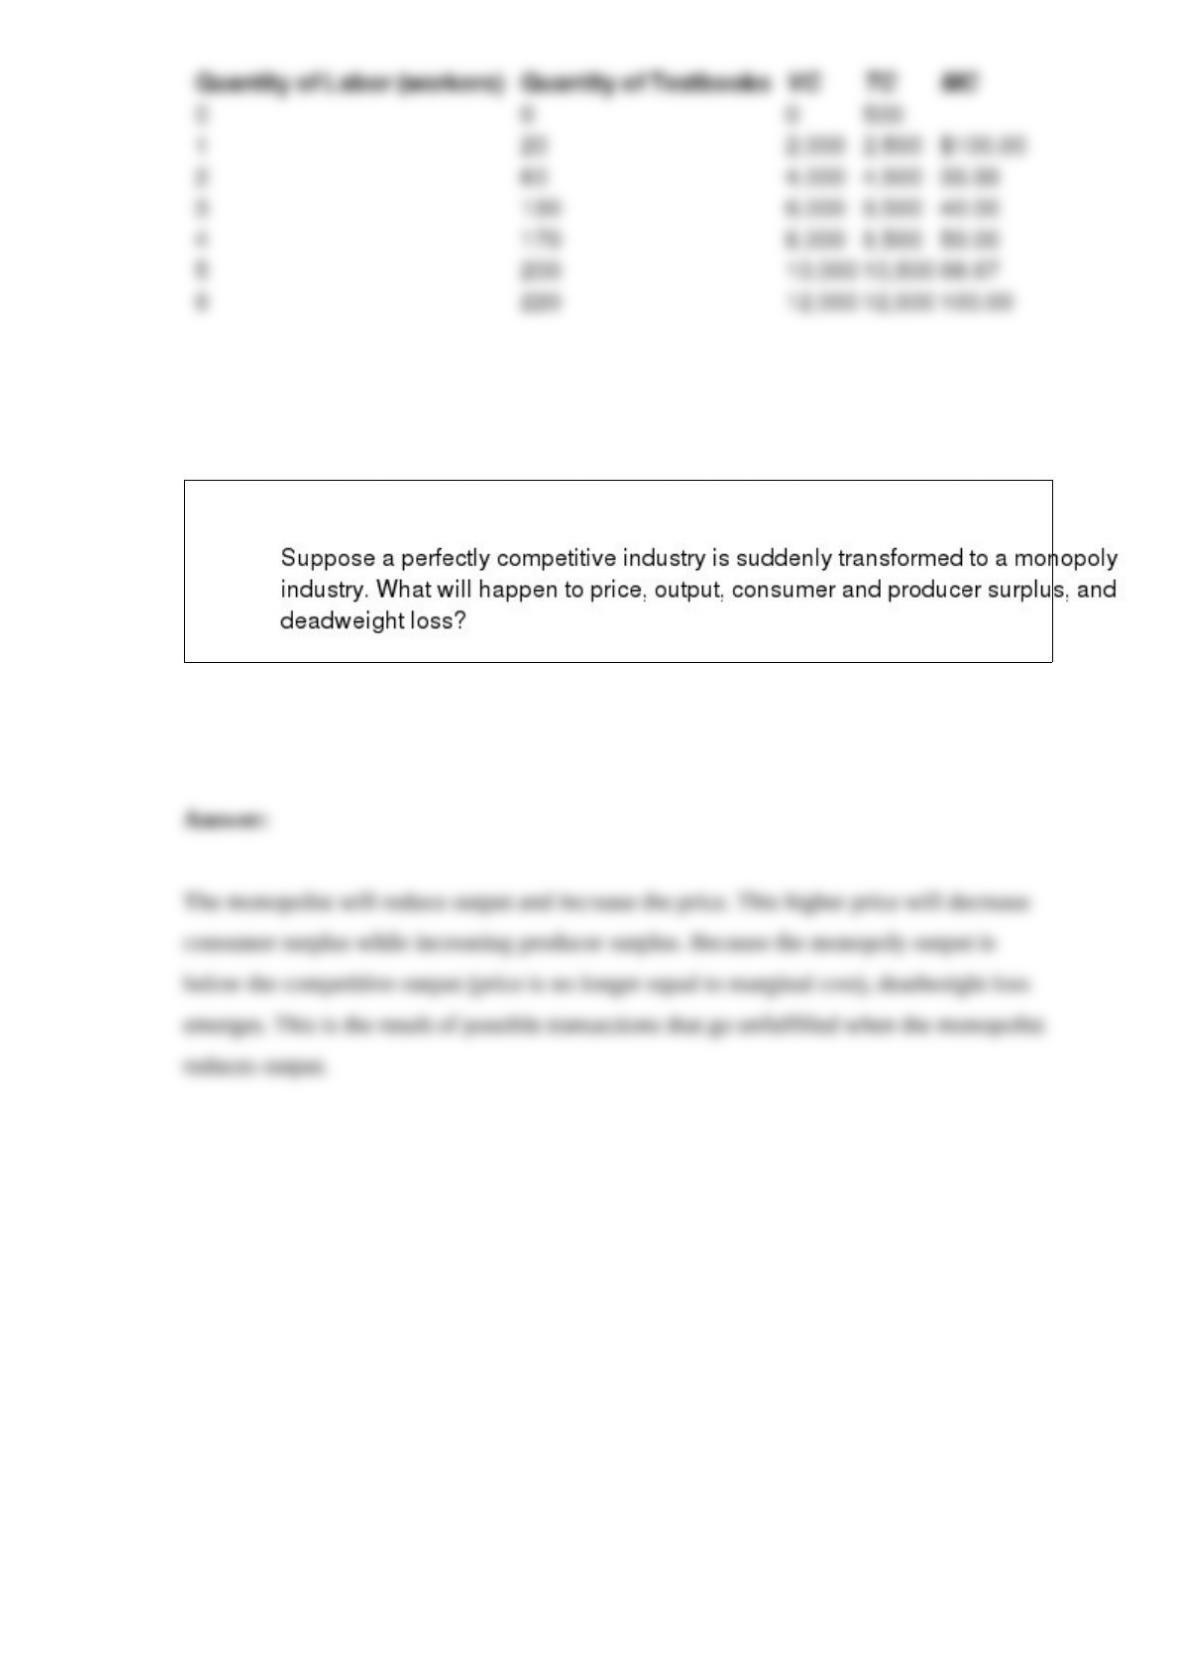
Table: Marie’s Production and Costs
(Table: Marie’s Production and Costs) Look at the table Marie’s Production and Costs.
Marie has fixed costs of $500 per month and hires workers for $2,000 each per month.
Some of Marie’s monthly production and cost information is in the accompanying table.
Calculate the missing information and complete the table.