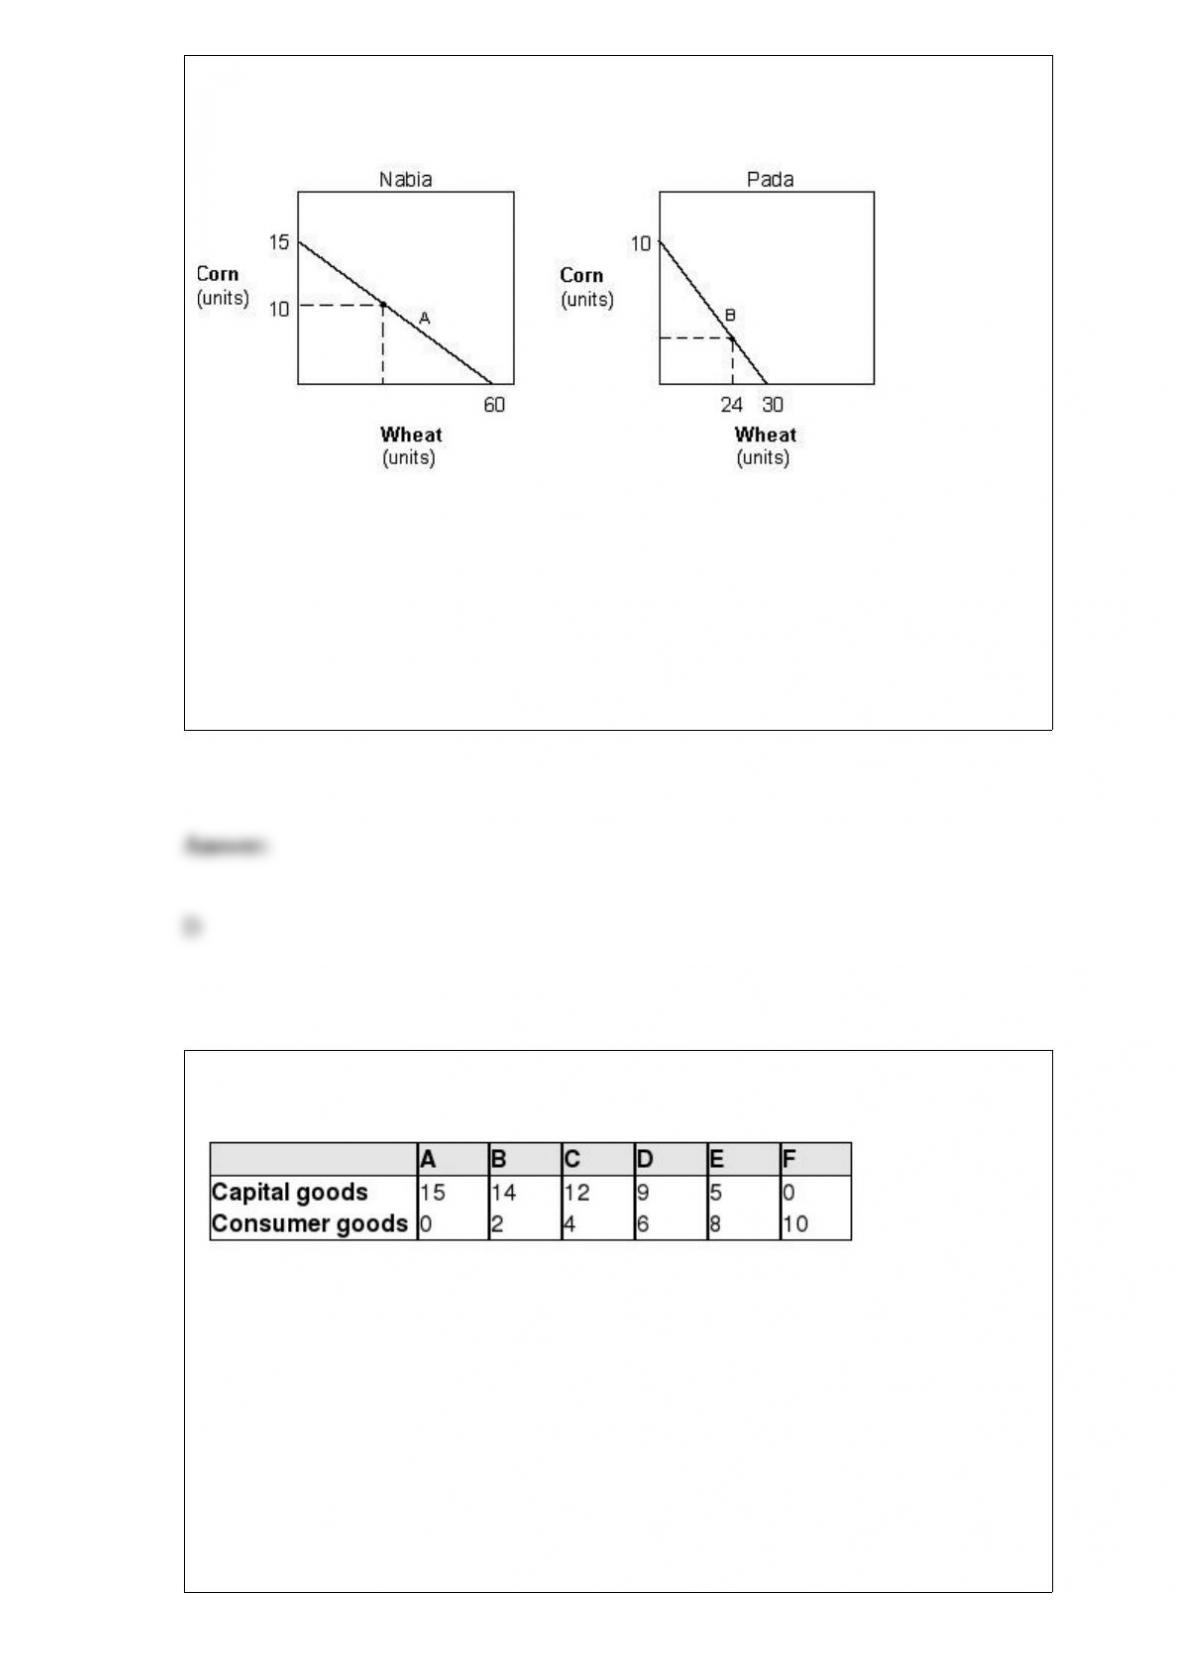
Exhibit 15-1 Production possibilities curves
In Exhibit 15-1, the production possibilities curves of wheat and corn for Nabia and
Pada are presented. Suppose Nabia produces at point A on its PPC. How many units of
wheat is the country able to produce?
a. 15.
b. 60.
c. 5.
d. 20.
e. 40.
Exhibit 2-8 Production possibilities curve data
As shown in Exhibit 2-8, a total output of 14 units of consumer goods and 1 unit of
capital goods is:
a. the result of maximum use of the economy’s labor force.
b. an efficient way of using the economy’s scarce resources.
c. unobtainable in this economy.
d. less than the maximum rate of output for this economy.
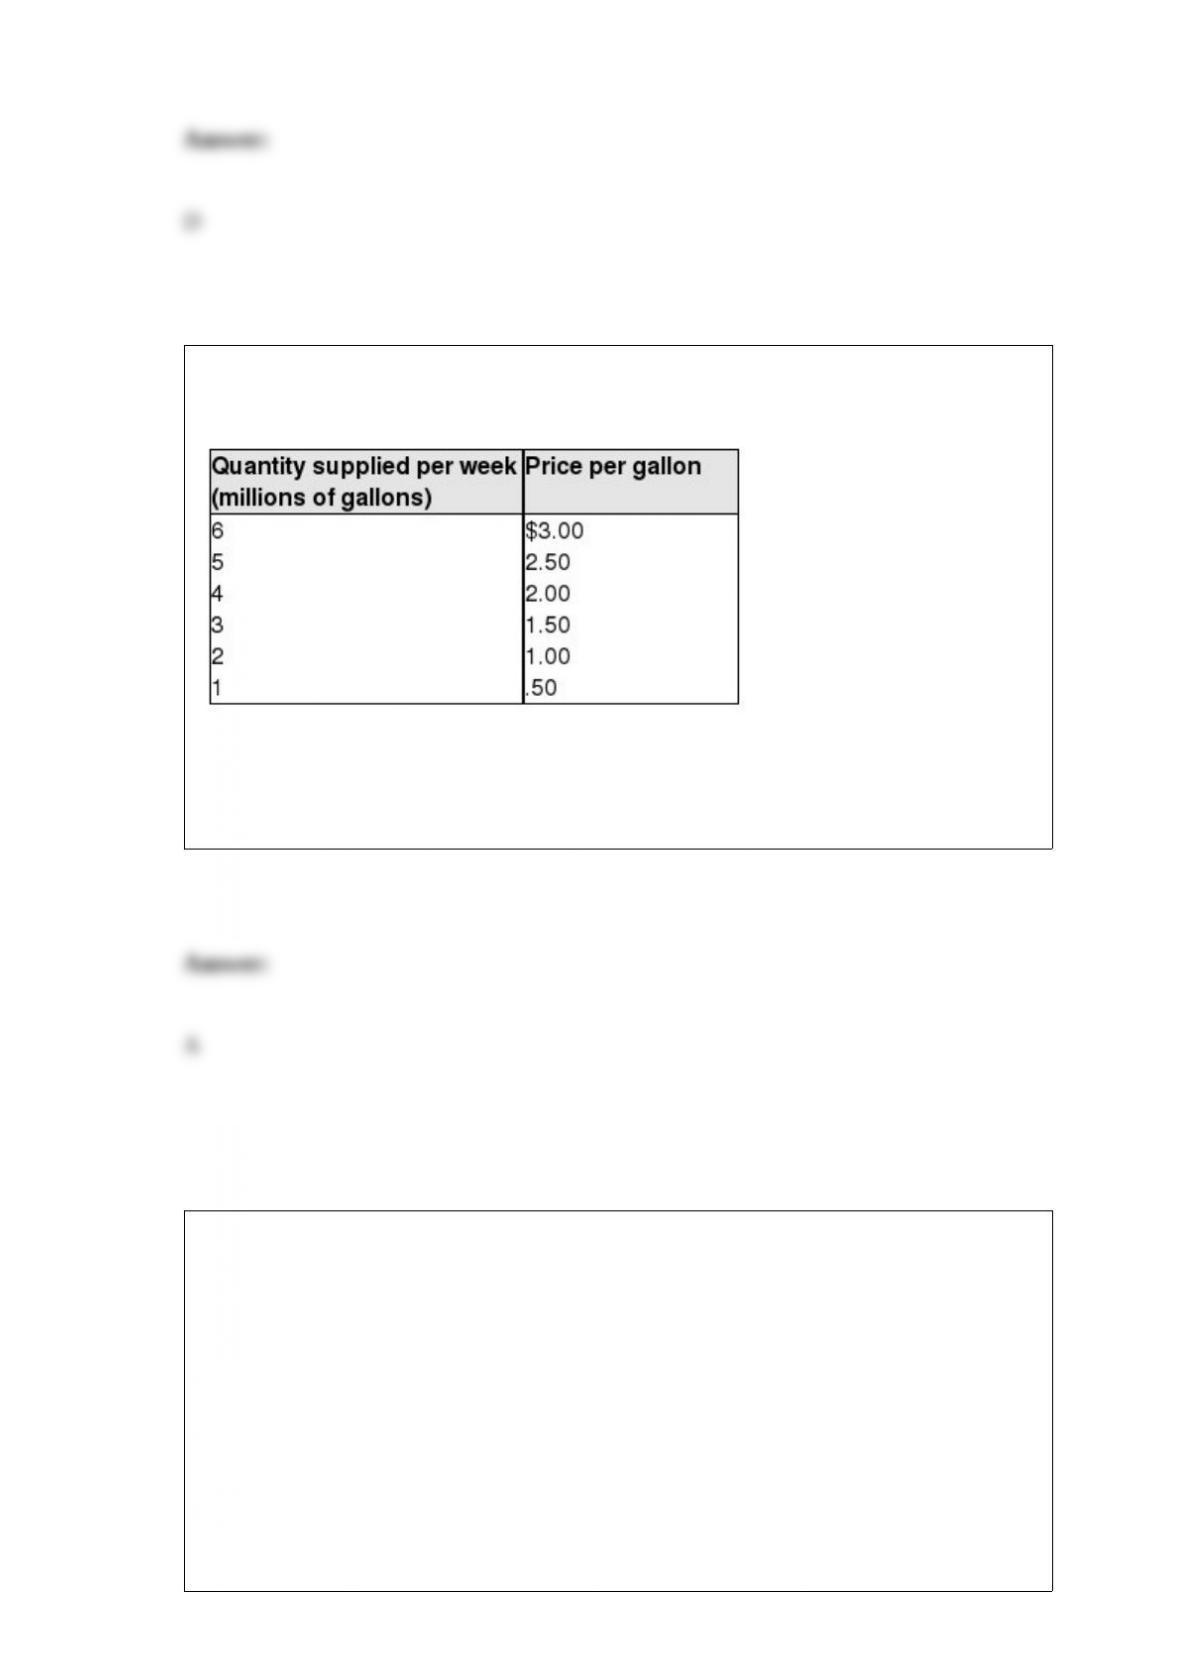
Exhibit 3-5 Supply for Tucker’s Cola Data
As shown in Exhibit 3-5, the price and quantity supplied by sellers of Tucker’s Cola
have a(n) ____ relationship.
a. direct. c. negative.
b. inverse. d. zero.
A price floor would be established in cases where the government believed the market
equilibrium price would:
a. result in a surplus.
b. be too high.
c. result in a shortage.
d. be too low.
e. yield excess profits.
If the dollar appreciates (becomes stronger) this causes:
a. the relative price of U.S. goods to increase for foreigners.
b. the relative price of foreign goods to decrease for Americans.
c. U.S. exports to fall and U.S. imports to rise.
d. a balance of trade deficit for the U.S.
e. all of these.
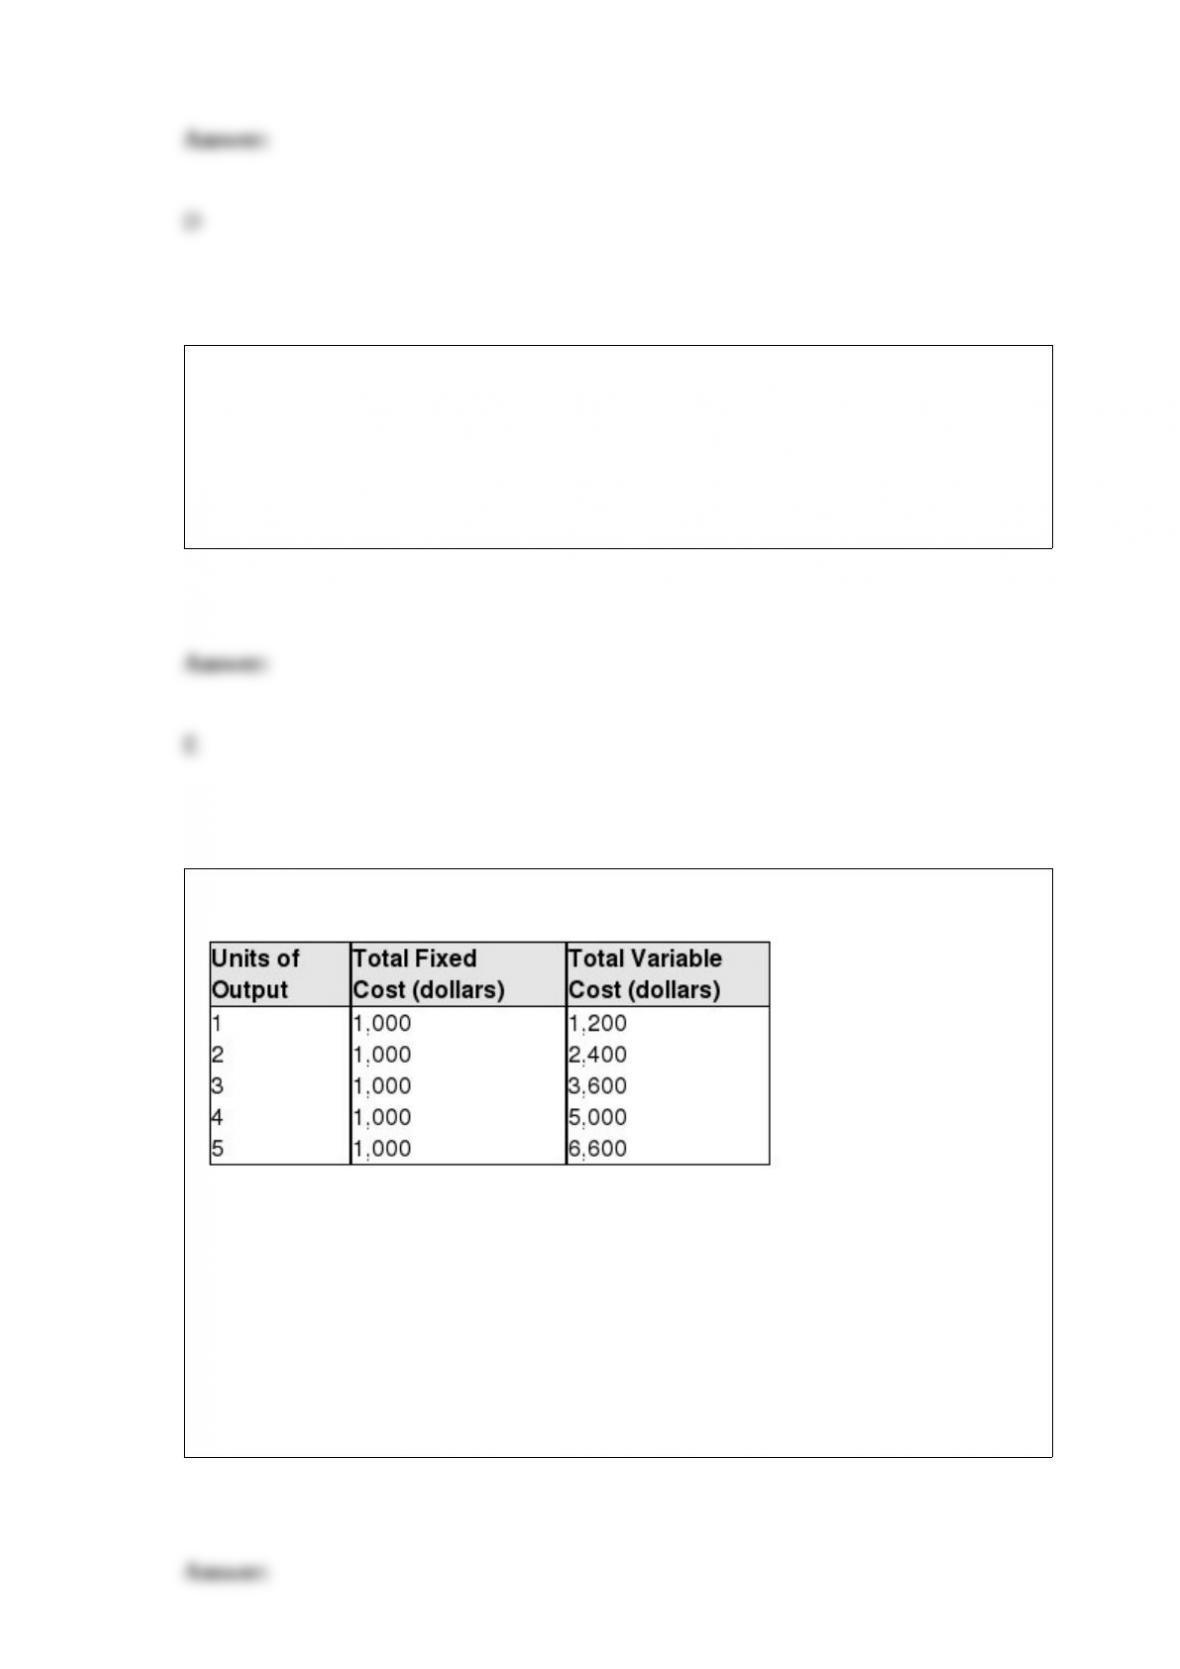
Which of the following explains most accurately why the firm’s short-run marginal cost
curve will eventually rise?
a. As more of the variable factor is used, its price will rise.
b. When diminishing marginal returns set in, it will take ever-larger quantities of the
variable resources to produce an additional unit of output.
c. As the variable factor is used more intensely, its marginal product will rise, causing
an increase in marginal costs.
d. As the size of the firm increases, the operational efficiency of the firm declines,
causing an increase in marginal costs.

To maximize its profits, a monopoly should produce the quantity where its marginal
cost equals its:
a. average total cost.
b. average variable cost.
c. demand.
d. marginal revenue.
The statement, “Violent crime has decreased in the last five years,” is:
a. obviously wrong and, therefore, cannot be a positive statement.
b. normative since it can be answered by simply looking at the facts.
c. positive because it is testable.
d. not very interesting because all normative issues are of little importance.
Which of the following statements is true?
a. A monopsony is the only employer of a factor of production.
b. A monopsony will pay workers a higher wage and employ fewer workers than a
competitive labor market.
c. A monopsony has a marginal factor cost curve which lies below its supply curve of
labor.
d. Unions are becoming a greater influence in American labor markets.
e. All of these.
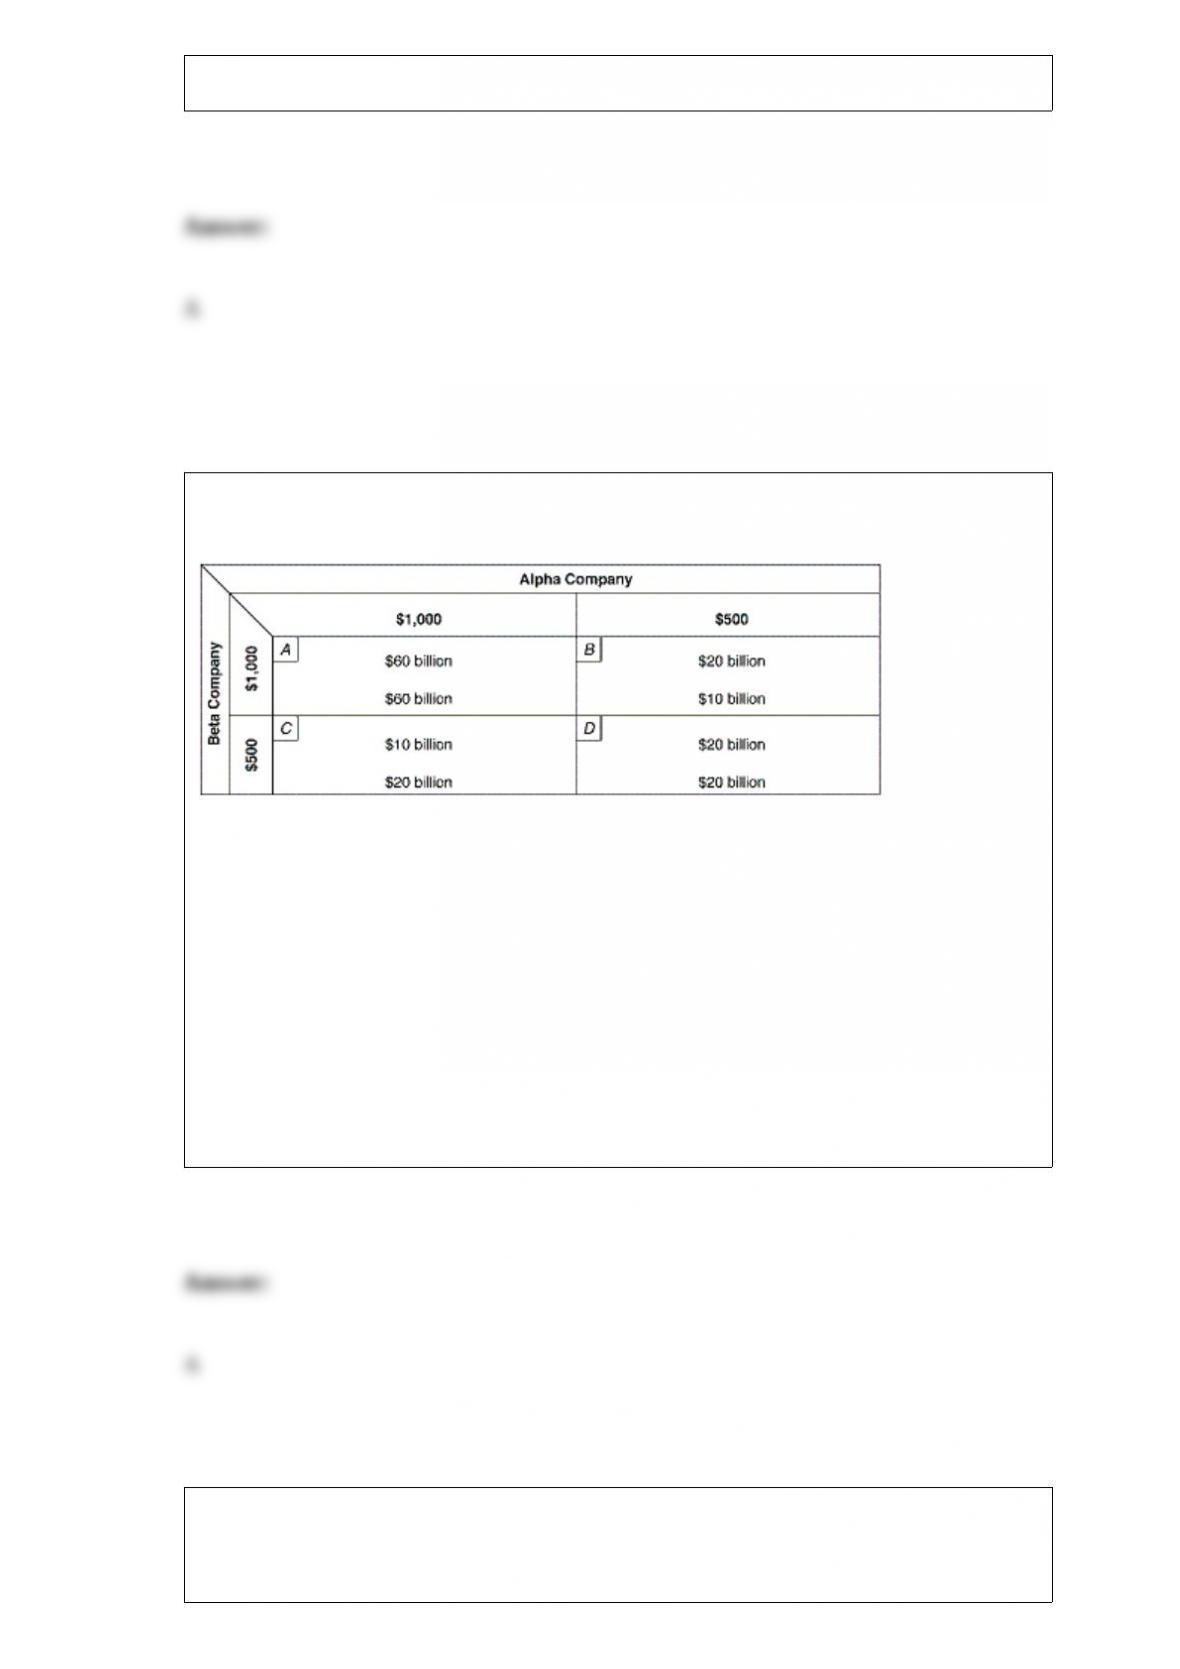
Exhibit 10-5 Two-Firm Payoff Matrix
Suppose costs are identical for the two firms in Exhibit 10-5. Each firm assumes
without formal agreement that if it sets the high price its rival will not charge a lower
price. Under these “tit-for-tat” conditions, equilibrium will be established by:
a. Beta Co. charging $1,000 and Alpha Co. charging $1,000.
b. Beta Co. charging $1,000 and Alpha Co. charging $500.
c. Beta Co. charging $500 and Alpha Co. charging $500.
d. Beta Co. charging $500 and Alpha Co. charging $1,000.
One reason the supply of carpenters is greater than the supply of physicians is because:
a. carpenters demand less income.
b. physicians do not belong to a union.
c. of differences in human capital.
d. carpenters belong to unions.
According to the utility model of consumer demand, the demand curve is
downward-sloping because of the law of:
a. diminishing marginal utility. c. consumer equilibrium.
b. diminishing consumer equilibrium. d. diminishing utility maximization.
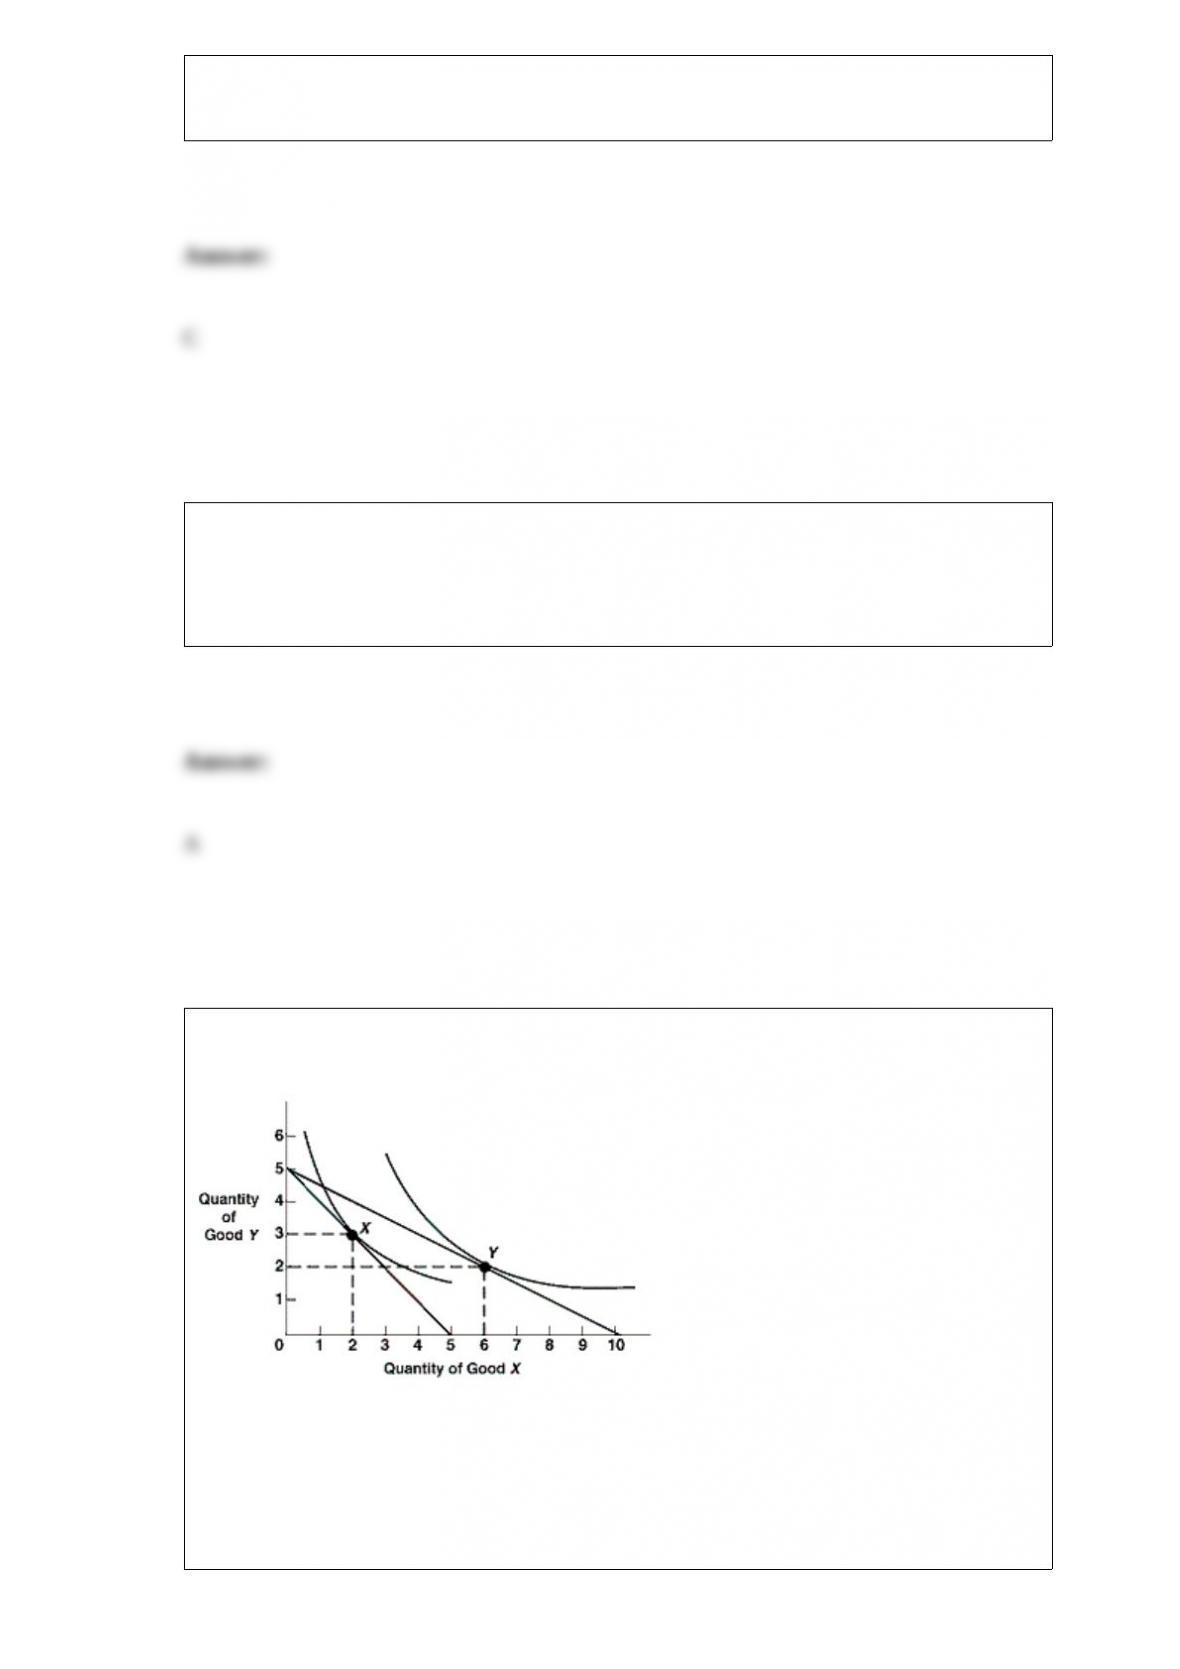
Exhibit 6A-5 Consumer equilibrium
As shown in Exhibit 6A-5, movement from consumer equilibrium at point Y to point X
is caused by a(n):
a. increase in the price of good X.
b. decrease in the price of good X.
c. increase in the price of good Y.
d. decrease in the price of good Y.
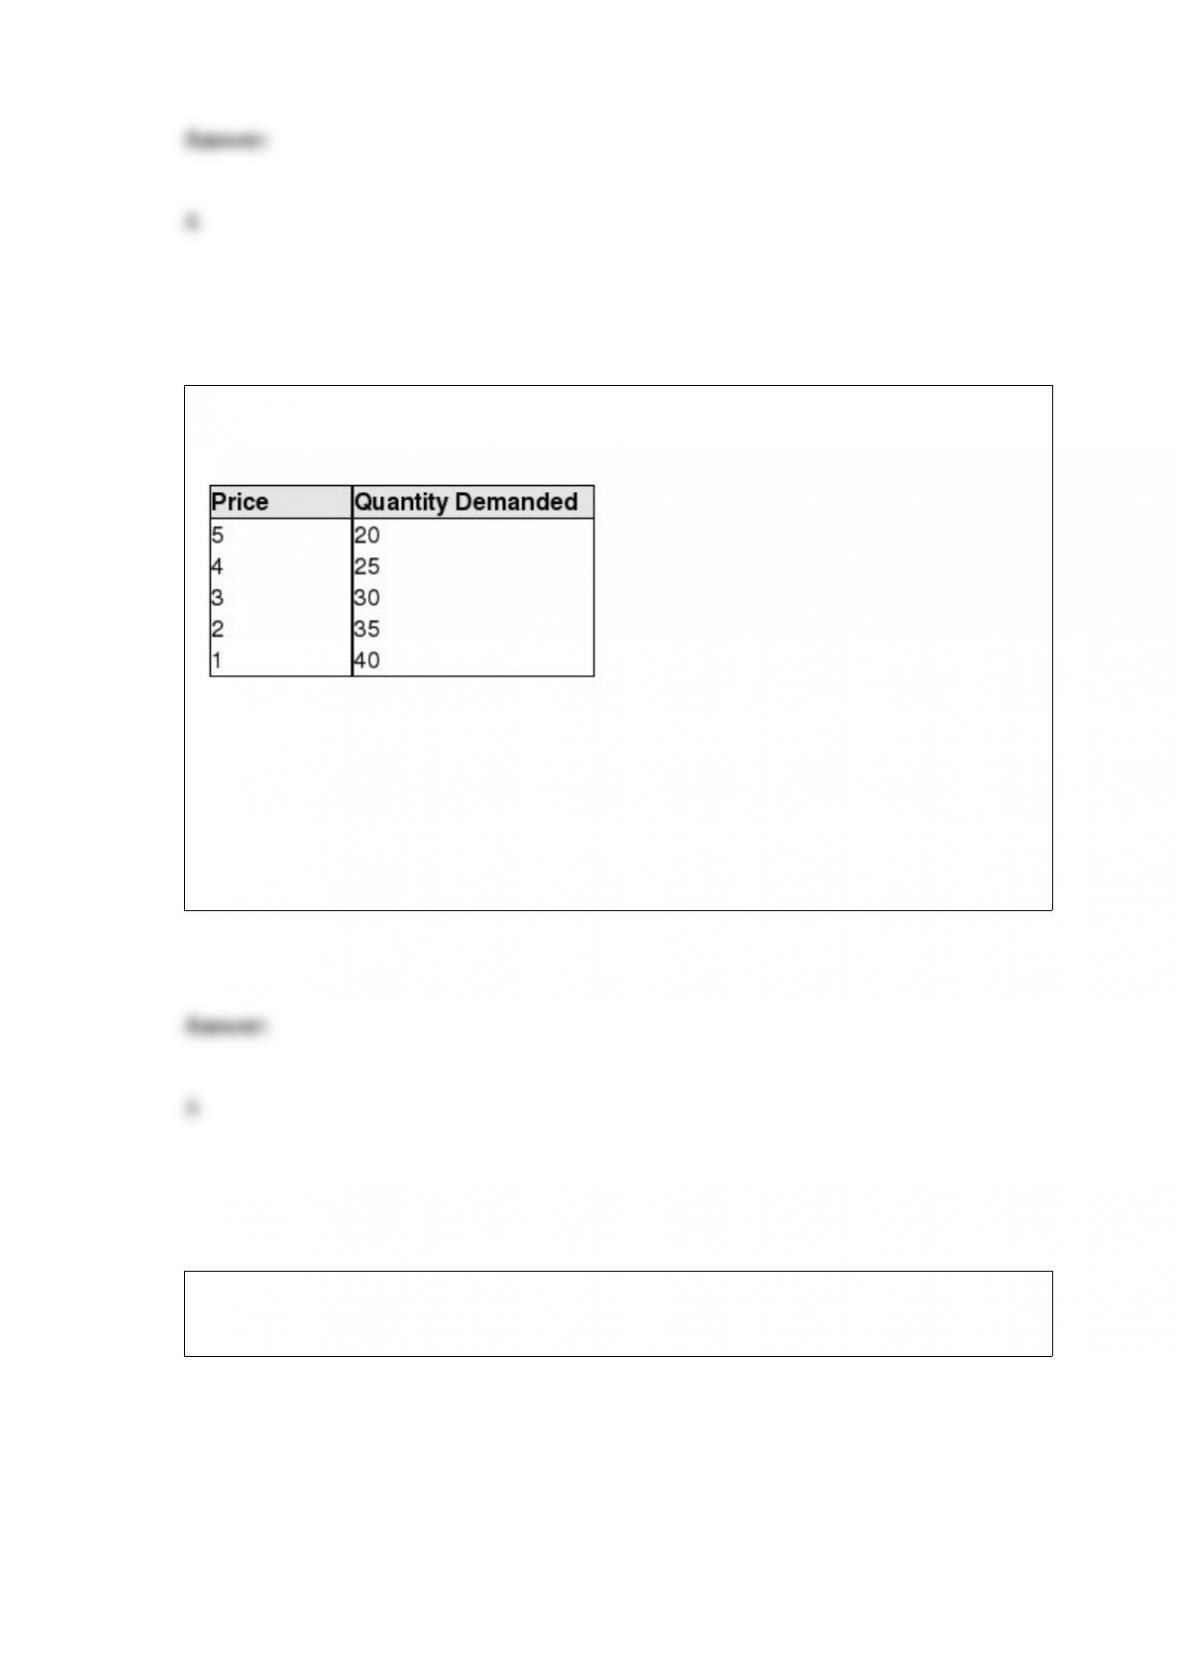
Exhibit 5-2 Price and quantity demanded data
Using Exhibit 5-2, what is the price elasticity of demand when the price falls from five
dollars to four?
a. 1.
b. 1.25.
c. 0.8.
d. 2.0.
e. 0.4.
Exhibit 4-3 Supply and demand curves
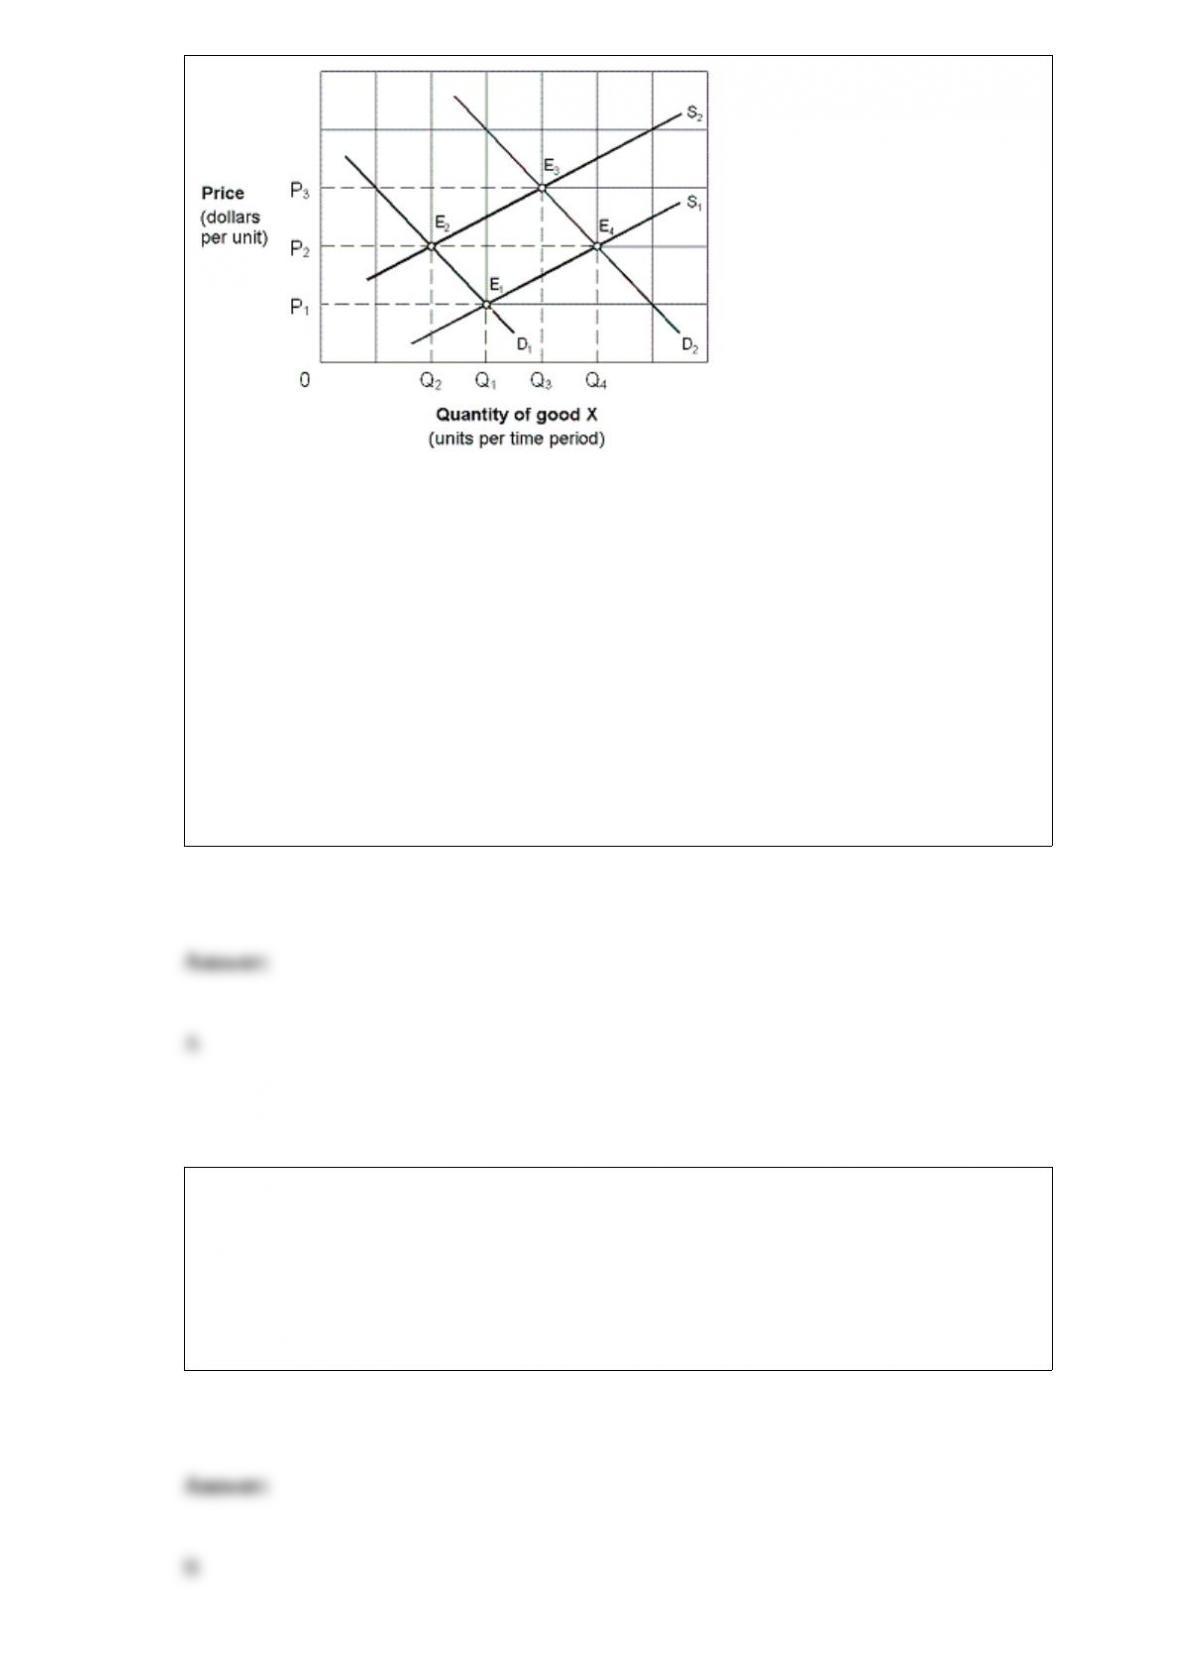
Initially the market shown in Exhibit 4-3 is in equilibrium at P2, Q2 (E2). Changes in
market conditions result in a new equilibrium at P2, Q4 (E4). This change is stated as
a(n):
a. increase in supply and an increase in demand.
b. increase in supply and a decrease in demand.
c. decrease in demand and a decrease in supply.
d. increase in demand with supply held constant at S2.
Which of the following will increase the demand for motorcycles?
a. A fall in the price of motorcycles.
b. A fall in insurance rates for motorcycles.
c. A fall in the price of automobiles.
d. A fall in buyers’ incomes (assuming motorcycles are a normal good).
e. A fall in consumer preference for motorcycles.
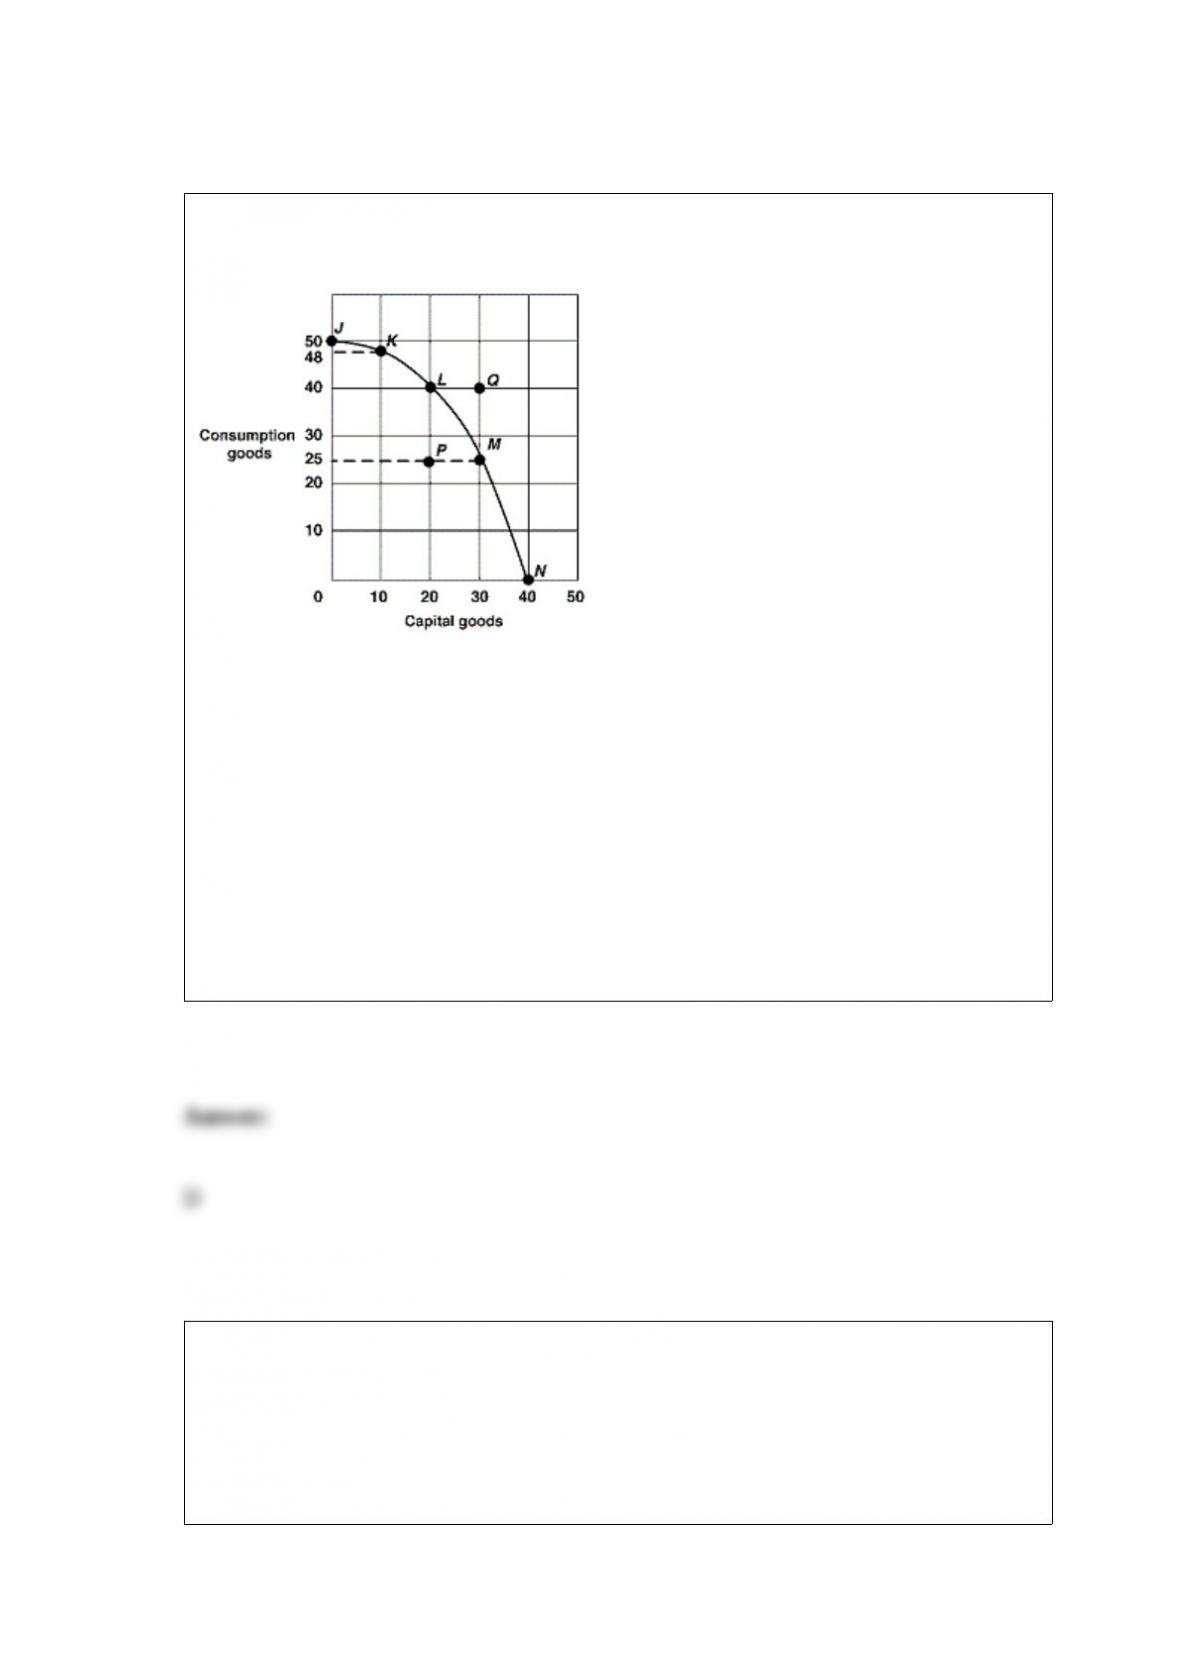
Exhibit 2-15 Production possibilities curve
In Exhibit 2-15, the production possibilities curve demonstrates:
a. changing prices.
b. economic growth.
c. decreases in resources.
d. the law of increasing opportunity costs.
e. changing technology.
For a typical firm, the long-run average total cost curve:
a. is tangent to the minimum point of each possible short-run average total cost curves.
b. is tangent to each possible short-run average total cost curve at one point.
c. intersects each possible short-run average total cost curve at two points.
d. passes through the minimum points of all possible short-run average total cost
curves.

Suppose a monopolist’s demand curve lies below its average variable cost curve. The
firm will:
a. stay in operation in the short-run.
b. earn an economic profit.
c. earn an economic profit in the long run.
d. shut down.
Suppose that 1000 identical sellers each set their profit-maximizing output level at 18
units when price equals $10. Then what is market quantity supplied at a price of $10.
a. 100.
b. 1,000.
c. 10,000.
d. 18,000.
Constant returns to scale exist over the range of output for which the long-run average
cost is:
a. neither rising or falling.
b. falling.

c. rising.
d. none of these.
A monopsony will:
a. hire more workers than a competitive employer.
b. pay a higher wage than a competitive employer.
c. employ a quantity of labor where the marginal revenue product equals the marginal
factor cost.
d. all of these.
A picture frame company operates in a monopolistically competitive market. Its
short-run equilibrium price is $80 and its ATC is $65. It sells 100 picture frames a
week. From this we can tell:
a. this firm is making a normal profit.
b. other picture frame companies will want to exit the market.
c. there are no other picture frame companies in the area.
d. economic profits are $1,500.
e. total profits are being maximized.

The short-run supply curve and short-run marginal cost curve for a perfectly
competitive firm coincide when the market price is greater than average variable cost.
Costs in a natural monopoly are lower because there is only one producer.
A monopolist always earns an economic profit.
A firm’s average fixed cost curve can never be U-shaped, even if its other average cost
curves are U-shaped.
What is a natural monopoly? Why is government justified in regulating a natural
monopoly?