Unlock document.
This document is partially blurred.
Unlock all pages and 1 million more documents.
Get Access
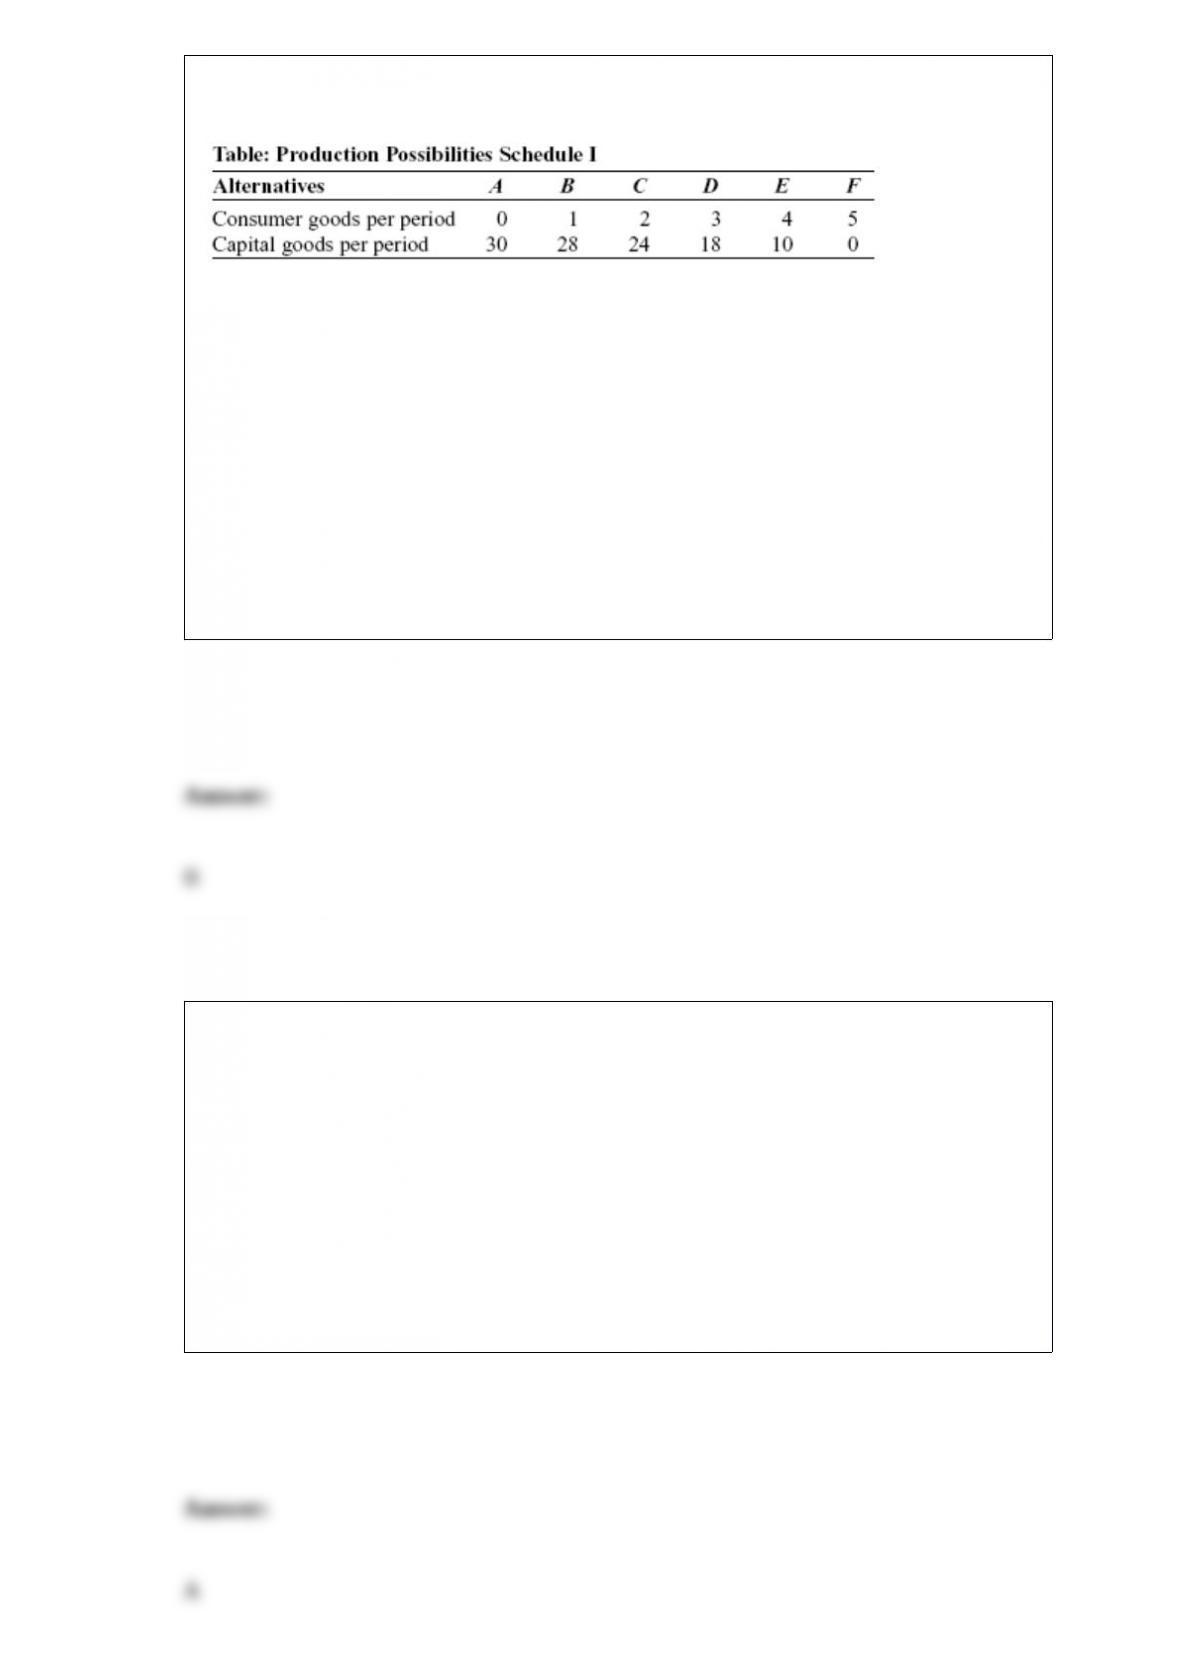
(Table: Production Possibilities Schedule I) Look at the table Production Possibilities
Schedule I. If the economy produces 10 units of capital goods per period, it also can
produce at most _____ units of consumer goods per period.
A) 5
B) 4
C) 3
D) 2
Suppose government officials have set an emissions tax to reduce pollution. Further
suppose that with the emissions tax, the marginal social cost of pollution exceeds the
marginal social benefit of pollution. The emissions tax is:
A) too low.
B) too high.
C) optimal.
D) efficient.
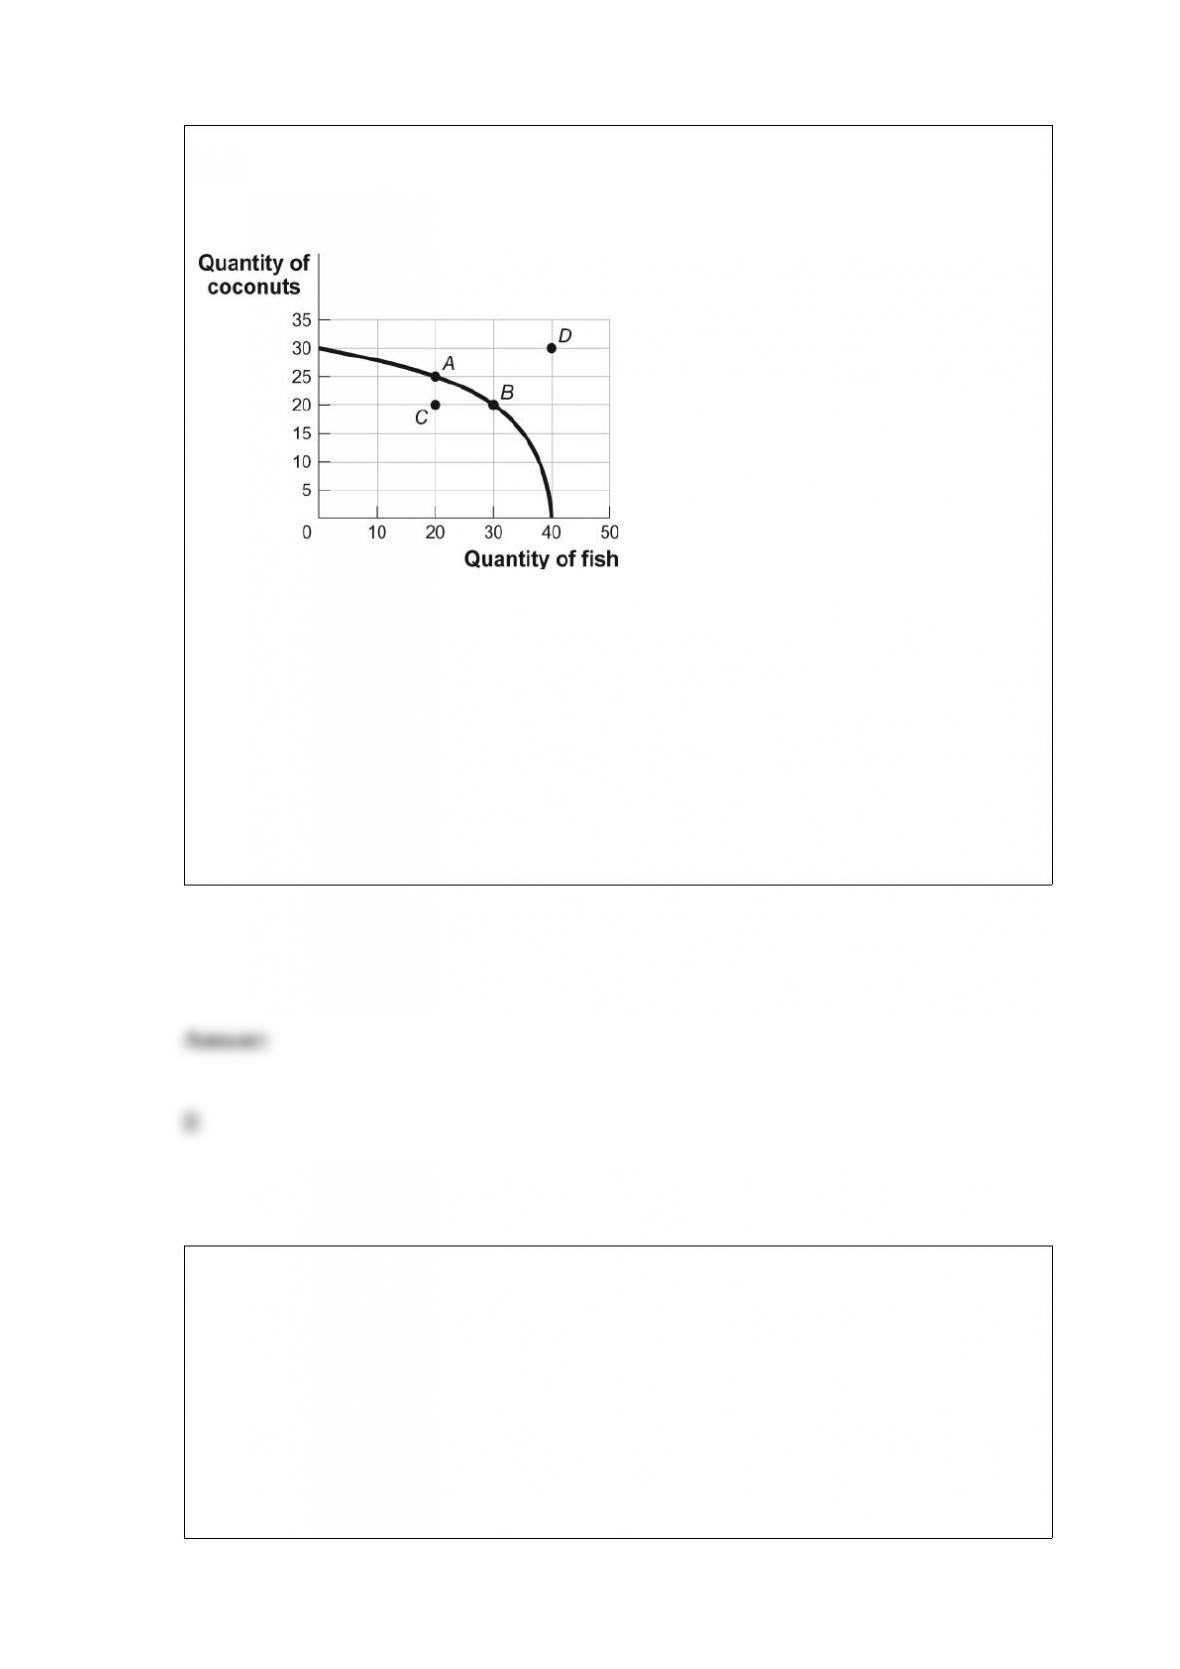
Figure: Tom's Production Possibilities
(Figure: Tom's Production Possibilities)
Look at the figure Tom's Production Possibilities. The opportunity cost for Tom to move
from point B on the curve to point A is:
A) 10 coconuts.
B) 10 fish.
C) 5 coconuts.
D) 5 fish.
The mean household income is:
A) the income of households lying at the exact middle of the income distribution.
B) the average income across all households.
C) the income level that policy makers wish to achieve for all households on average.
D) also the poverty threshold level.
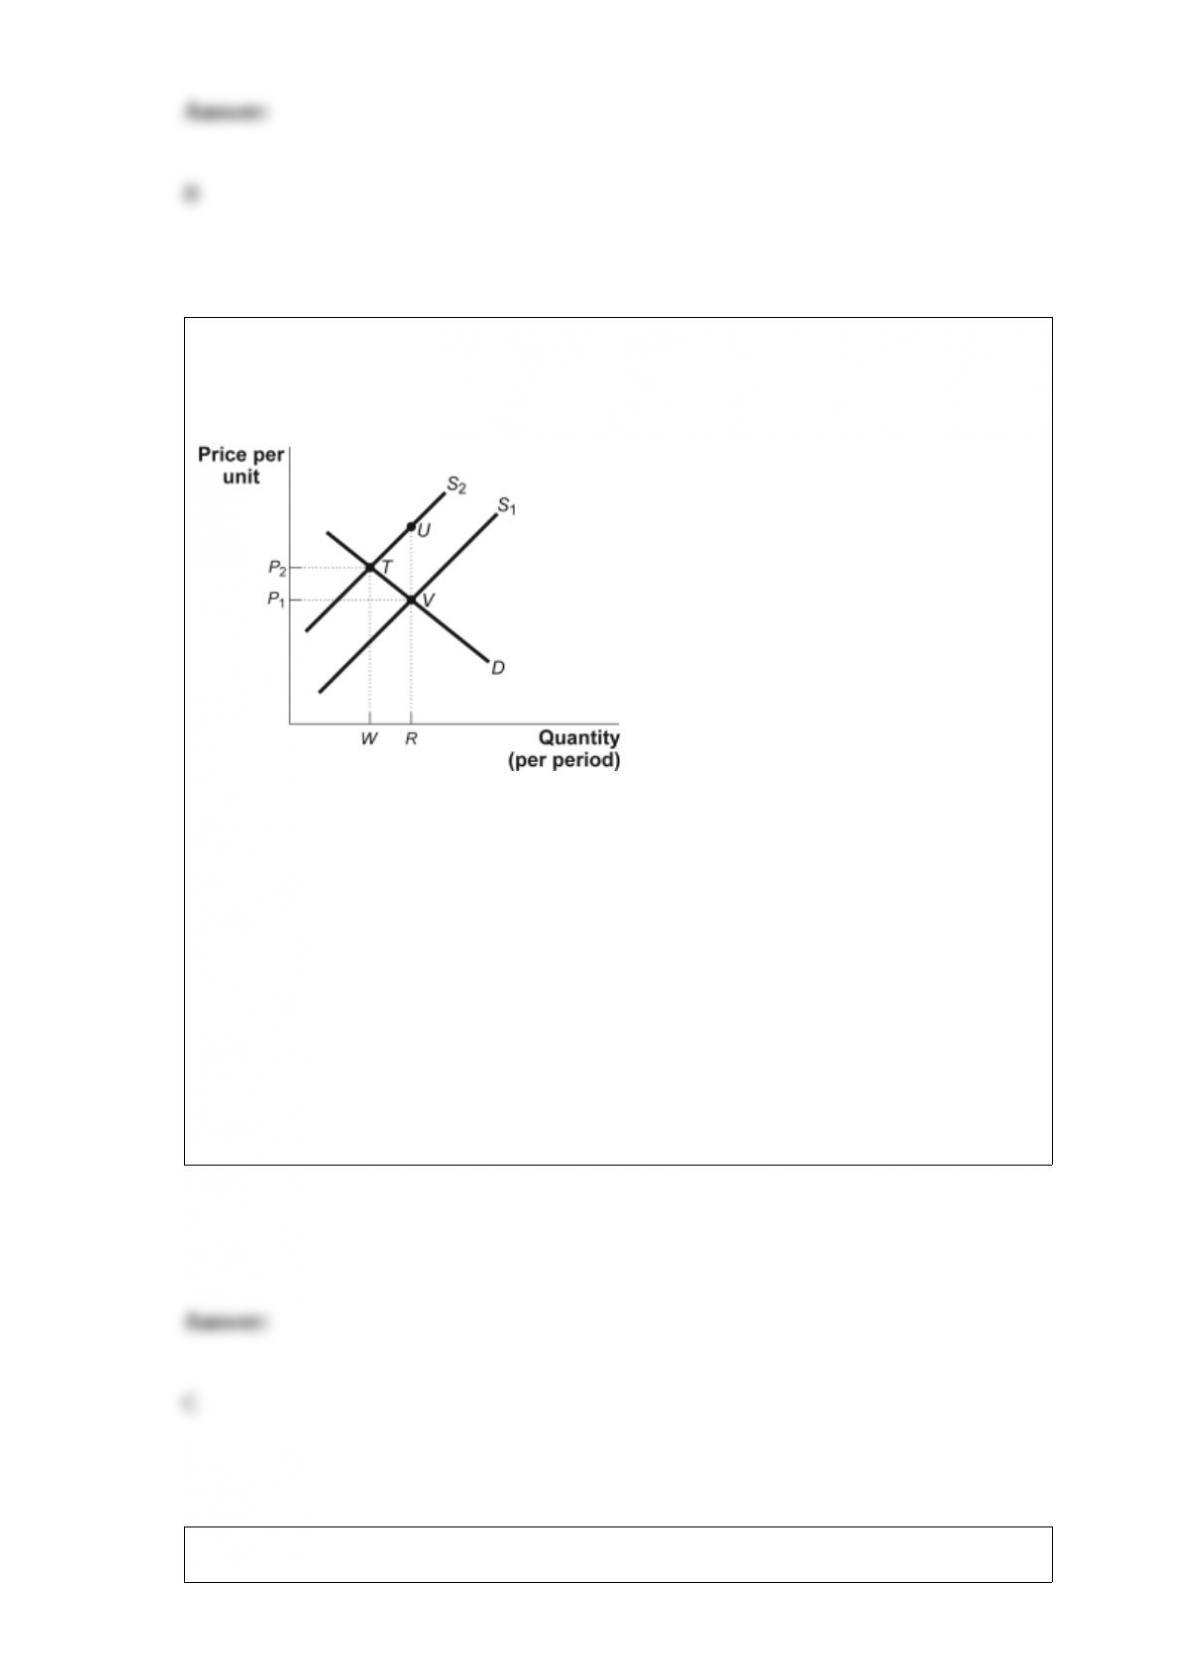
Figure: Correcting for Market Failure
(Figure: Correcting for Market Failure) There is an external cost in the market
illustrated in the figure Correcting for Market Failure. If the government intervenes to
correct for the external cost, the new _____ will now reflect _____ costs.
A) supply curve S1; private and external
B) supply curve S2; private but not external
C) supply curve S2; private and external
D) demand curve (not shown); external but not private
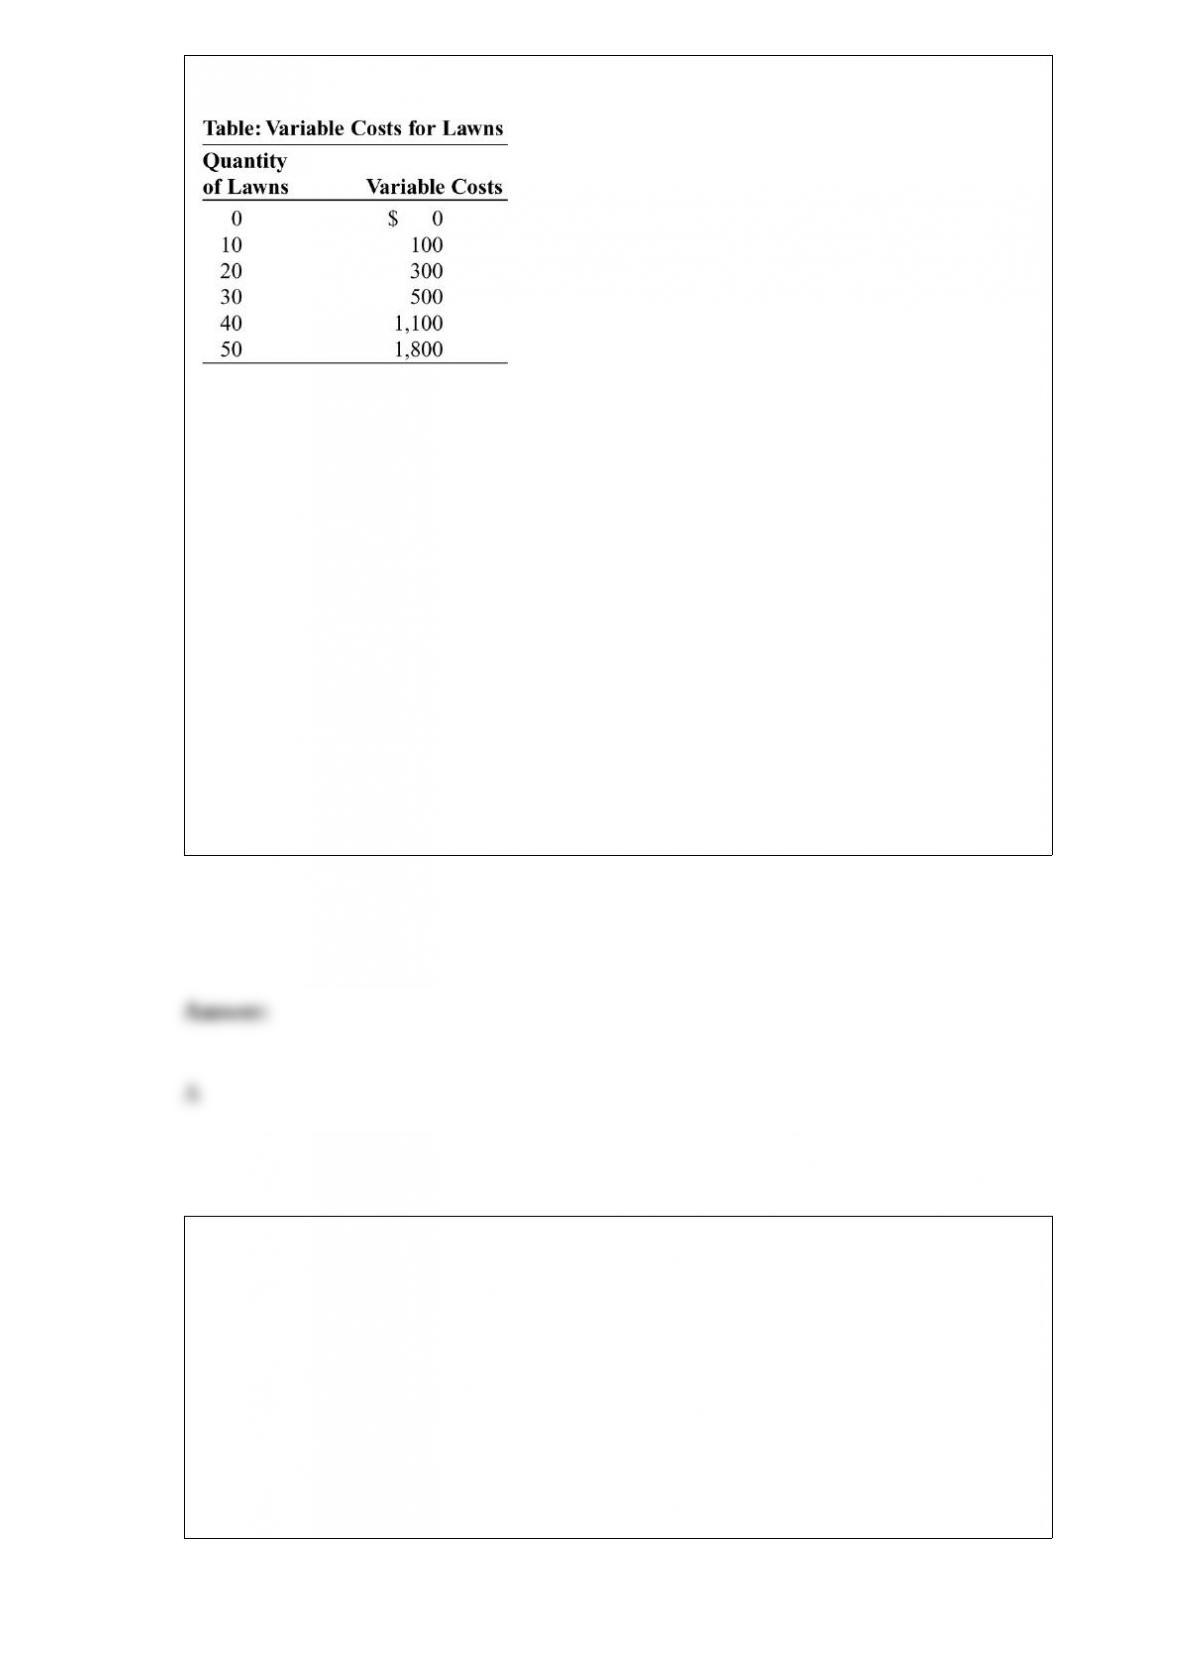
(Table: Variable Costs for Lawns) Look at the table Variable Costs for Lawns. During
the summer, Alex runs a lawn-mowing service, and lawn-mowing is a perfectly
competitive industry. Assume that costs are constant in each interval; that is, the
variable cost of mowing 1 through 10 lawns is $100. His only fixed cost is $1,000 for
the mower. His variable costs include fuel, his time, and mower parts. If the price for
mowing a lawn is $60, how much is Alex's profit per unit at the profit-maximizing
output?
A) $7.50
B) $32.50
C) $20.00
D) $60.00
When a firm produces at an output level at which MR = MC, it is operating at the _____
level.
A) shut-down
B) break-even
C) optimal output
D) minimum cost

The demand curve for a monopoly is:
A) the MR curve above the AVC curve.
B) the MR curve above the horizontal axis.
C) the entire MR curve.
D) above the MR curve.
The U.S. government health insurance program for people aged 65 years and older is:
A) Medicare.
B) Medicaid.
C) the Veterans Administration.
D) health savings accounts.
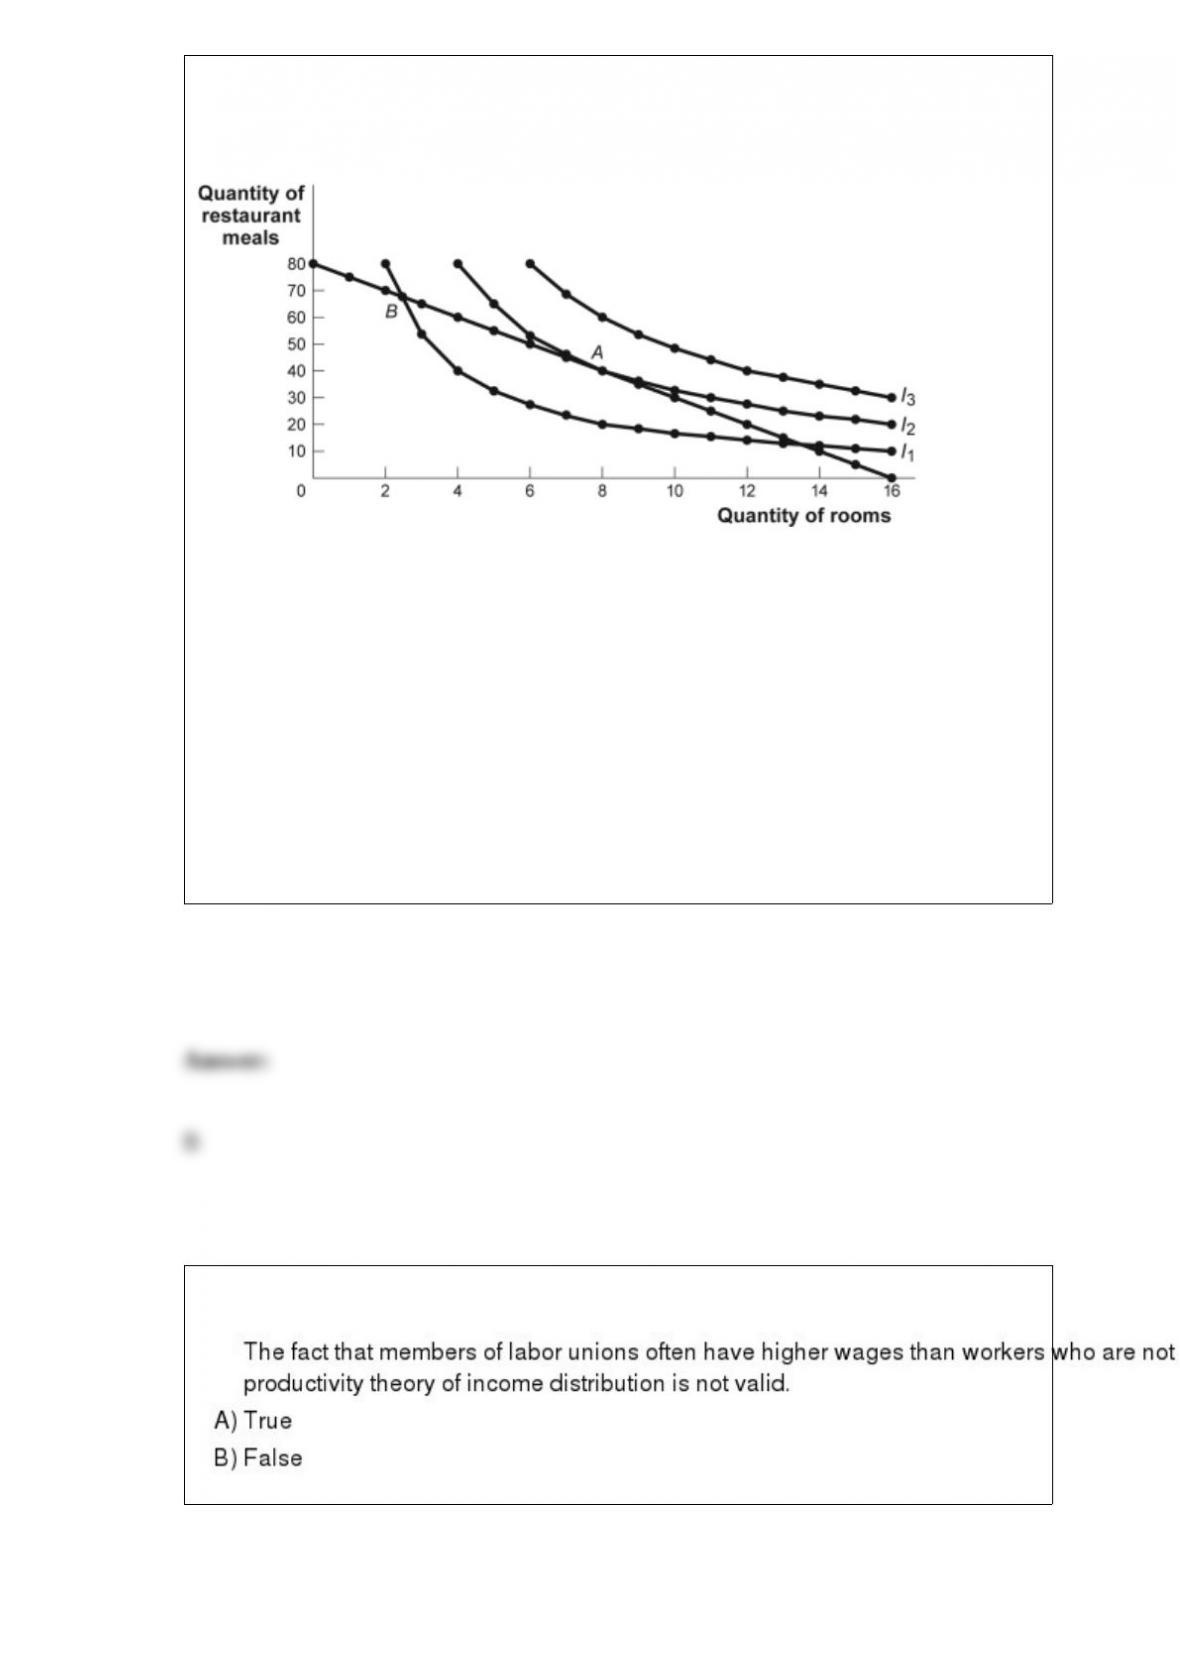
Figure: The Optimal Consumption Bundle
(Figure: The Optimal Consumption Bundle) Look at the figure The Optimal
Consumption Bundle. Which of the following could lead to an optimal consumption
bundle on indifference curve I1?
A) an increase in income
B) an increase in the price of restaurant meals
C) a decrease in the price of rooms
D) a decrease in the price of restaurant meals

The United States can produce 30 computers for every car it produces, and Japan can
produce 15 computers for every car it produces. Based on this information, which of the
following statements is INCORRECT?
A) The United States should specialize in computer production.
B) Japan has the comparative advantage in car production.
C) There will be gains from trade if the United States exports computers to Japan.
D) Japan has an absolute advantage in car production.
Profit computed without implicit costs is _____ profit.
A) explicit
B) accounting
C) implicit
D) economic
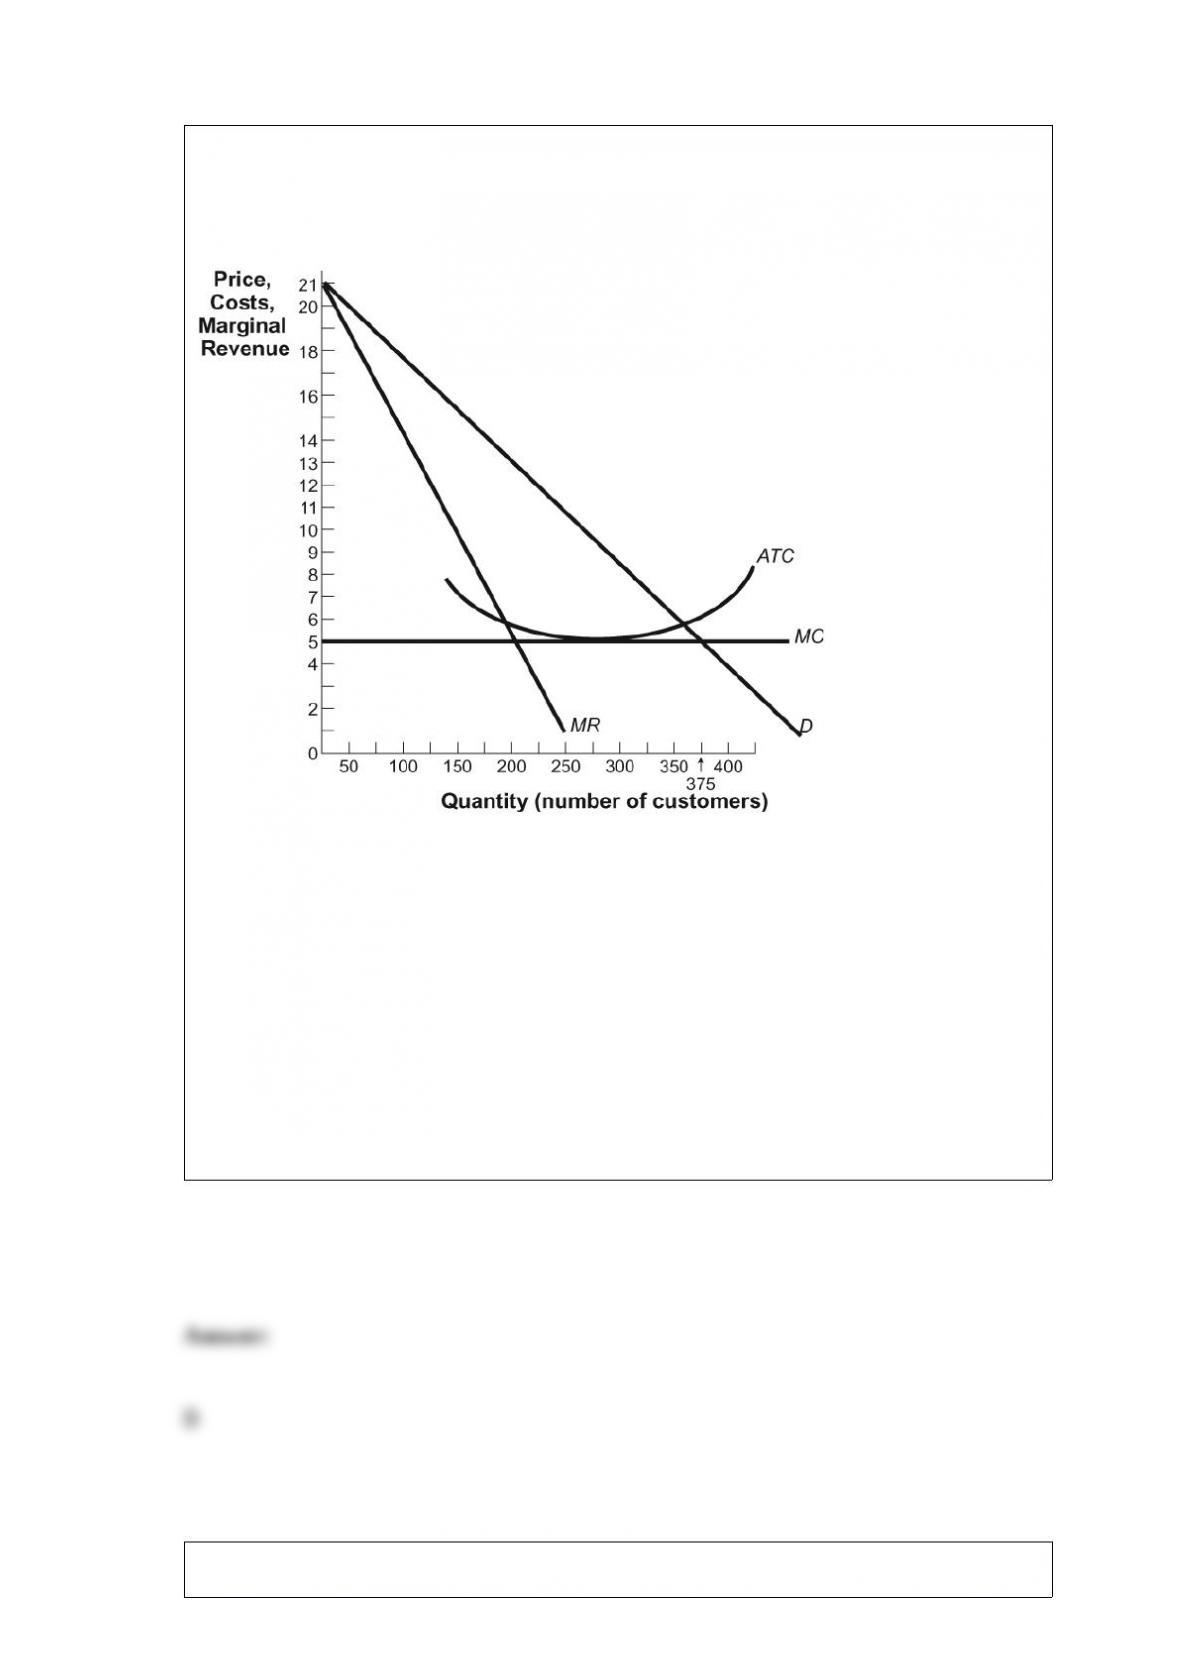
Figure: Water Works
(Figure: Water Works) Look at the figure Water Works, which describes a small town's
water works, a natural monopoly. If regulators want the monopolist to cover average
total cost, the monopolist will be allowed to charge a price of:
A) $5.
B) $6.
C) $13.
D) $21.
The short-run supply curve for a perfectly competitive firm is the ____ cost curve
above the _____ price.
A) average total; break-even
B) average variable; shut-down
C) marginal; break-even
D) marginal; shut-down
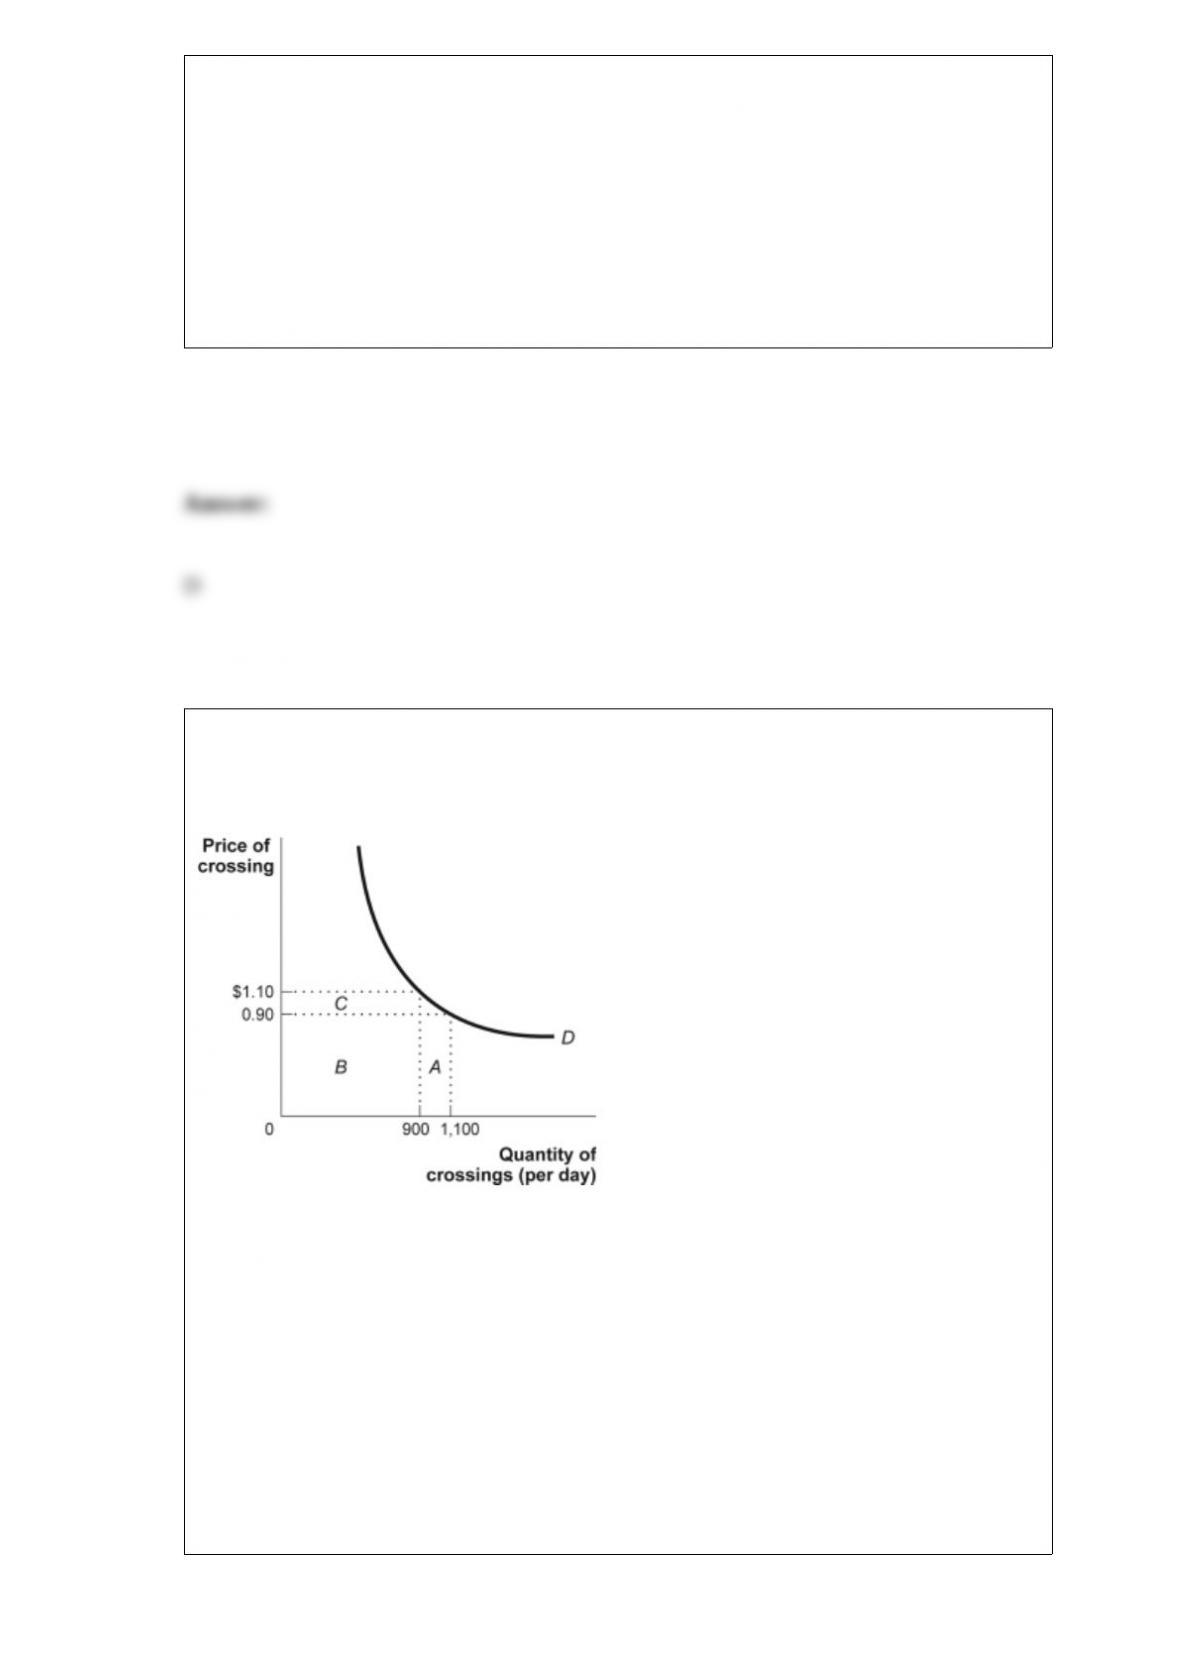
Figure: The Demand Curve for Crossings
(Figure: The Demand Curve for Bridge Crossings) Look at the figure The Demand
Curve for Bridge Crossings. Demand is price_____ between $0.90 and $1.10, since
total revenue _____ when the price _____.
A) elastic; increases; decreases
B) inelastic; stays the same; decreases
C) unit-elastic; stays the same; increases
D) inelastic; increases; increases
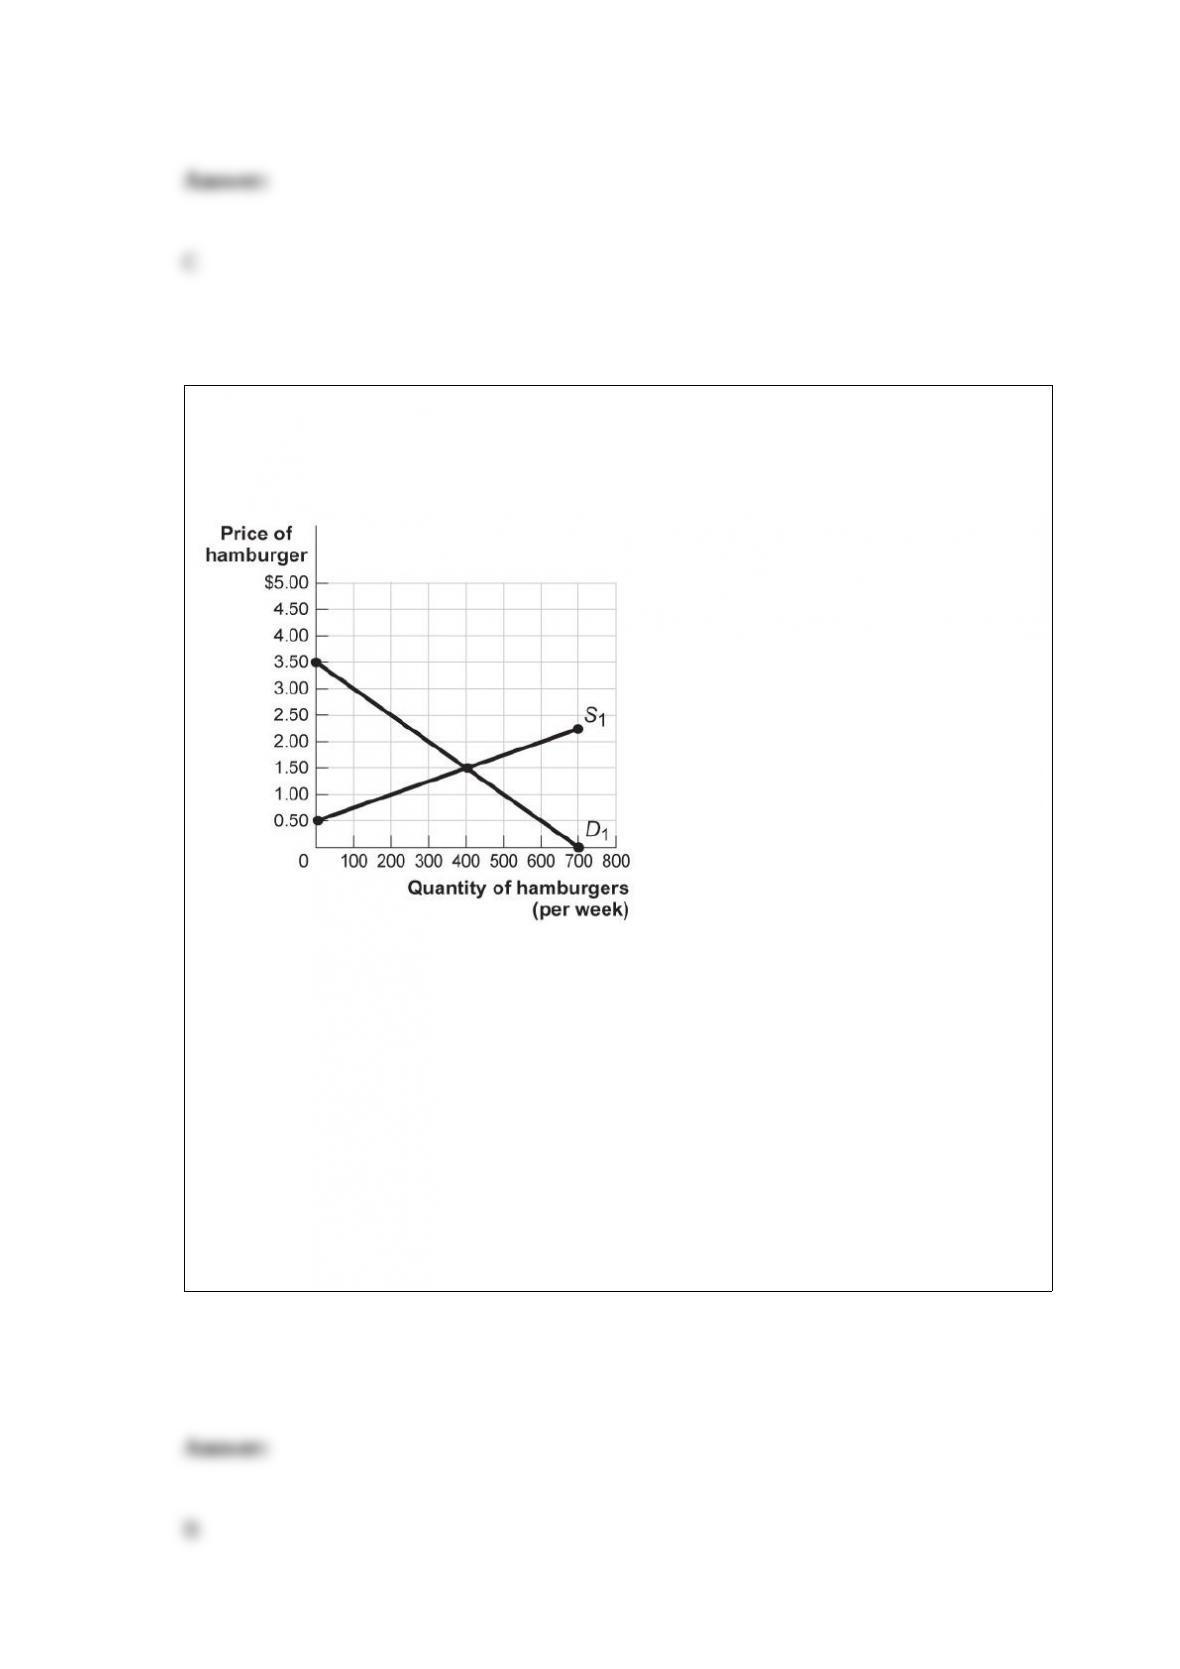
Figure: The Market for Hamburgers
(Figure: The Market for Hamburgers) The figure The Market for Hamburgers shows the
weekly market for hamburgers in Tuscaloosa. If 400 hamburgers are sold, consumer
surplus will equal:
A) $650.
B) $400.
C) $225.
D) $450.

On a production possibility frontier, opportunity cost is:
A) the decrease in the output of one good when the output of the other good is
increased.
B) the rate at which people are willing to exchange goods as determined by demand and
supply.
C) the dollar cost of the good given up to get another good.
D) independent of the slope of the curve.
A bank offers two compensation plans to its tellers. Plan A provides an hourly wage of
$12. Plan B offers $10 per hour plus additional compensation if customers sign up for a
related bank product. If a teller chooses plan B, most likely this person would:
A) be more helpful to customers than if he or she chose plan A.
B) not be thinking wisely in choosing this plan.
C) be less helpful to customers than if he or she chose plan A.
D) not alter his or her behavior.
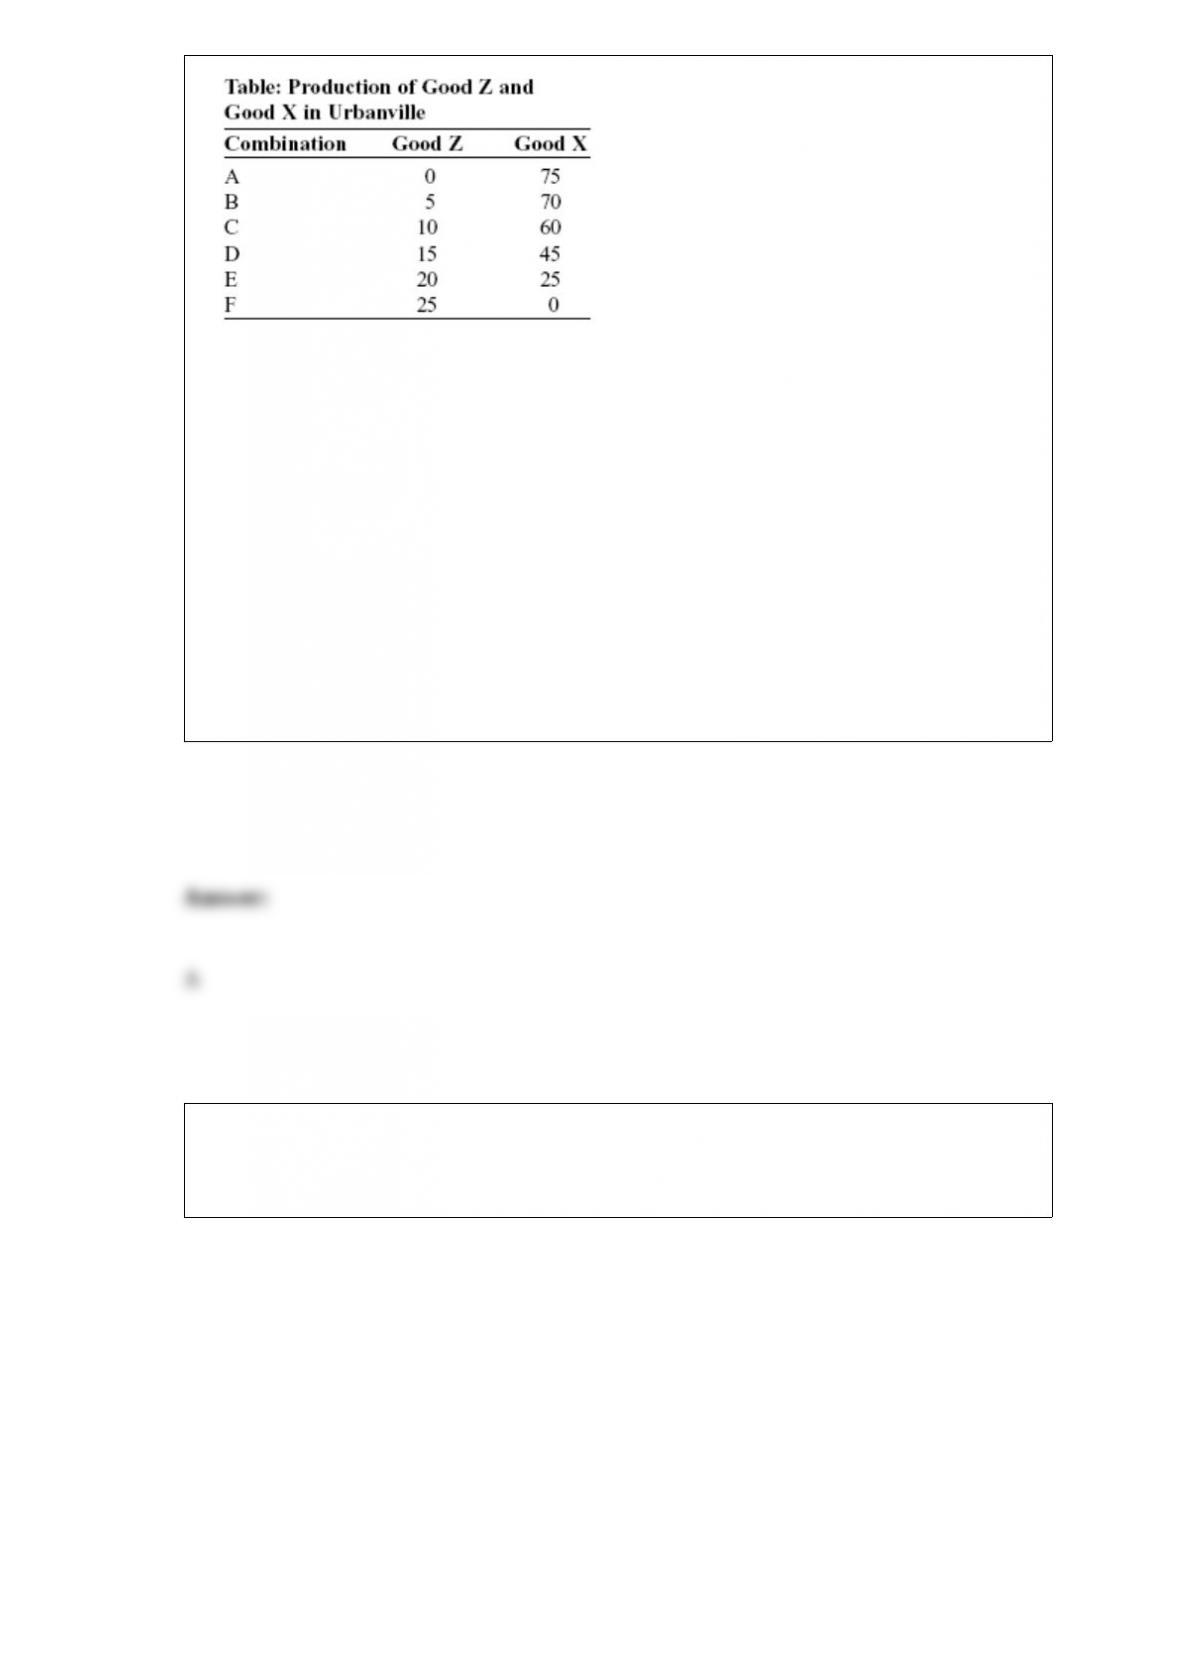
(Table: Production of Good Z and Good X in Urbanville) Look at the table Production
of Good Z and Good X in Urbanville. If this table shows the production possibility
frontier and Urbanville is producing at combination F, what is the opportunity cost of a
move to combination E?
A) 5 of Z
B) 20 of Z
C) 25 of X
D) 0 of X
Figure: Computing Monopoly Profit
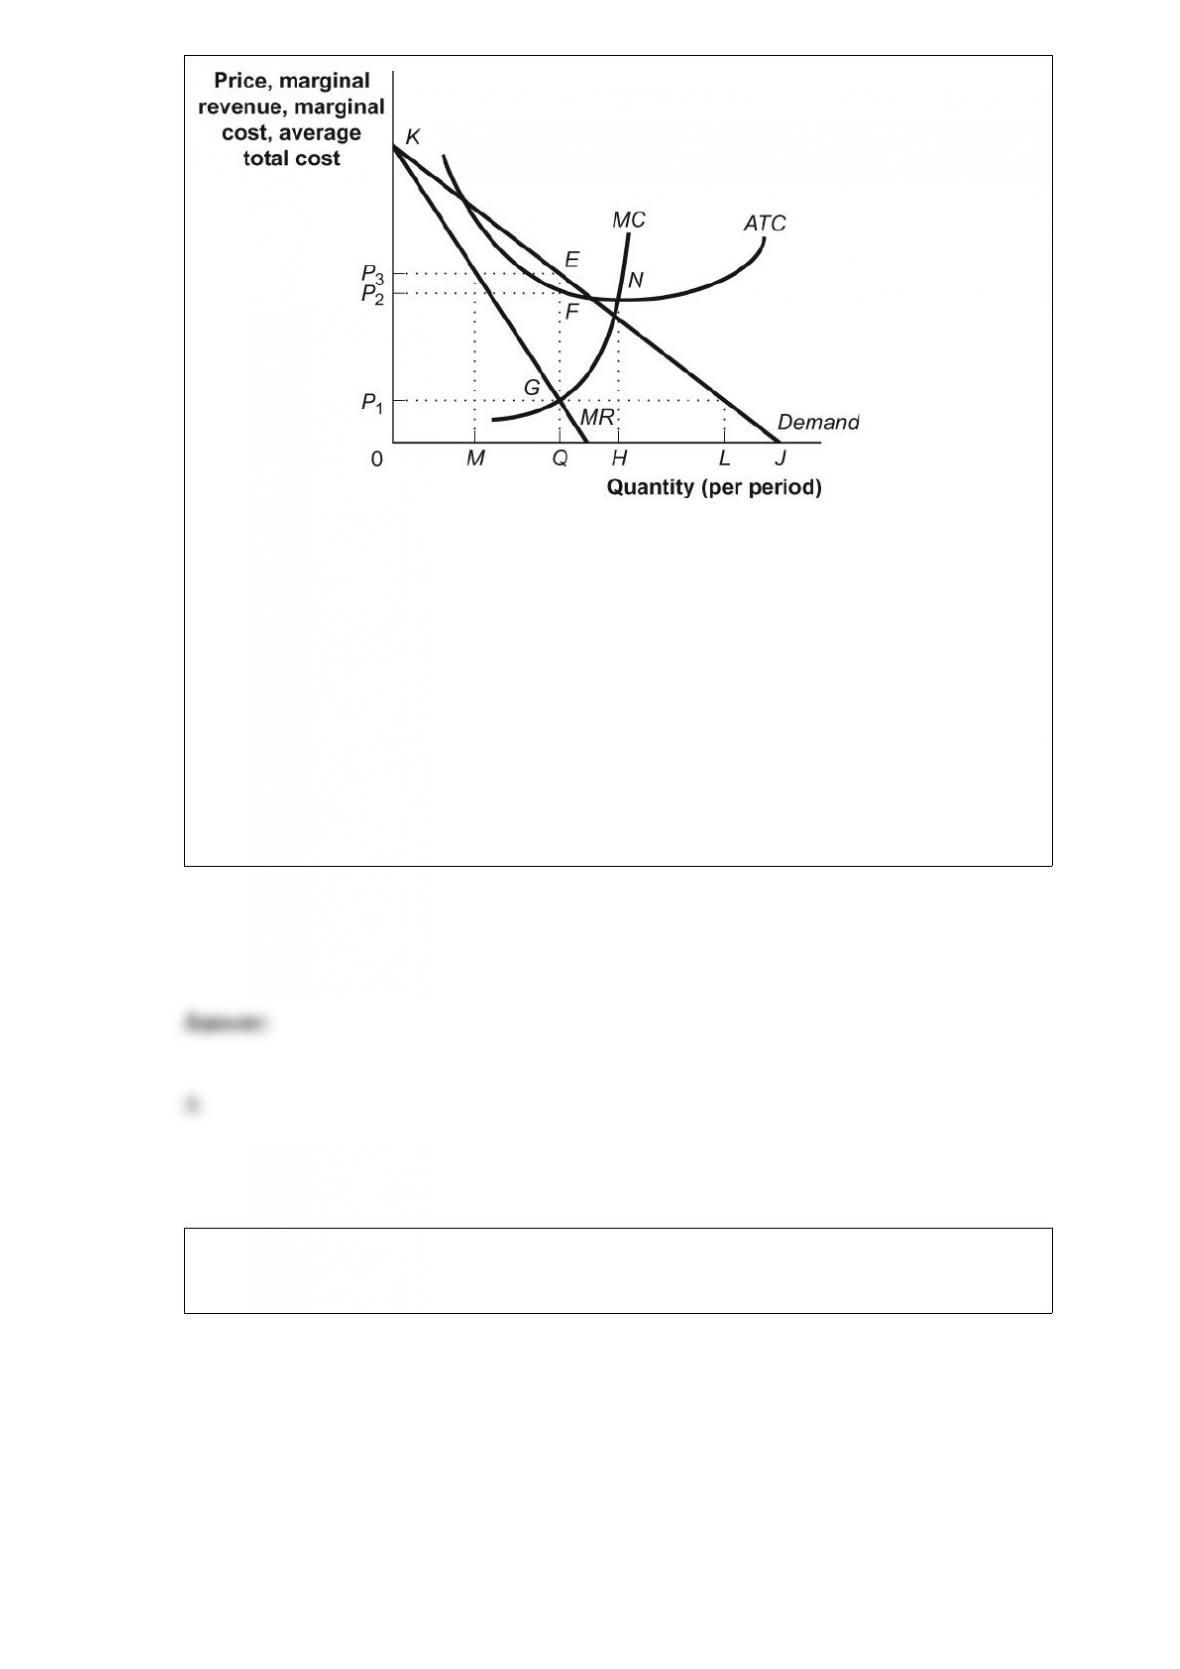
(Figure: Computing Monopoly Profit) Look at the figure Computing Monopoly Profit.
To obtain maximum profits, the monopoly should produce the output determined by
point:
A) G.
B) N.
C) H.
D) K.
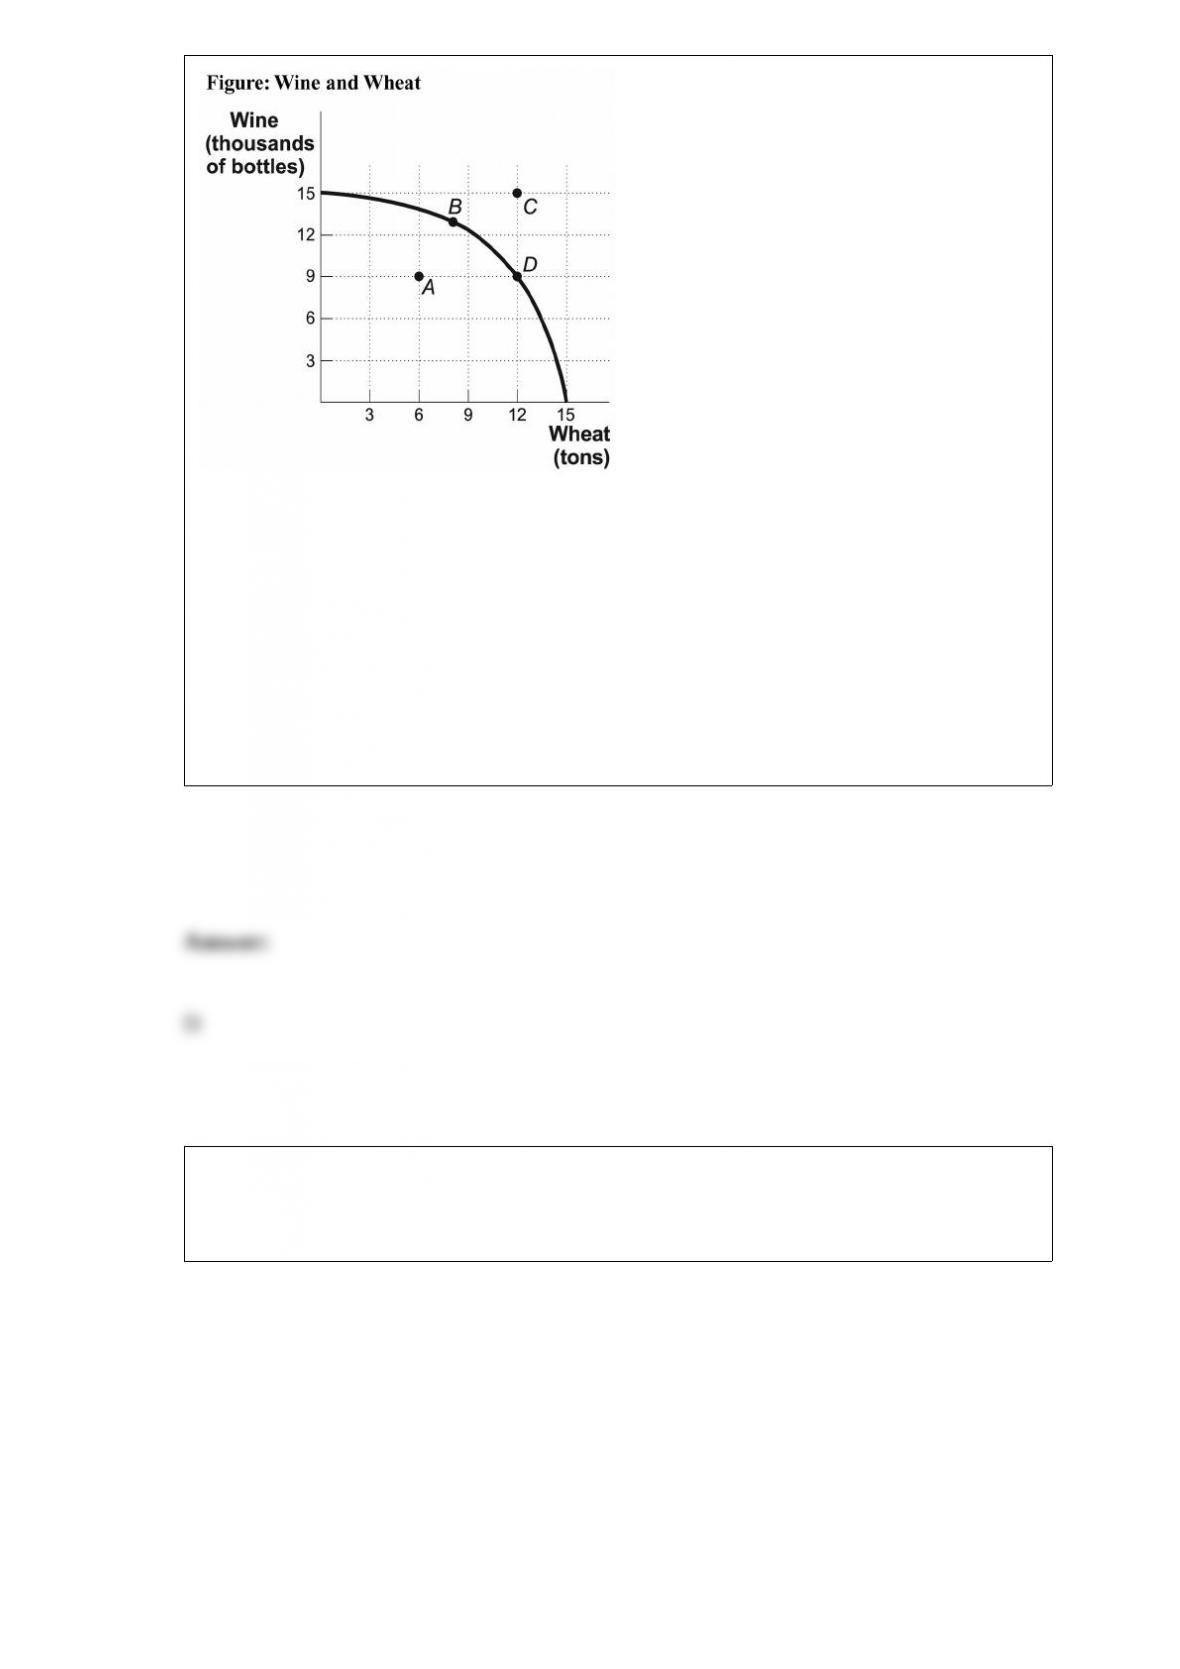
(Figure: Wine and Wheat) Look at the
figure Wine and Wheat. The opportunity cost of moving from producing ONLY wheat
to producing ONLY wine is _____ tons of wheat.
A) 3
B) 6
C) 9
D) 15
Figure: The Optimal Consumption Bundle
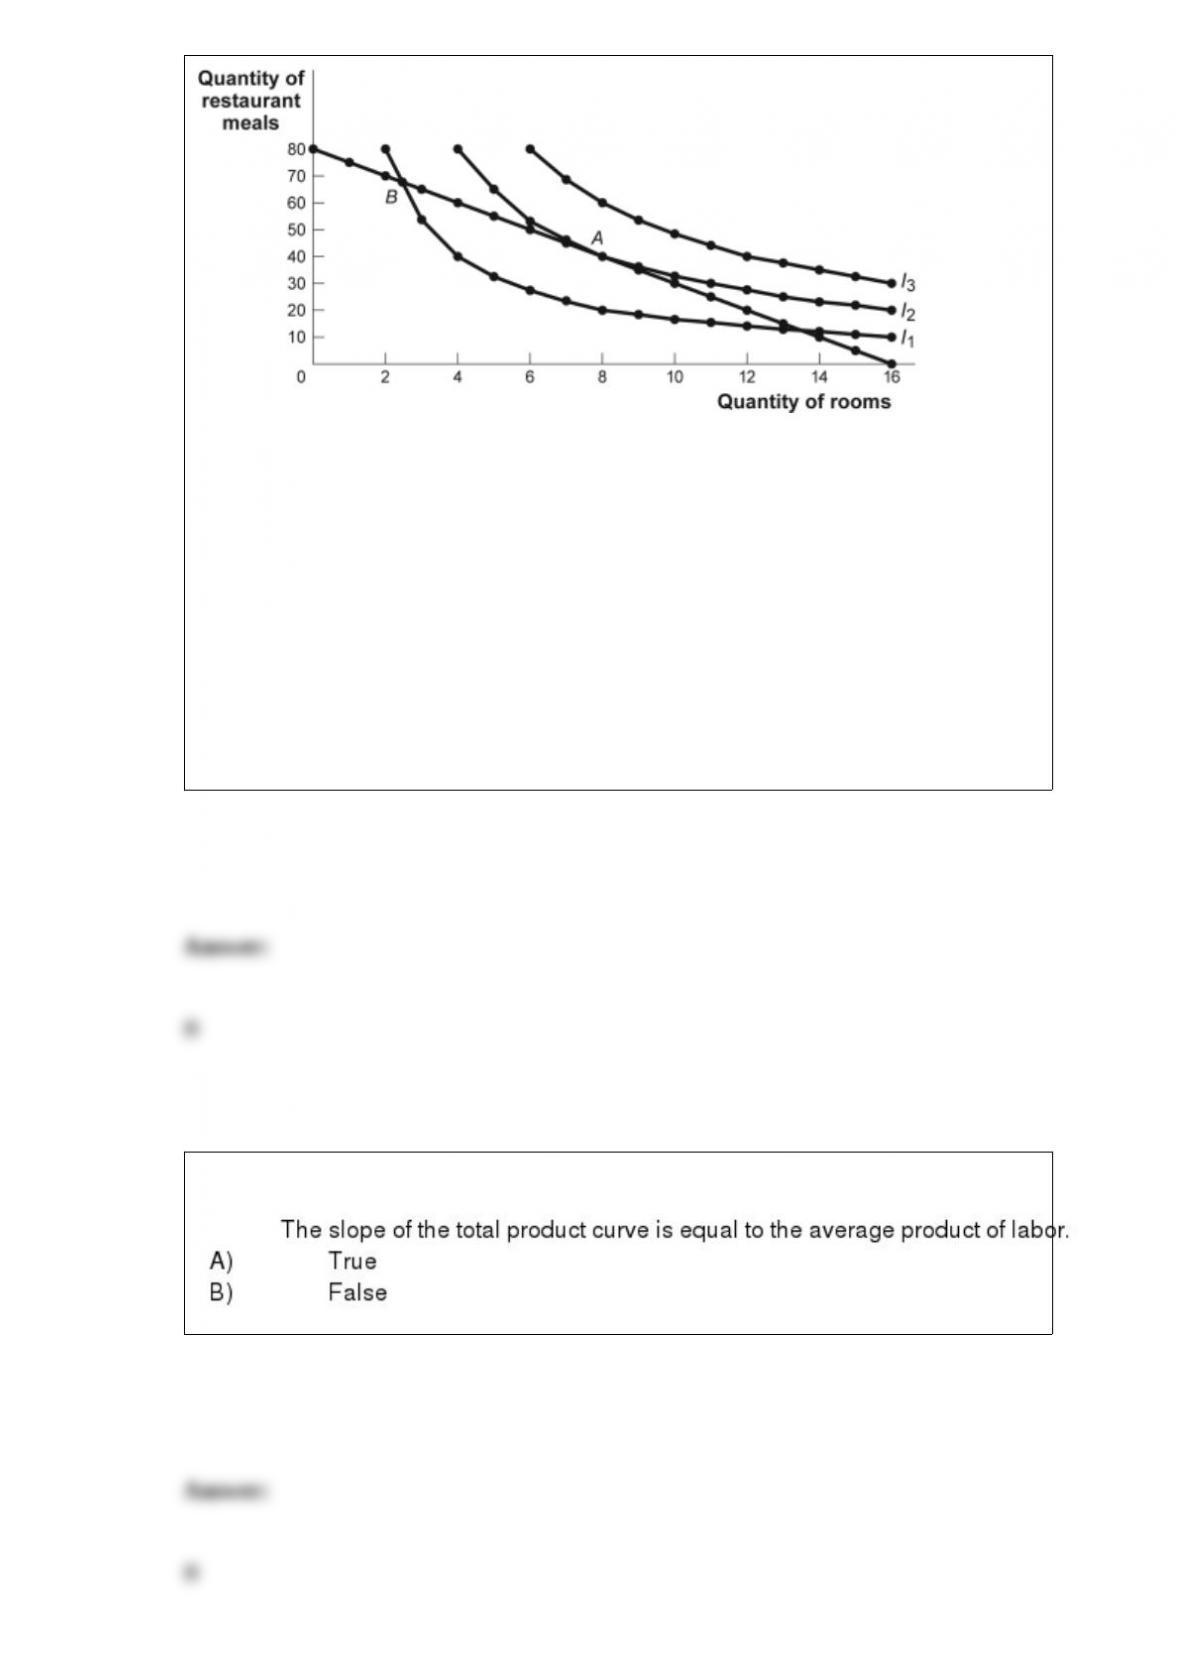
(Figure: The Optimal Consumption Bundle) Look at the figure The Optimal
Consumption Bundle. Which of the following could lead to an optimal consumption
bundle on indifference curve I3?
A) a decrease in income
B) a decrease in the price of restaurant meals
C) an increase in the price of rooms
D) an increase in the price of restaurant meals
An analysis of the effect of excise taxes on markets allows us to conclude that:
A) when the price elasticity of supply is equal to zero, an excise tax falls entirely on the
consumers.
B) when the price elasticity of demand is lower than the price elasticity of supply, an
excise tax falls mainly on the producers.
C) whether the tax is levied on consumers or producers, the quantity sold will be the
same.

D) when the price elasticity of demand is higher than the price elasticity of supply, an
excise tax falls mainly on the consumers.
Which of the following is NOT an example of price discrimination?
A) Students receive a discount at the ice cream store when they show their college ID
cards.
B) Women receive free admission to a nightclub, while men must pay a cover charge.
C) A country club requires members to pay annual dues, but members receive
discounted prices to golf.
D) Street vendors increase the price of umbrellas when it is raining.
A university that benefits from lower costs per enrolled student as it builds more
buildings and enrolls more students is an example of a service provider with:
A) economies of scale.
B) diseconomies of scale.
C) increasing opportunity costs.
D) scale reduction.

The slope of a budget line for a consumer buying two goods is equal to the _____ of the
price of the good on the _____ axis divided by the price of the good on the _____ axis.
A) positive; vertical; horizontal
B) negative; horizontal; vertical
C) positive; horizontal; vertical
D) negative; vertical; horizontal
In many cities you can stay at a Holiday Inn in the downtown area, in a suburban
community, or near the airport. These Holiday Inn establishments are examples of
product differentiation by:
A) type.
B) location.
C) quality.
D) style.


