
1)
Refer to the above graph. It shows the cost curves for a competitive firm. If the market
price of the product is $1.05 per unit, then the firm will produce how many units in the
short run?
A.Between 0 and 15
B.Between 15 and 20
C.Between 20 and 35
D.Above 35
2) Use your basic knowledge and your understanding of market structures to answer
this question. Which of the following companies most closely approximates a
differentiated oligopolist in a highly concentrated industry?
A.Subway Sandwiches.
B.Pittsburgh Plate Glass.
C.Ford Motor Company.
D.Kaiser Aluminum.
3) A nation can produce two products: steel and wheat. The table below is the nation’s
production possibilities schedule:
Refer to the above table. The marginal opportunity cost of the third unit of steel is:
A.18.3 units of wheat
B.25 units of wheat
C.20 units of wheat
D.55 units of wheat
4)
Refer to the budget line shown in the diagram. The absolute value of the slope of the
budget line is:
A.MUC/MUD.

B.one-half.
C.PD/PC.
D.PC/PD.
5) For the firm, the major goal of profit sharing plans is to:
A.force workers to incur some of the business risk.
B.overcome the monopsony problem of having to pay higher wages to attract additional
workers.
C.overcome the principal-agent problem by better aligning the workers’ interests with
those of the firm.
D.reduce total compensation payments.
6)
Refer to the diagram. Which line(s) show(s) a positive relationship between x and y?
A.A only.
B.A and D only.
C.A, B, and D.
D.Both C and E.
7) If we are considering the relationship between two variables and release one of the
other-things-equal assumptions, we would expect:
A.the relationship to change from direct to inverse.
B.the line representing that relationship on a graph to shift.
C.the data points to have a tighter fit to the line representing the relationship.
D.the relationship to change from inverse to direct.
8)
Refer to the diagrams. The solid lines are production possibilities curves; the dashed

lines are trading possibilities curves. The trading possibilities curves suggest that the
terms of trade are:
A.1.5 beers for 1 pizza.
B.1 beer for 2 pizzas.
C.2 beers for 1 pizza.
D.1 beer for 1.5 pizzas.
9)
Refer to the diagram. The per unit costs at output level Q that are both attainable and
imply the least-cost production for this level of output:
A.are A
B.are B
C.are C
D.cannot be determined with the information given.
10) Suppose a single firm has the marginal revenue product schedule for a particular
type of labor given in the left table. Assume there are 150 firms with the same
marginal-revenue-product schedules for this particular type of labor.
Refer to the above table and information. How would the imposition of a $9 minimum
wage rate change the total amount of labor hired in this market?
A.Employment would decrease by 150 to 600 workers total
B.Employment would increase by 150 to 750 workers total
C.Employment would decrease by 150 to 750 workers total
D.Employment would increase by 150 to 900 workers total
11) A purely competitive firm is currently in short-run equilibrium and its MC exceeds
its ATC at its current output level. It can be concluded that:
A.Firms will leave the industry in the long run
B.The firm is realizing an economic profit
C.The firm is suffering a loss
D.The firm will shut down in the short run
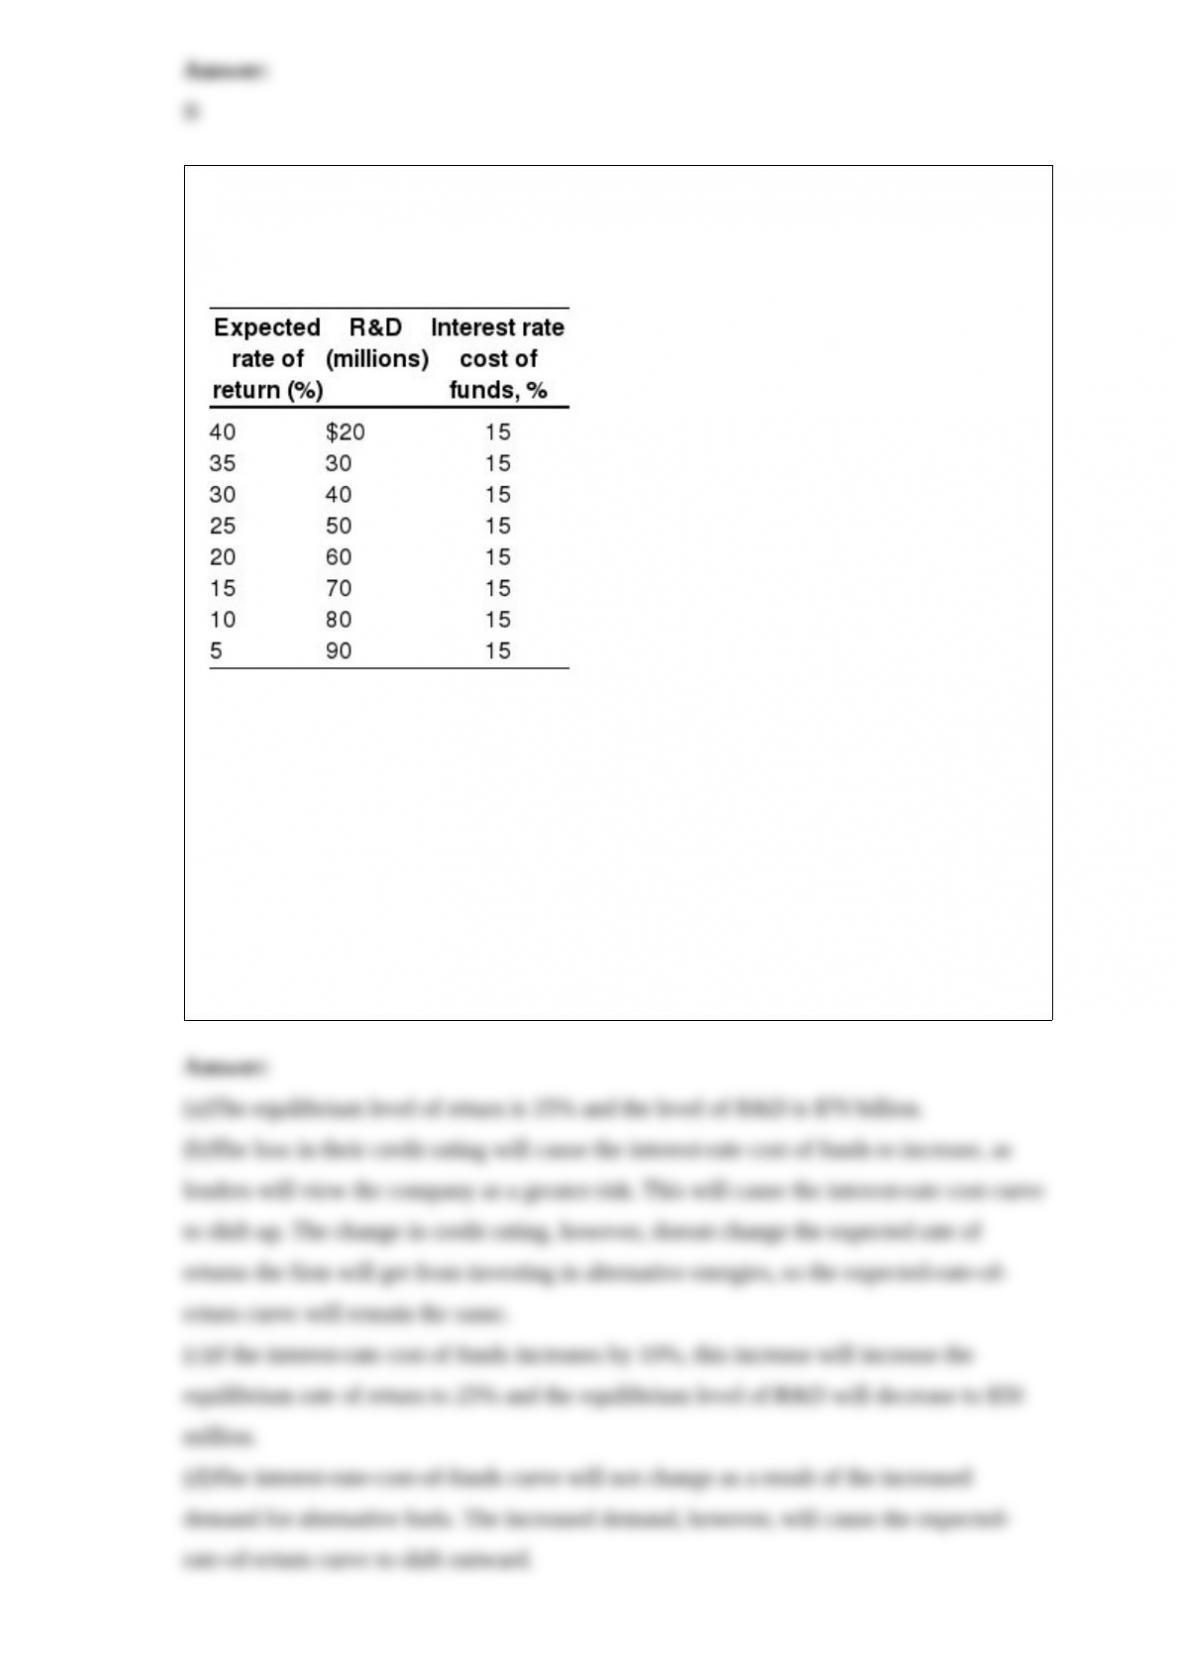
12) The initial values for expected returns, R&D and interest-rate cost for an energy
companys investment in developing alternative fuels are listed in the table below. Using
this information, answer the following questions.
(a)What is the equilibrium level of return and R&D?
(b)Suppose that the energy companys credit rating plummets after it is exposed for
using unethical accounting practices. How will this affect the expected-rate-of-return
curve and interest-rate cost of funds?
(c)Suppose the interest-rate cost of funds curve shifts upward by 10%. What will be the
new equilibrium rate of return and level of R & D investment?
(d)Suppose that the increased cost of oil has increased the demand for alternative fuels.
How will this affect the interest-rate cost of funds and expected return curves?
(e)Suppose the expected-rate-of-return curve shifts outward by 10%. What will be the
new equilibrium level of R&D and expected rate of return? (Assume the interest-rate
cost of funds is 15%.)

13)
Refer to the diagram. If all monopolistically competitive firms in the industry have
profit circumstances similar to the firm shown above:
A.new firms will enter the industry.
B.some firms will exit the industry.
C.all firms will exit the industry.
D.no firms will enter the industry.