Which of the following correctly lists the three fundamental economic questions?
a. If to produce? Why to produce? When to produce?
b. If to produce? What to produce? How to produce?
c. Why to produce? What to produce? How to produce?
d. What to produce? How to produce? For whom to produce?
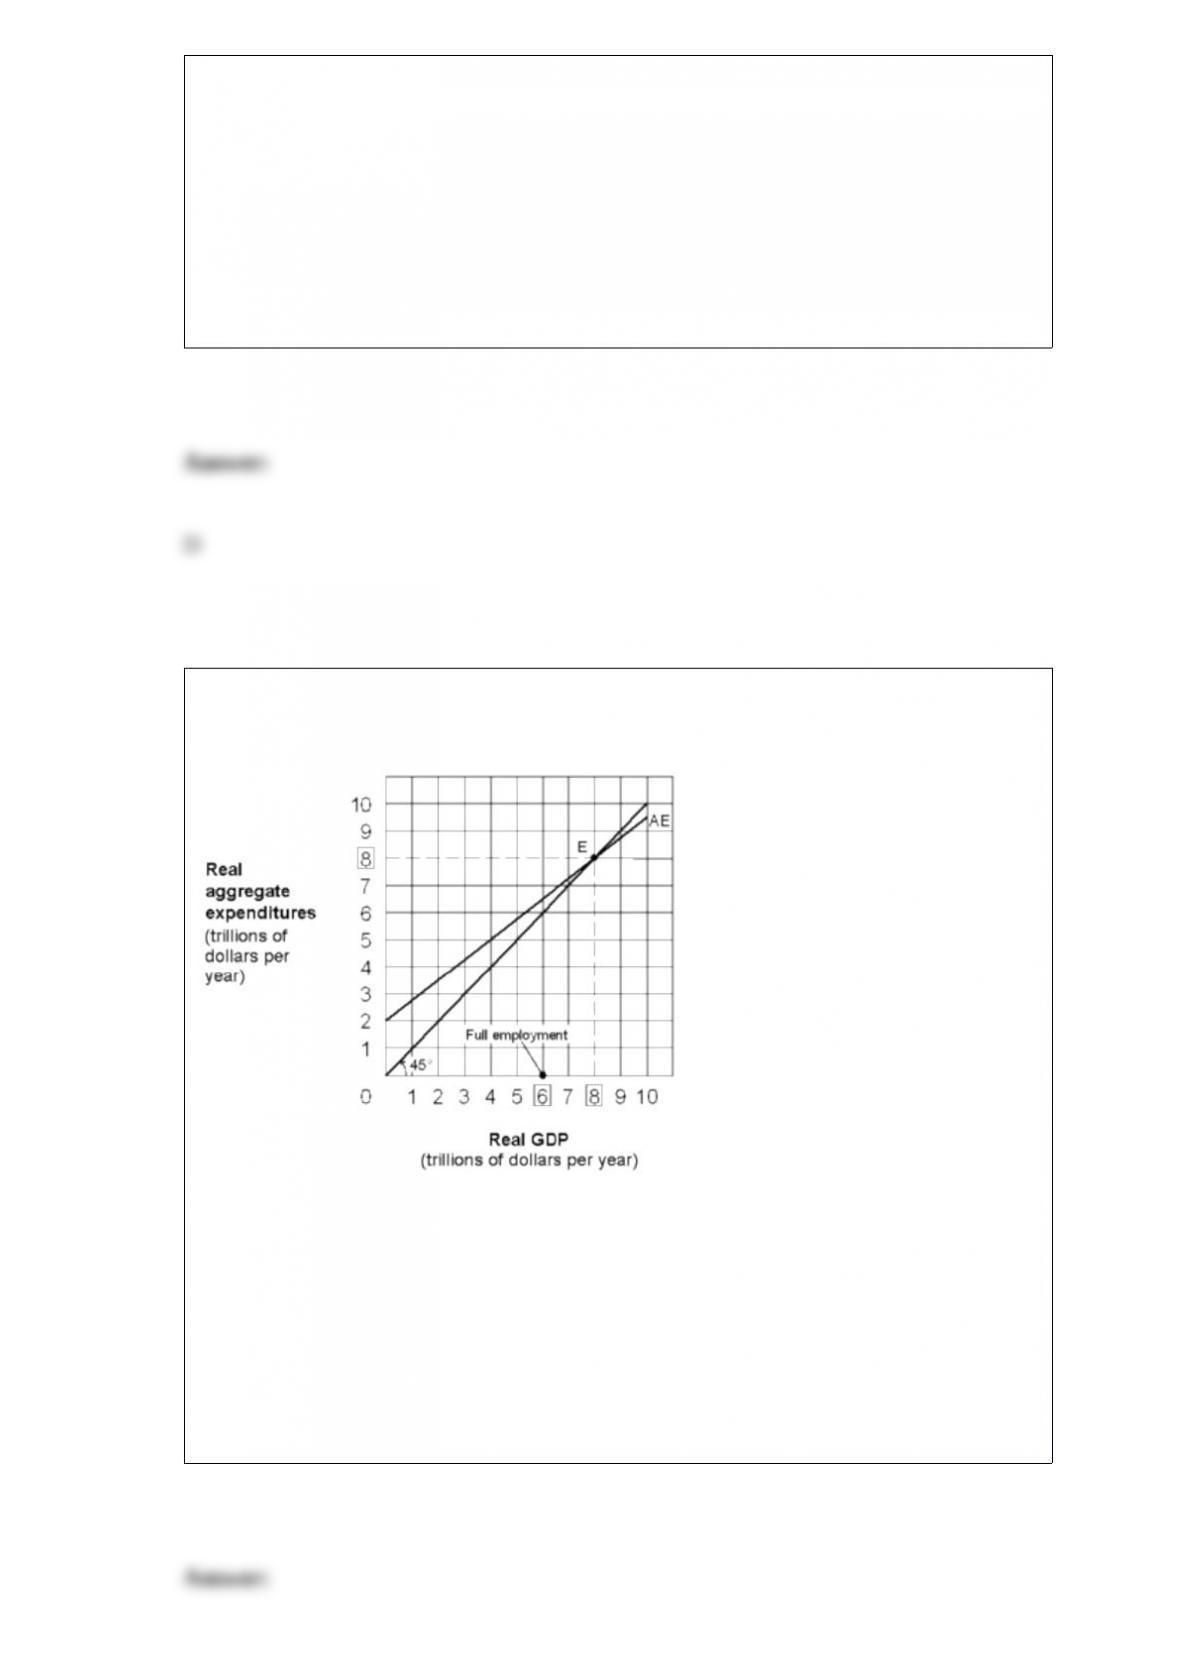
Exhibit 9-5 Keynesian aggregate-expenditures model where the MPC is 0.75
The economy shown in Exhibit 9-5
is:
a. in a recessionary gap.
b. in an inflationary gap.
c. fully employed.
d. substantially underemployed.
Assume that you have received copies of the financial statements for PepsiCo for the
years ending December 31, 2014 and 2013. Answer the following questions: A) If you
were a banker, why would you need information from PepsiCo’s financial statements?
B) If you were a potential investor in PepsiCo stock, what information would you want
from their financial statements? C) If you were a labor negotiator for a union that
represents a group of PepsiCo’s employees, which financial statement would provide
you with the most useful information?
The transactions demand for money is the demand for money by households for:
a. rainy day spending.
b. predictable spending purposes.
c. liquidity purposes.
d. investing purposes.

An upward-sloping line or curve is used to illustrate:
a. a direct relationship.
b. an inverse relationship.
c. two unrelated variables.
d. the ceteris paribus assumption.
Which of the following would lead to an increase in the demand for computer software?
a. A decrease in the price of computer software.
b. A decrease in the price of personal computers.
c. An decrease in the cost of producing computer software.
d. An decrease in personal income.
Exhibit 9-2 Keynesian aggregate-expenditures model
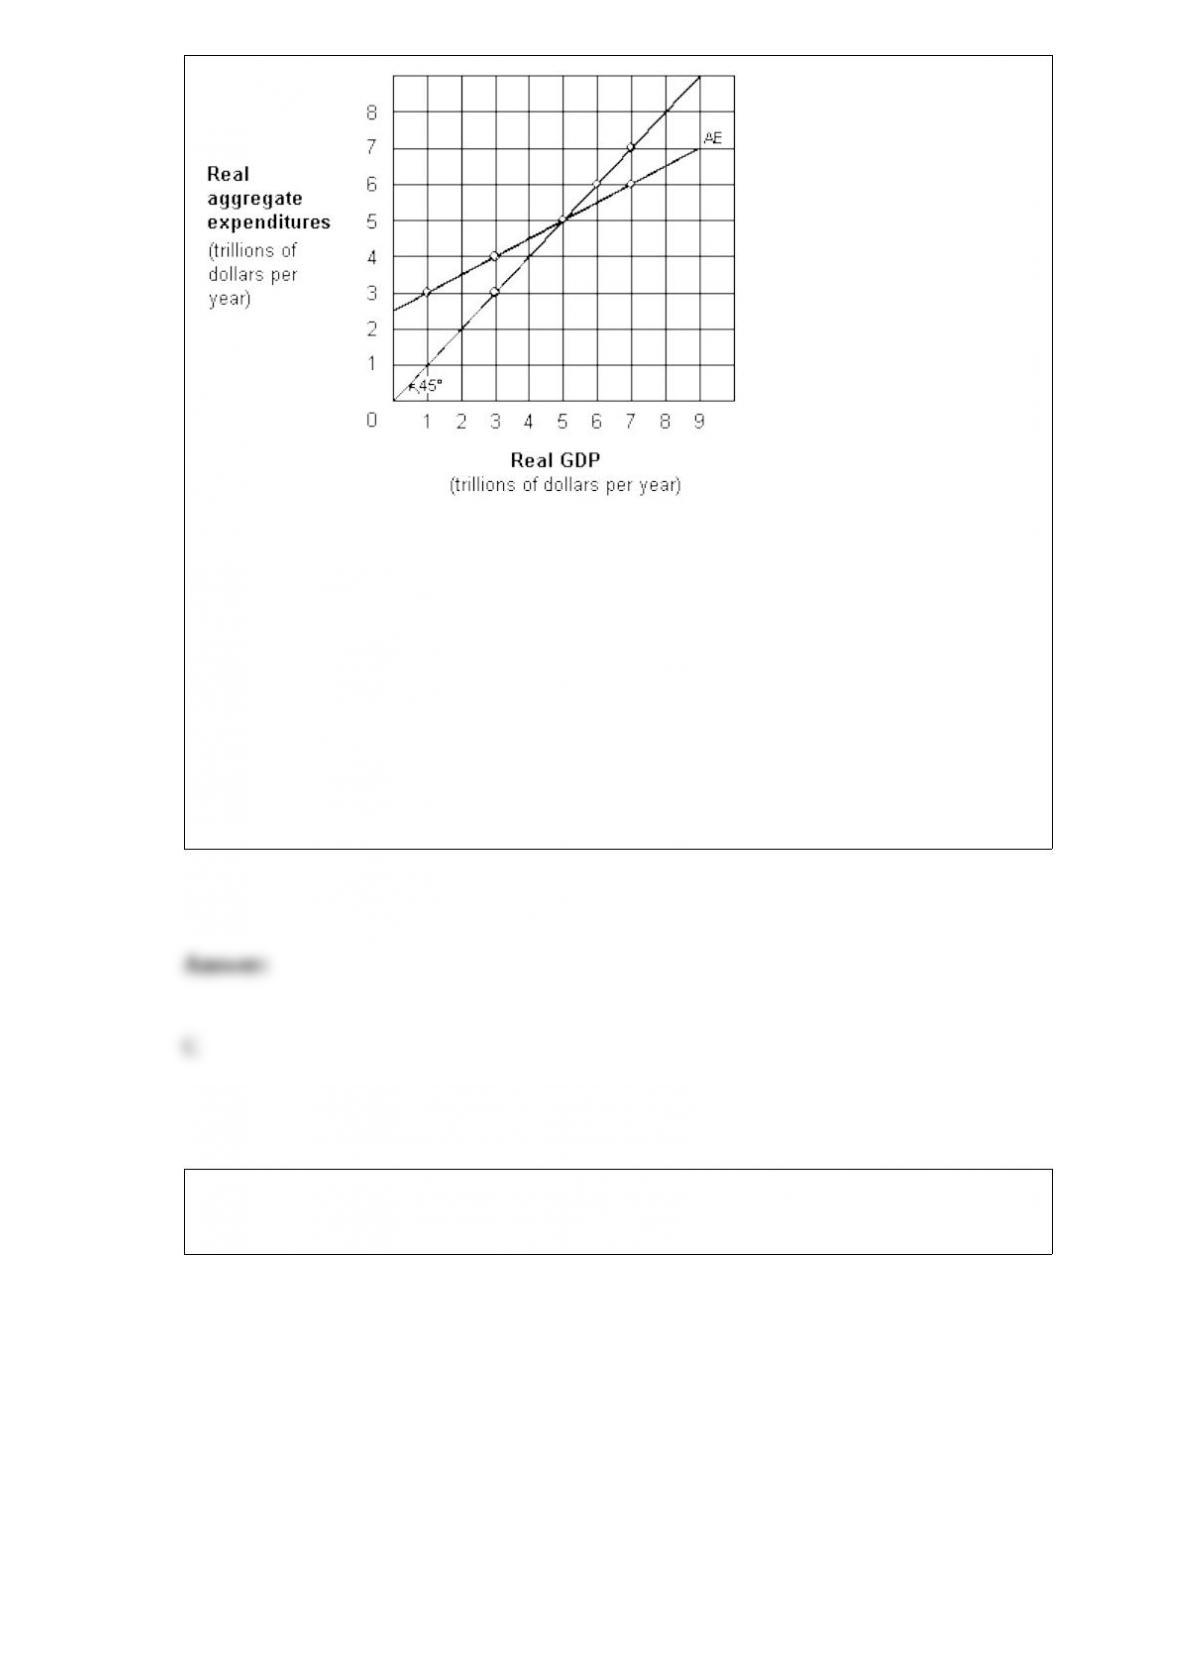
As shown in Exhibit 9-2,
equilibrium GDP is:
a. $1 trillion.
b. $3 trillion.
c. $5 trillion.
d. $6 trillion.
e. $7 trillion.
Exhibit 9-5 Keynesian aggregate-expenditures model where the MPC is 0.75
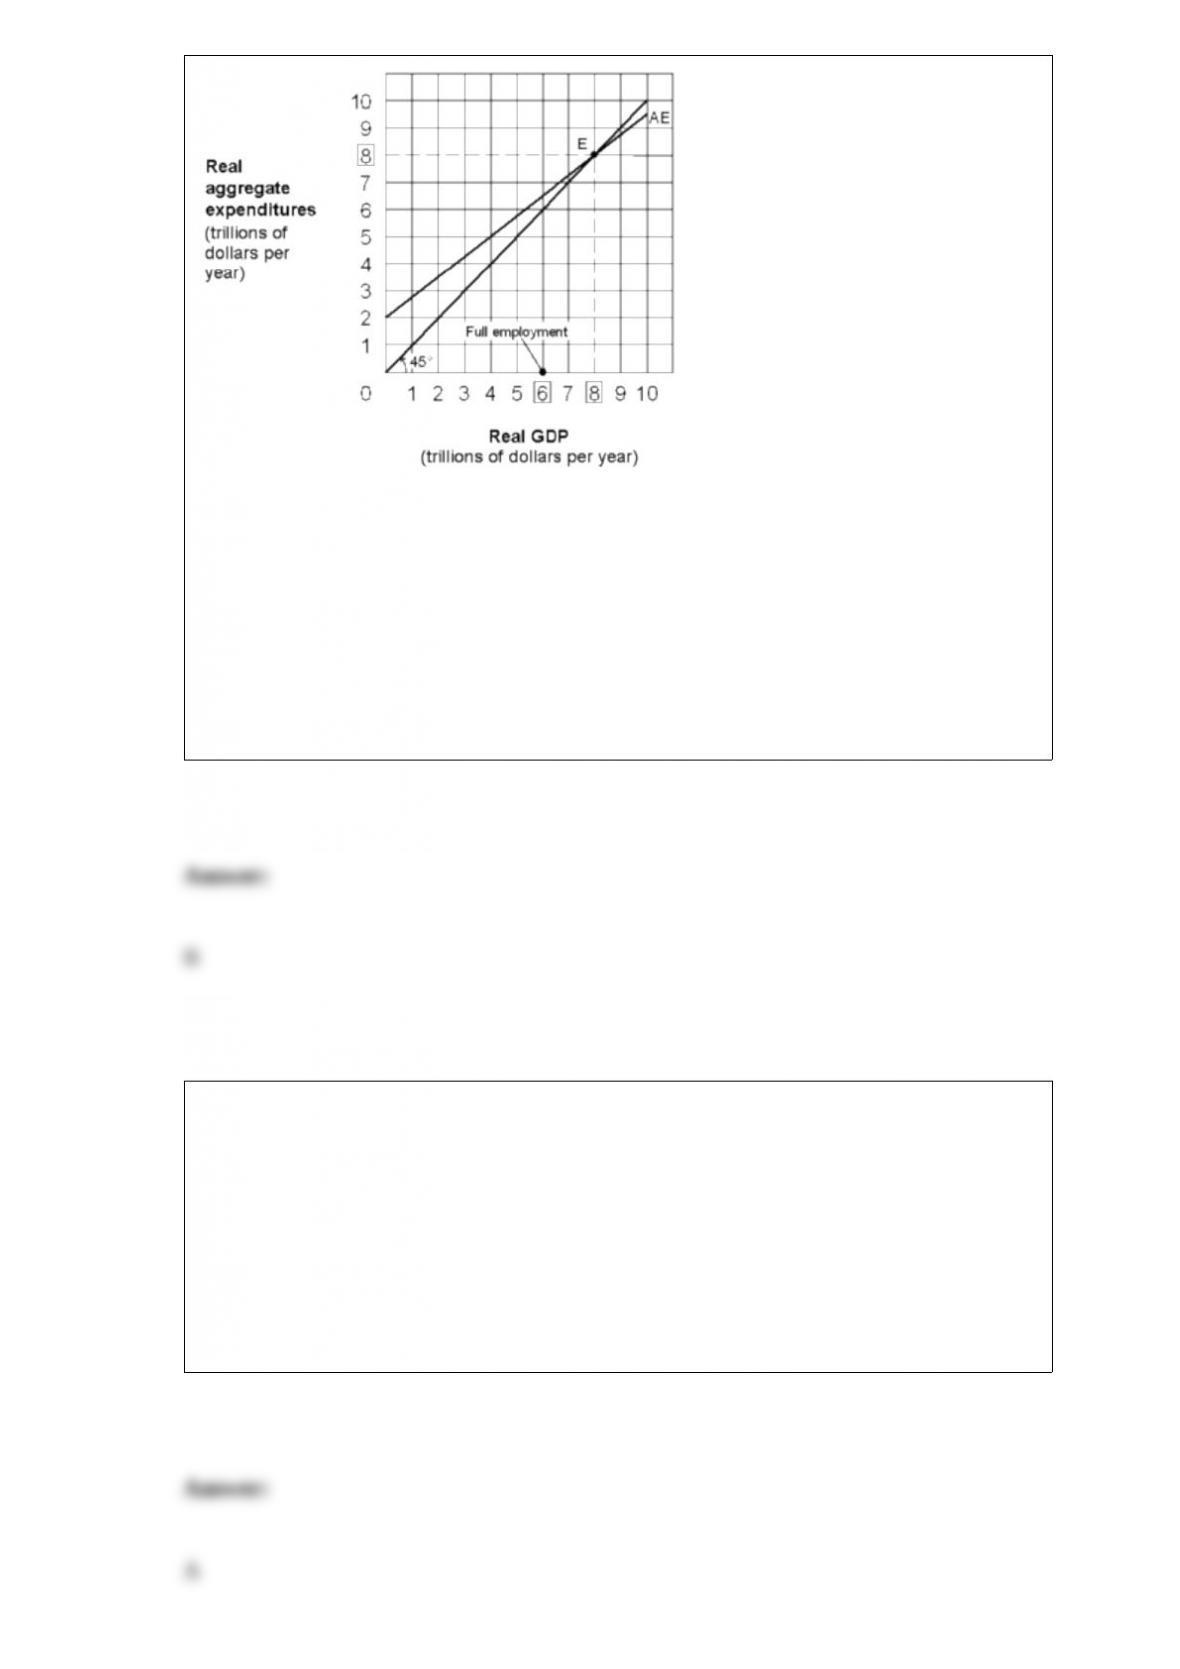
In Exhibit 9-5, the spending
multiplier for this economy is equal to:
a. 1.33.
b. 4.
c. 7.5.
d. 8.
In the quantity theory of money:
a. the price level is a function of the supply of money.
b. the supply of money is a function of the price level.
c. the money supply and the price level are inversely related.
d. the money supply is controlled by the government.
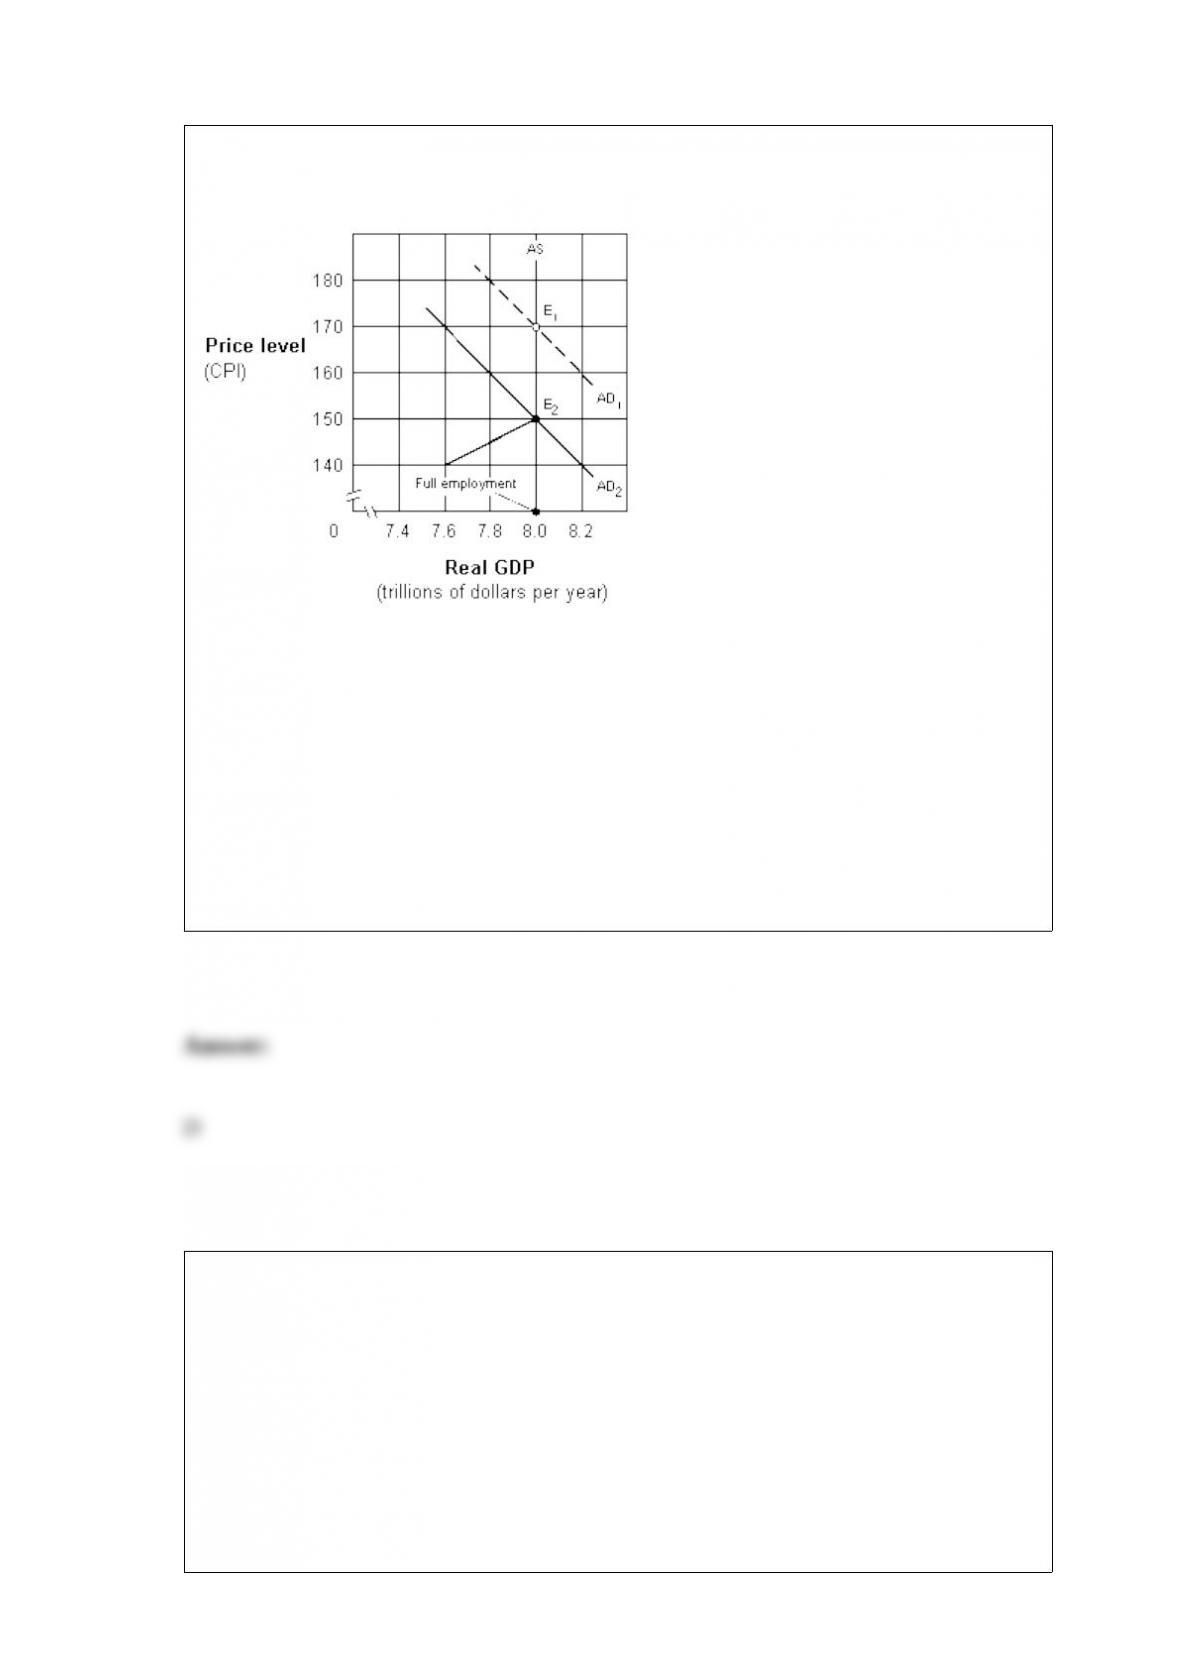
Exhibit 11-7 Aggregate demand and supply model
Beginning at equilibrium E1 in Exhibit
11-7, assume the marginal propensity to consume (MPC) is 0.90 and the government
increases taxes by $100 billion. The aggregate demand curve will shift to the:
a. left by $1,000 billion.
b. right by $1,000 billion.
c. right by $900 billion.
d. left by $900 billion.
If people behave according to rational expectations theory, people would expect the rate
of inflation this year to be:
a. the same as last year.
b. zero, regardless of the rate last year.
c. the rate based on predictable monetary and fiscal policies.
d. All of these.

The French economist Jean-Baptiste Say transformed the equality of total output and
total spending into a law that can be expressed as follows:
a. Unemployment is not possible in the short run.
b. Demand and supply are never equal.
c. Supply creates its own demand.
d. Demand creates its own supply.
A graph can be used to illustrate the relationship between the price of compact discs and
the quantity of compact discs demanded. If there is evidence that buyers’ income also
influences the demand for compact discs, then a movement along the curve can be
caused by a change in the price of compact discs.
Campaign speeches normally include normative economic statements.

Part-time workers who want full-time work are counted as only partially employed in
the official unemployment statistic.
Presented below are condensed data from the financial statements of Gallo Factory for
2015 and 2014. The figures are expressed in thousands. Use this information to answer
the questions that follow.
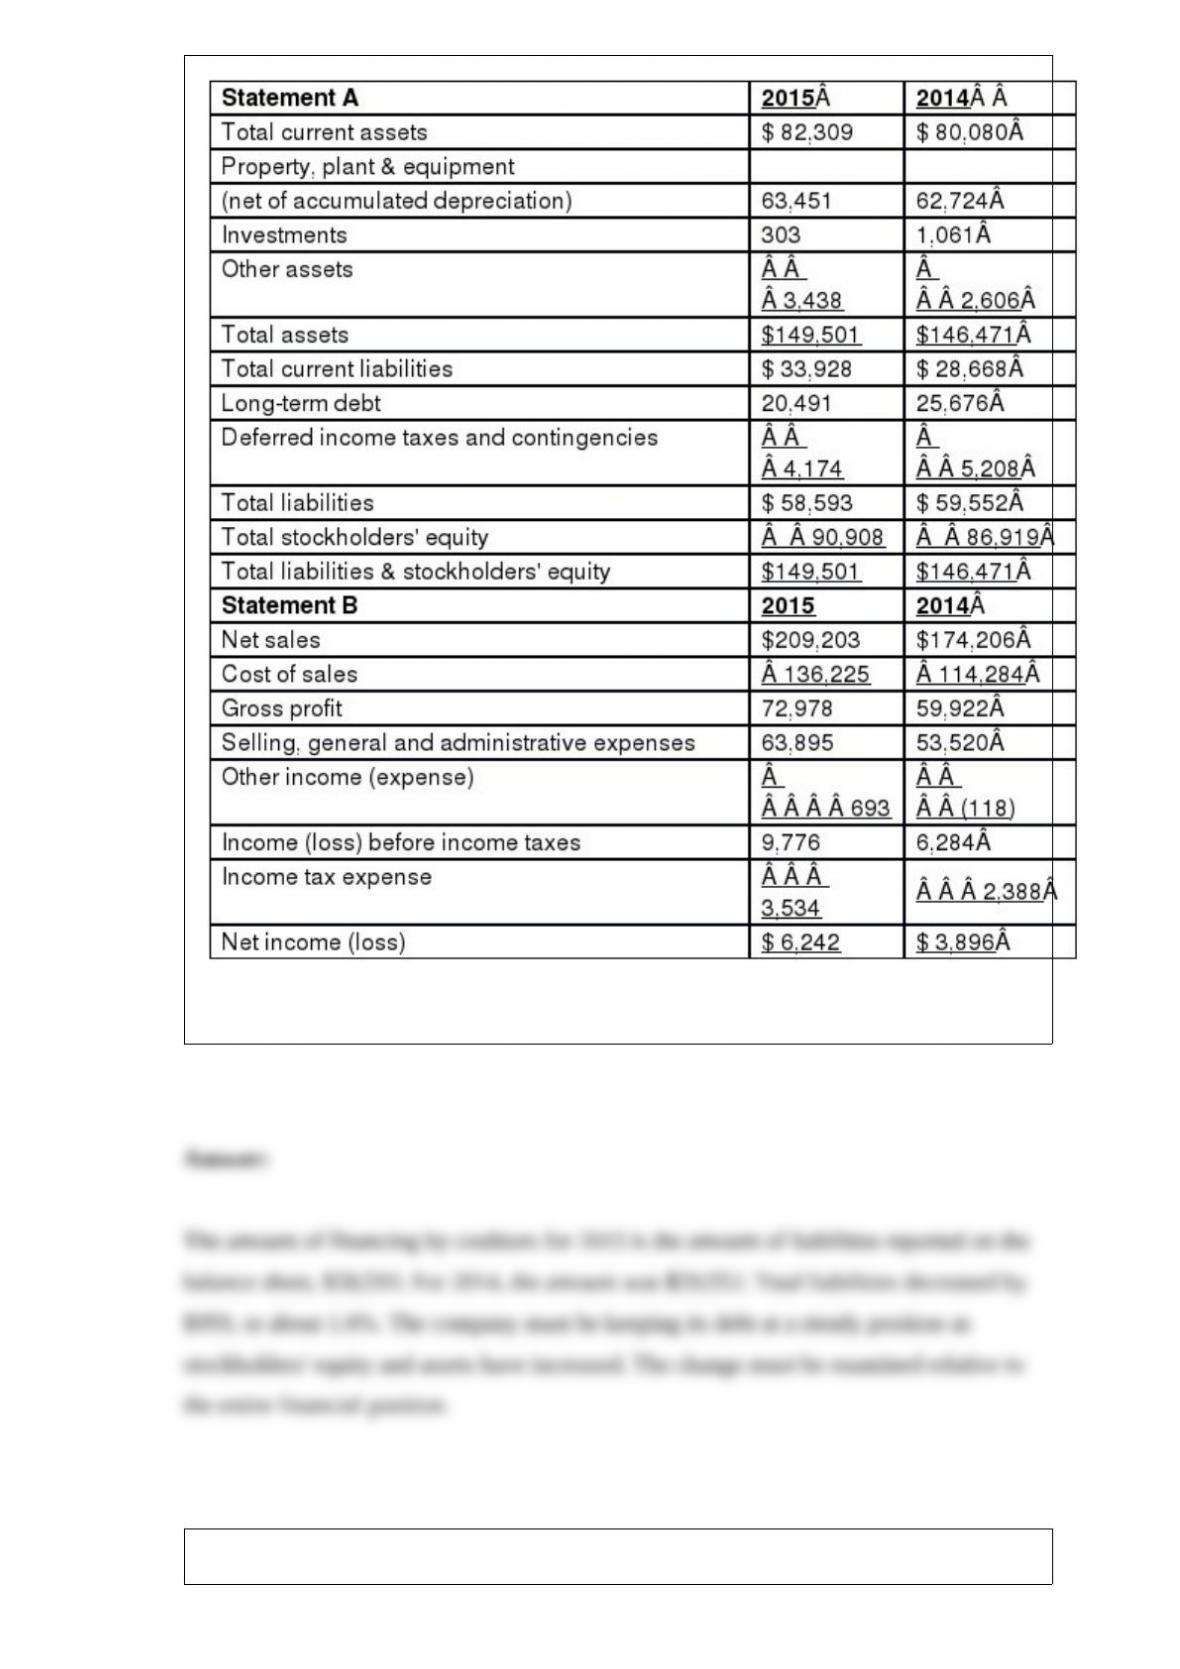
Required: How much of Gallo Factory is financed by creditors at the end of December
of 2015? Evaluate the change from 2014 to 2015.
Economists believe that political instability can facilitate economic development in an

LDC by making its citizens more open to change and new technology.
Money is said to be liquid because it is immediately available to spend for goods.