
Unwritten or unspoken understandings through which firms restrict competition are
called:
A) cartel agreements.
B) oligopoly agreements.
C) overt collusion.
D) tacit collusion.
If the government imposes binding rent control:
A) rent will be set above the equilibrium price.
B) it may result in some landlords leaving the business because they cannot cover costs.
C) it will lead to rental units being higher in quality because landlords are guaranteed a
high price.
D) it will cause a surplus of housing.
Figure: Prices, Cost Curves, and Profits
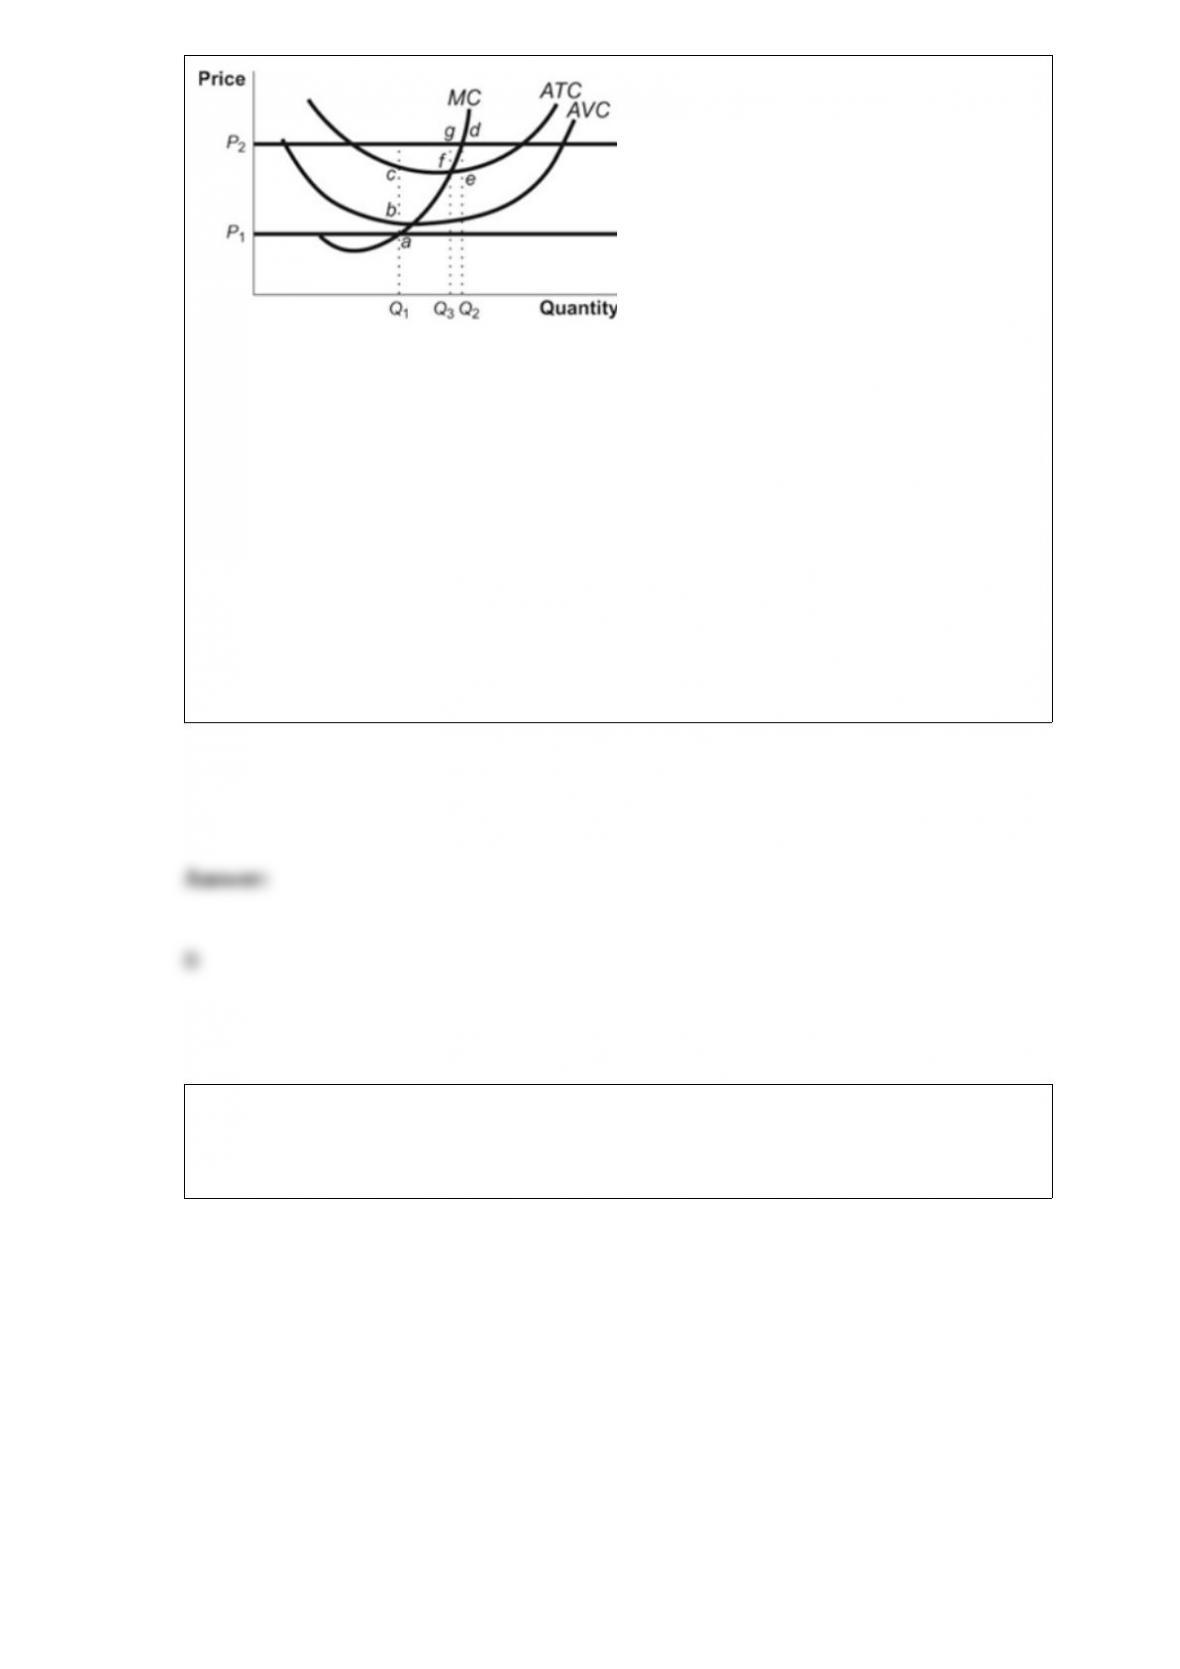
(Figure: Prices, Cost Curves, and Profits) Look at the figure Prices, Cost Curves, and
Profits. If the price is P1 and the firm decides to produce at output Q1, then the firm
earns:
A) a loss equal to (ba) × Q1.
B) a loss equal to (ca) × Q1.
C) a loss equal to (bc) × Q1.
D) zero.
Figure: The Market for Yachts
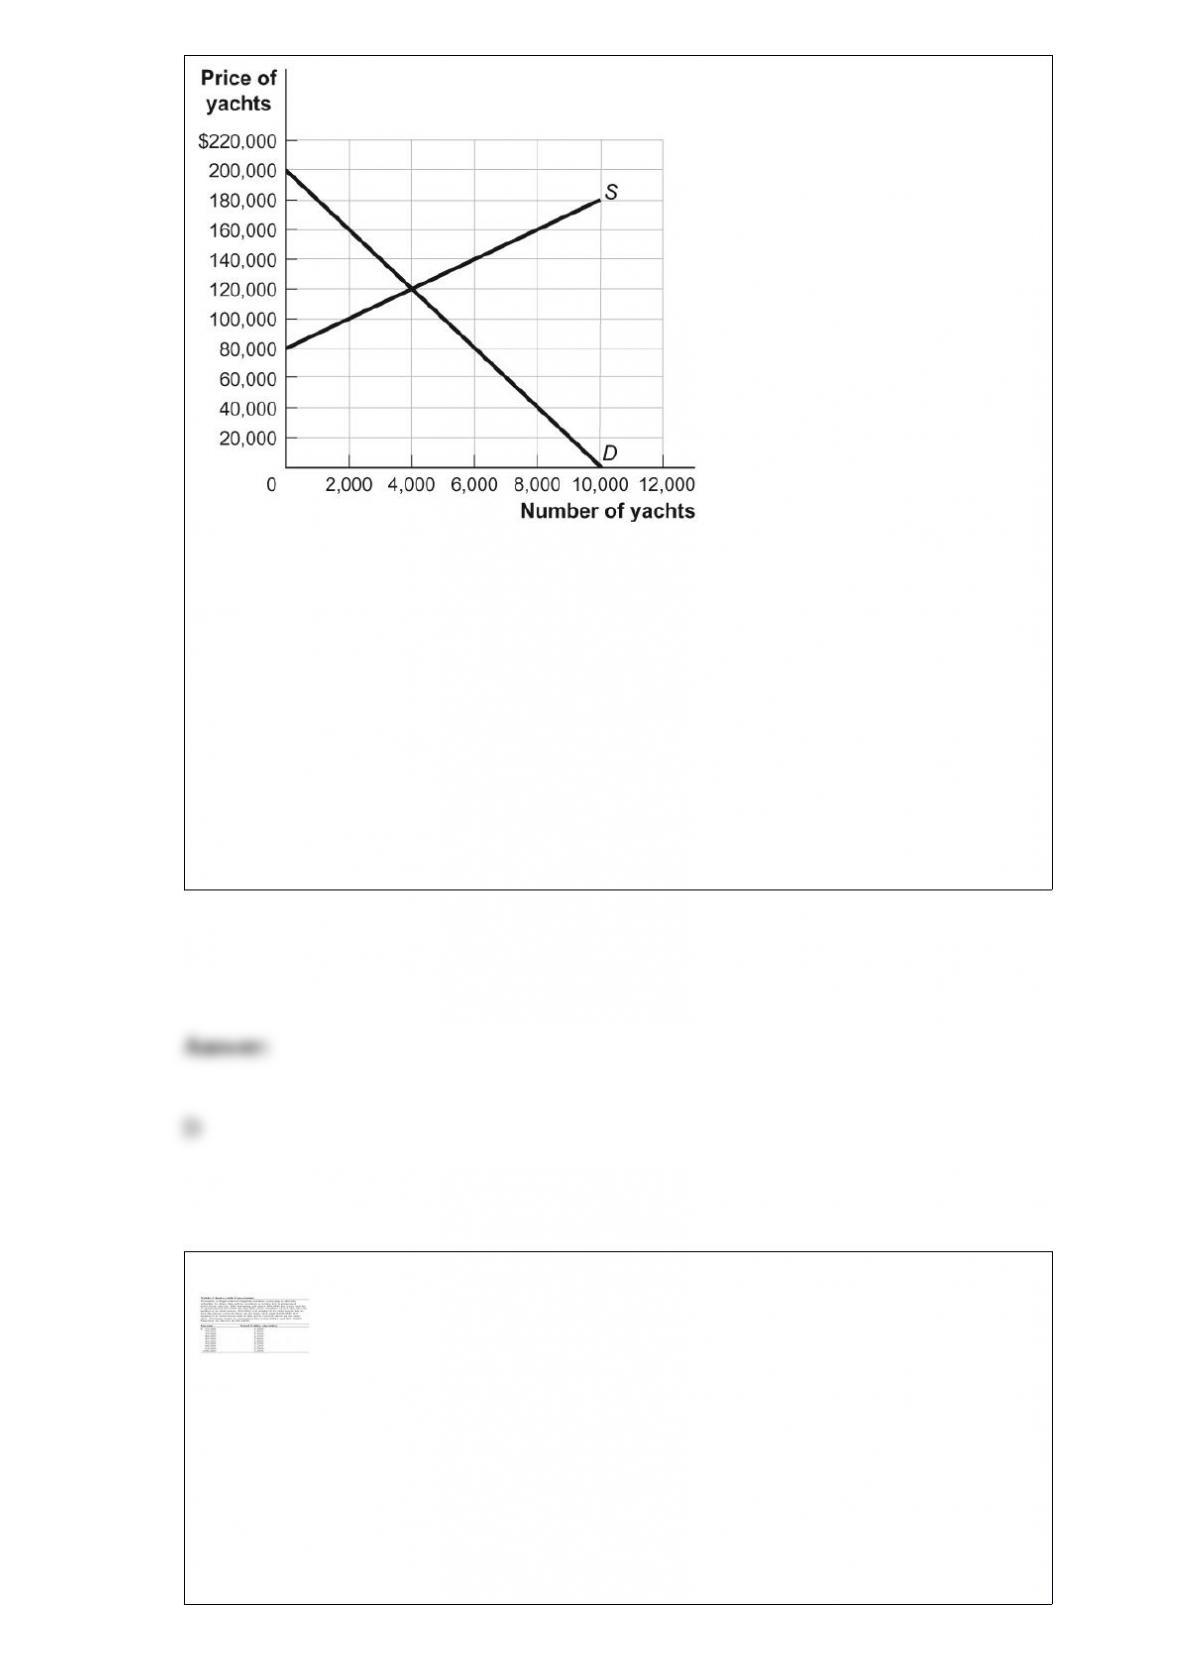
(Figure: The Market for Yachts) Look at the figure The Market for Yachts. If the
government imposes a $60,000 tax on yachts (collected from the producers), the price
of yachts will rise to _____ and the government will collect _____.
A) $100,000; $120 million
B) $120,000; $90 million
C) $140,000; $90 million
D) $160,000; $120 million
(Table: Choice with Uncertainty) Look at the table Choice with Uncertainty. Suppose
that the probability that the sitcom does not make it to television is 60%, the probability
that it makes it to television but is not the most viewed show in its time slot is 30%, and
that the probability that it makes it to television and is the most viewed show in its time
slot is 10%. Norman’s expected total utility is _____ utils.
A) 2,000
B) 2,150
C) 2,350
D) 2,650
Professor Macro wants to use a numerical graph to show the percentage of government
spending accounted for by its various components. Which of the following graphs is
most suitable for this purpose?
A) bar graph
B) pie chart
C) time-series graph
D) scatter diagram
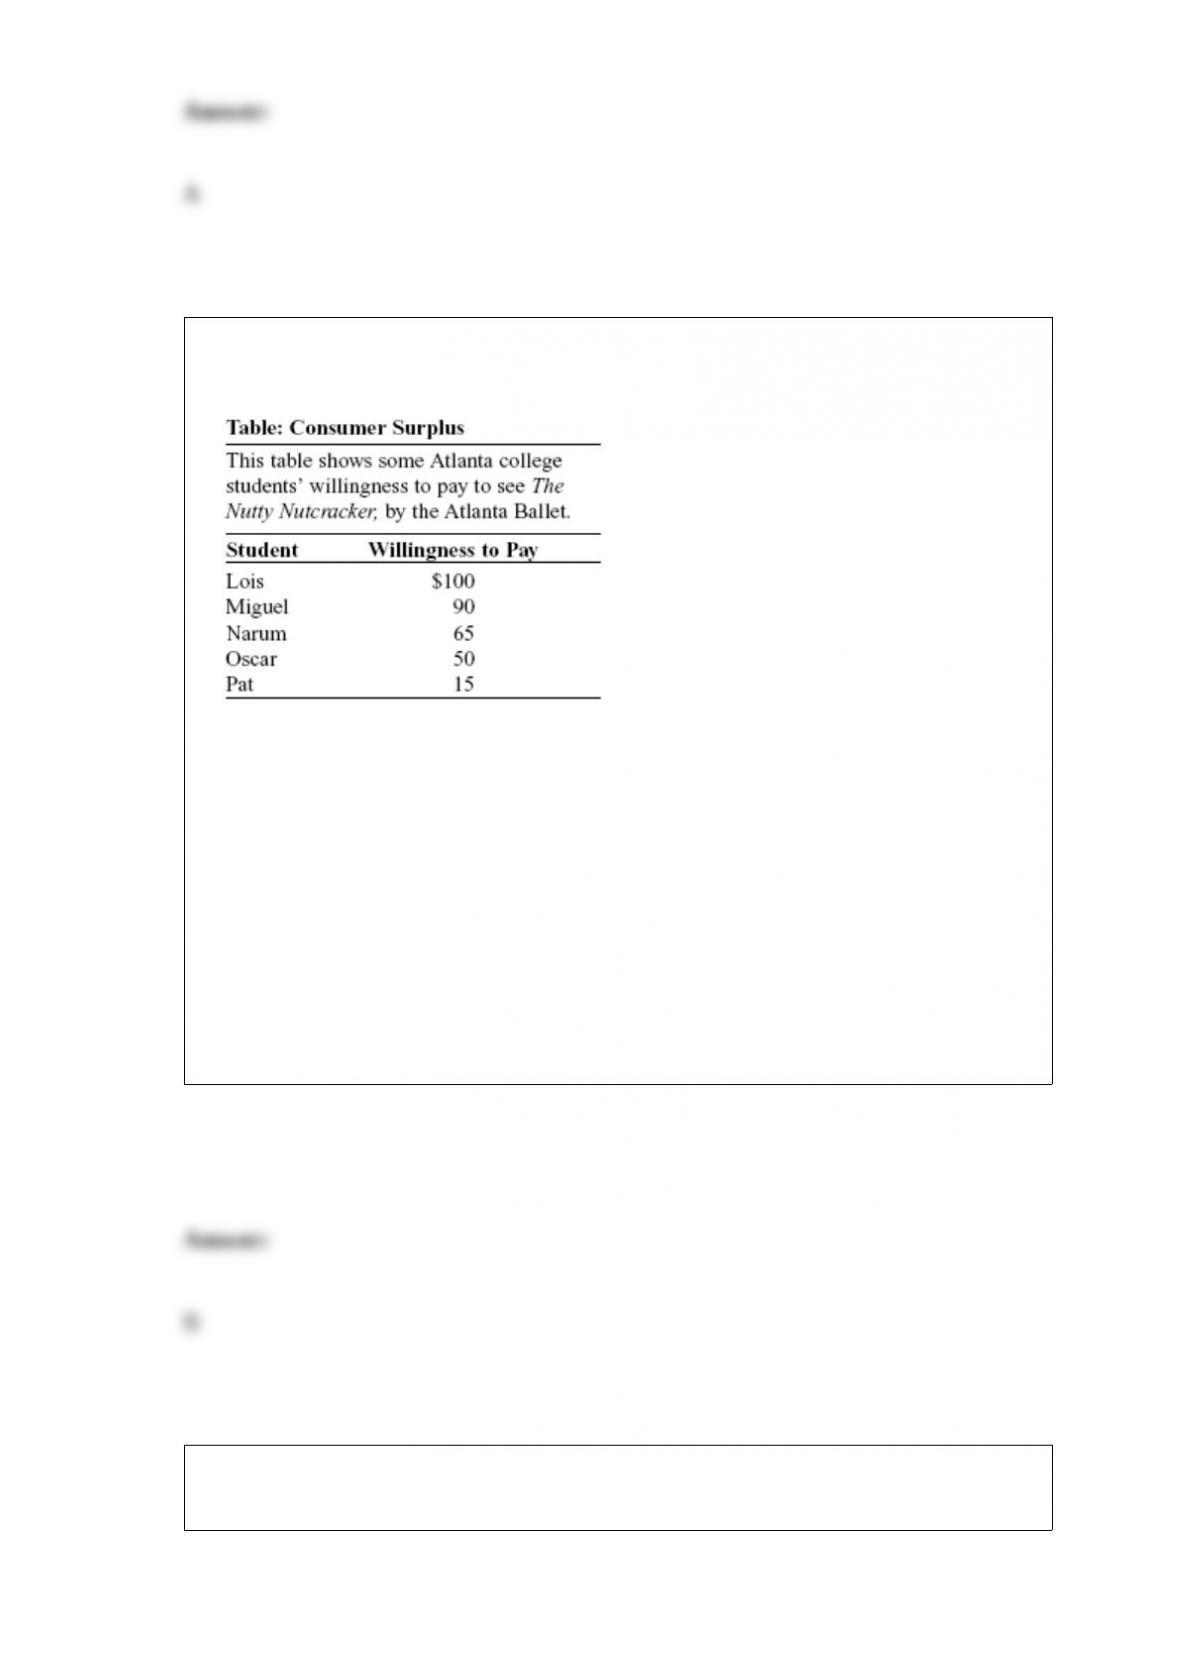
(Table: Consumer Surplus) Look at the table Consumer Surplus. Assume that each
student wants to buy one ticket. If the price of a ticket to see The Nutty Nutcracker is
$50, Lois’s consumer surplus is:
A) $60.
B) $50.
C) $15.
D) $240.
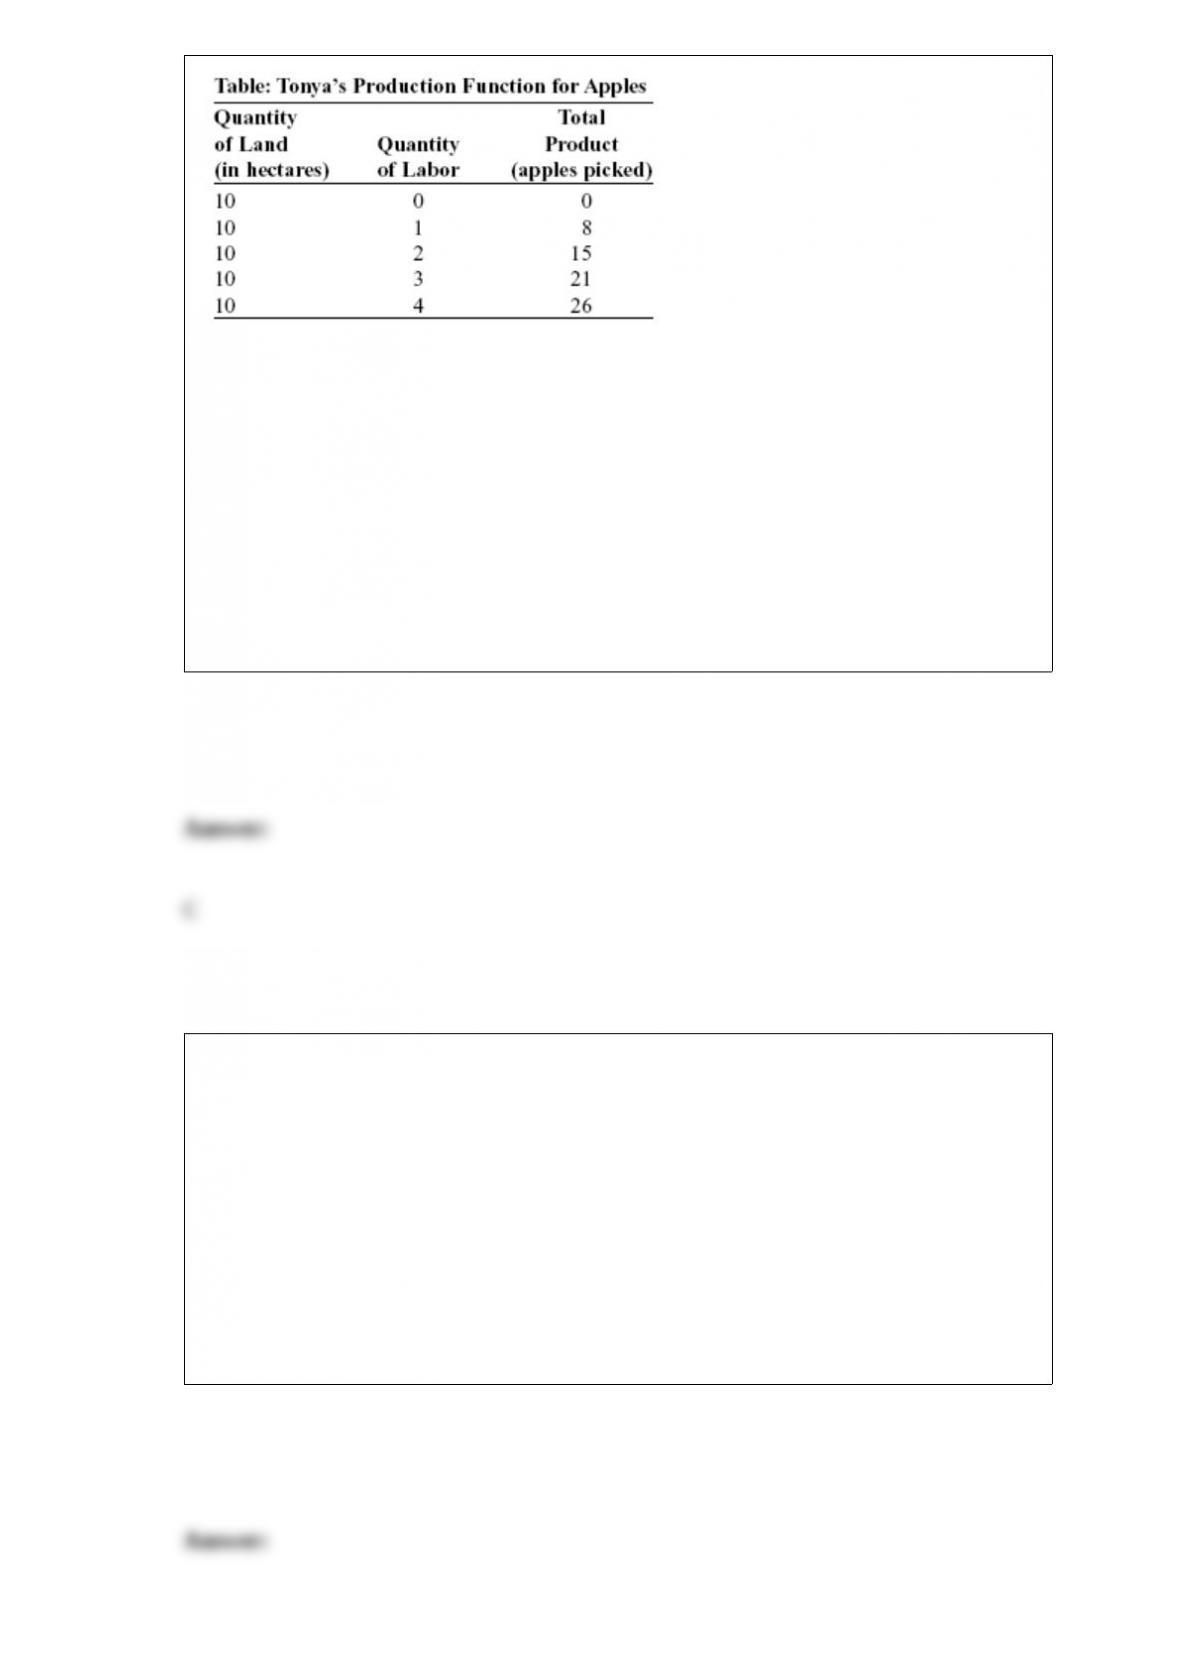
(Table: Tonya’s Production Function for Apples) Look at the table Tonya’s Production
Function for Apples. The marginal product of the fourth worker is _____ apples.
A) 7
B) 26
C) 5
D) 21
The opportunity to engage in pooling shifts the _____ curve of insurance to the right;
insurance companies will take on _____ risk and charge a _____ premium than without
pooling.
A) supply; more; lower
B) demand; more; lower
C) supply; less; higher
D) demand; less; higher

In which of the following situations is adverse selection most likely to be a problem?
A) buying tomatoes at the local farmers’ market
B) hiring a new manager to work the night shift
C) buying a new lawnmower
D) buying a house directly from the previous owner
The government decides to impose a price ceiling on a good because it thinks the
market-determined price is too high. If it imposes the price ceiling above the
equilibrium price:
A) consumers will respond to the higher price and therefore wish to purchase less of the
good than at the equilibrium price.
B) producers will respond to the higher price and therefore offer fewer units for sale.
C) consumers will purchase less of the good after the price ceiling is imposed.
D) neither producers nor consumers will change their behavior.
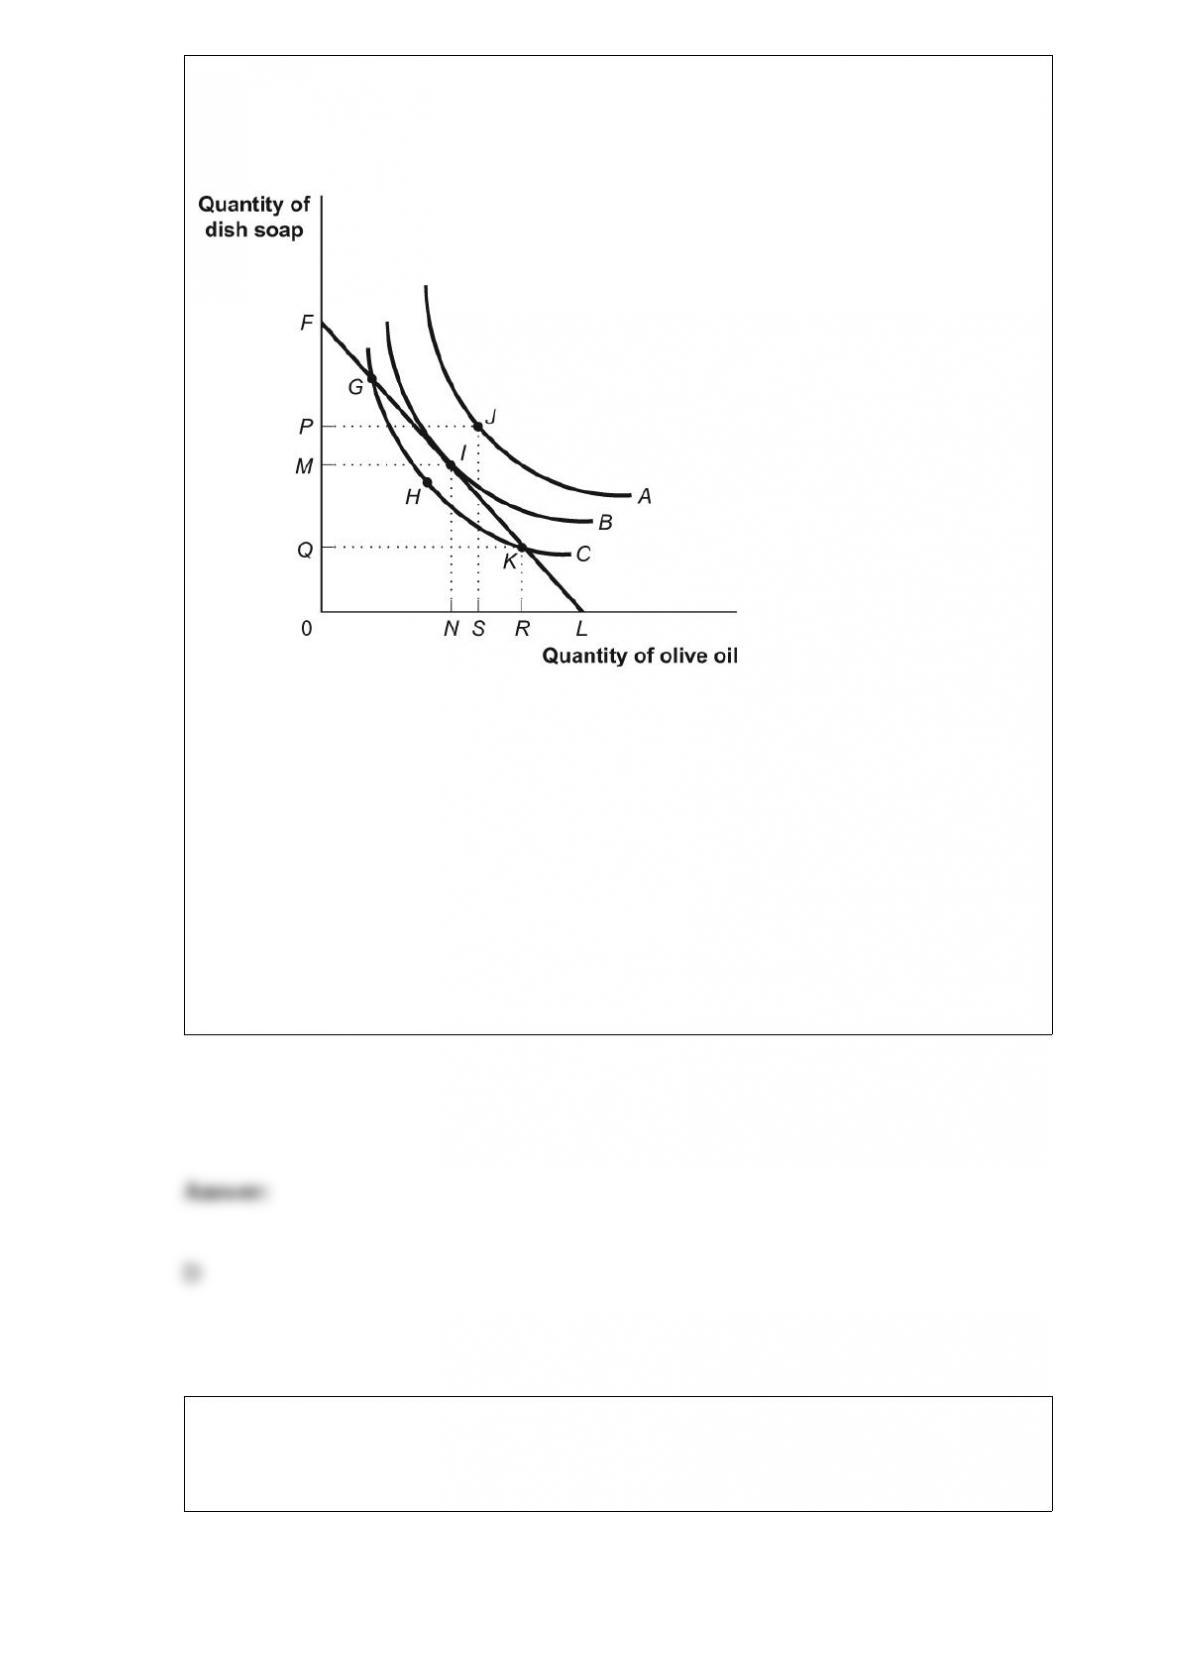
Figure: Consumer Equilibrium II
(Figure: Consumer Equilibrium II) Look at the figure Consumer Equilibrium II. Ashyra
consumes at point I. Ashyra could gain more utility by choosing point _____, all other
things held equal.
A) J
B) G
C) K
D) The consumer doesn’t have enough income to gain more utility.
Figure: The Market for Thumb Drives
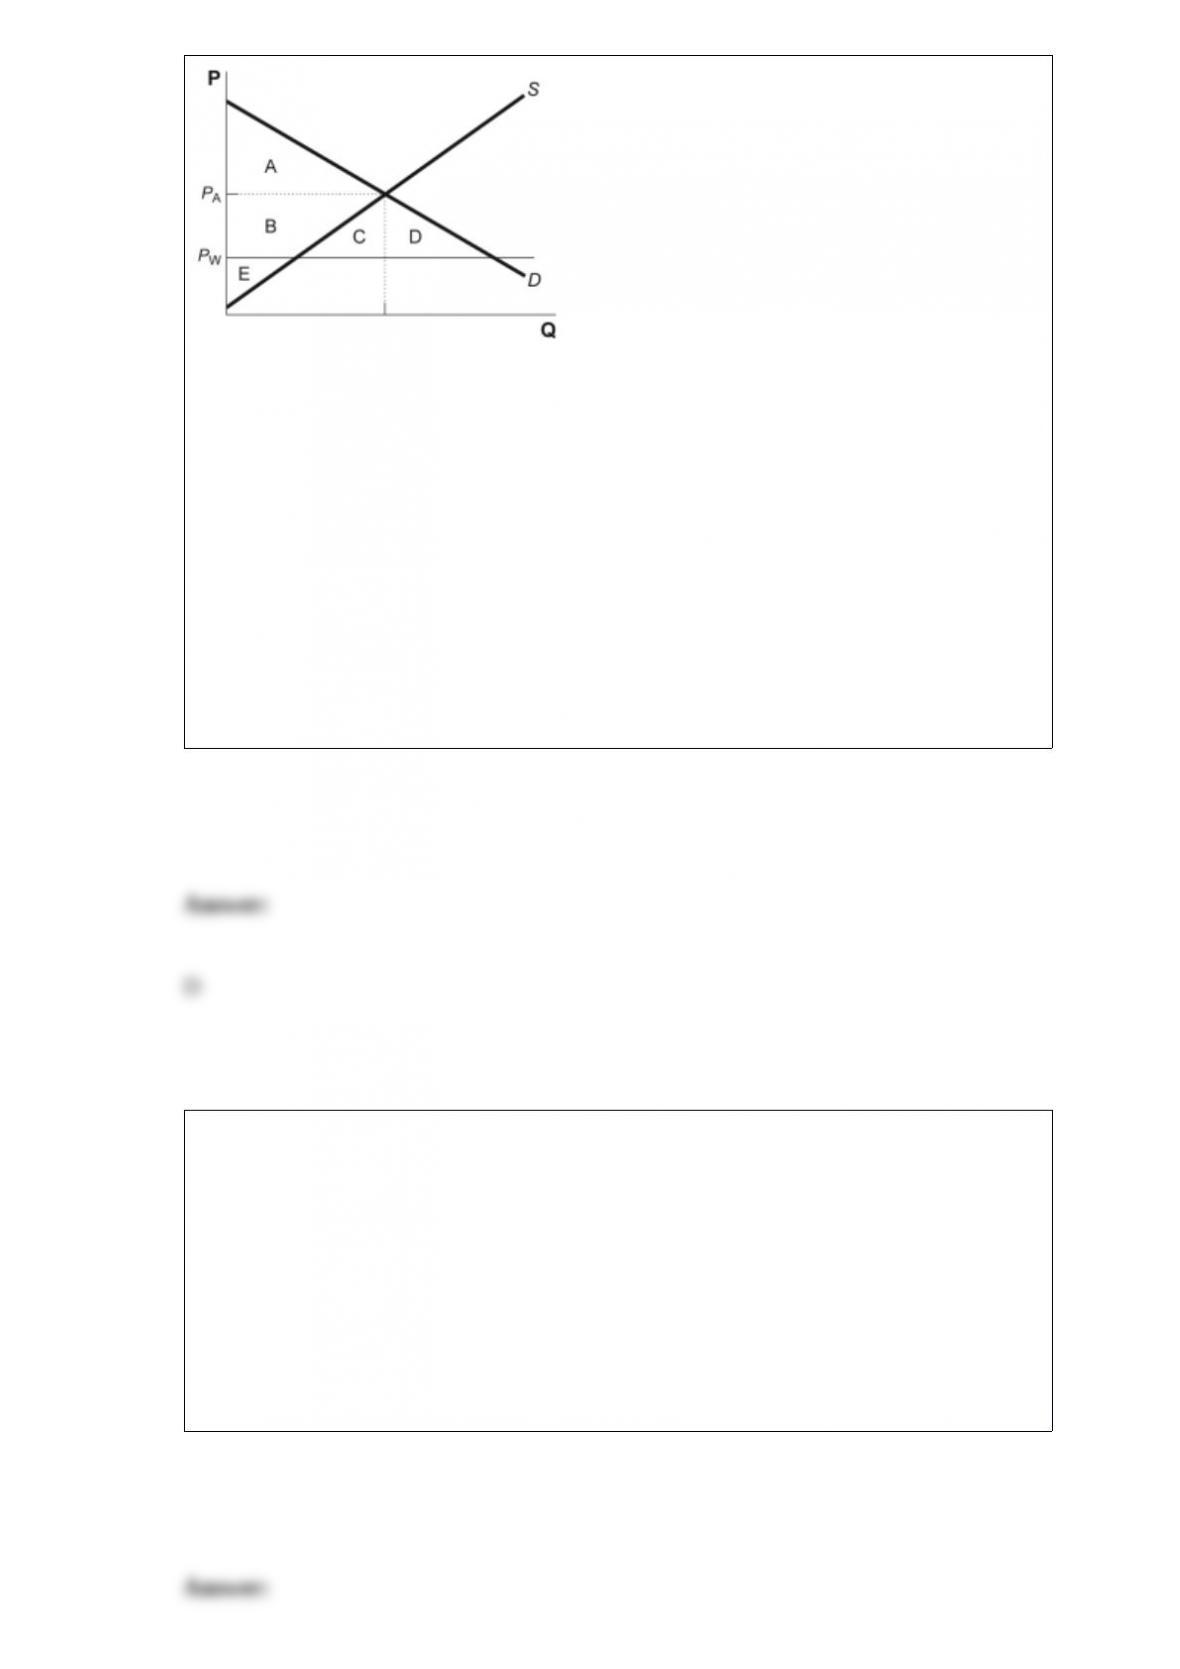
(Figure: The Market for Thumb Drives) Look at the figure The Market for Thumb
Drives. Assume that PA is the autarky price, PW is the world price, and D and S
represent domestic demand and supply, respectively. Producer surplus in free trade
equals the area:
A) B + C.
B) B + C + D +E.
C) B + E.
D) E.
The poverty threshold is defined as:
A) less than $15,000.
B) the minimum annual income that is considered adequate to purchase the necessities
of life.
C) a static and inaccurate figure, since it does not change when prices change.
D) $20,000 for both individuals and households.
Human capital is the improvement in _____ produced by _____.
A) physical capital; technology
B) labor; education and knowledge
C) labor; physical capital
D) labor; management
Scenario: Countries A and B Two countries, A and B, produce two goods, wheat (W)

and steel (S). Each has a linear production possibility frontier in both goods. If country
A spends all of its available resources to produce wheat, it can produce 500 tons of
wheat and no steel. If it uses all of its resources to produce steel, it can produce 250
tons of steel and no wheat. If country B spends all of its available resources producing
wheat, it can produce 400 tons of wheat, and if it spends all of its resources on the
production of steel, it can produce 400 tons of steel.
(Scenario: Countries A and B) Look at the scenario Countries A and B. Given this
information, the country that has the absolute advantage in wheat is _____, and the
country that has the absolute advantage in steel is _____.
A) A; A
B) A; B
C) B; B
D) B; A
The _____ effect of a _____ wage causes individuals to substitute _____.
A) substitution, higher; labor for leisure
B) income; lower; leisure for labor
C) substitution; lower; labor for leisure
D) complementary; constant; leisure for labor
If a firm hires labor and with its current employees W = VMPL, then profit:
A) is maximized.
B) can be increased by hiring less labor.
C) can be increased by hiring more labor.
D) can be increased by increasing the wage rate.
Hugo Chávez was the president of Venezuela. Venezuela is a major producer of oil
products, which remain the keystone of Venezuela’s economy. Suppose President
Chávez wanted to increase his popularity with the citizens of Venezuela and enacted a
government policy to reduce the price of gasoline sold at state-owned gas stations to
50% of the previous price. Assuming a downward-sloping demand curve for gasoline,
in theory, this policy would result in the quantity of gasoline demanded to be _____ the
quantity of gasoline supplied.
A) equal to
B) greater than
C) less than
D) greater than or equal to
If Brazil gives up three automobiles for each ton of coffee it produces, while Peru gives
up seven automobiles for each ton of coffee it produces, then Brazil has a comparative
advantage in _____ production and should specialize in _____.
A) automobile; coffee
B) coffee; automobiles
C) coffee; coffee
D) automobile; automobiles
By definition, in a black market, goods or services are bought and sold:
A) at night.
B) without any information about quality.
C) without any information about price.
D) illegally.
In the past, most of the cars sold in the United States were produced by the Big Three
auto companies. General Motors would announce its prices for the new model year
first, and then the other companies would match it. This practice was an example of:

A) price leadership.
B) noncooperative behavior.
C) a kinked demand model.
D) a cartel.
If an economy is producing at a point on its production possibilities frontier, it is:
A) efficient in production and allocation.
B) efficient in production but not necessarily in allocation.
C) efficient in allocation but not necessarily in production.
D) not necessarily efficient in production or allocation.
Cookie Monster always consumes cookies and milk in fixed proportions: 4 cookies to 8
ounces of milk. Which of the following combinations of cookies and milk will give
Cookie Monster the highest total utility?
A) 8 cookies and 16 ounces of milk
B) 4 cookies and 8 ounces of milk
C) 4 cookies and 16 ounces of milk
D) 4 cookies and 4 ounces of milk
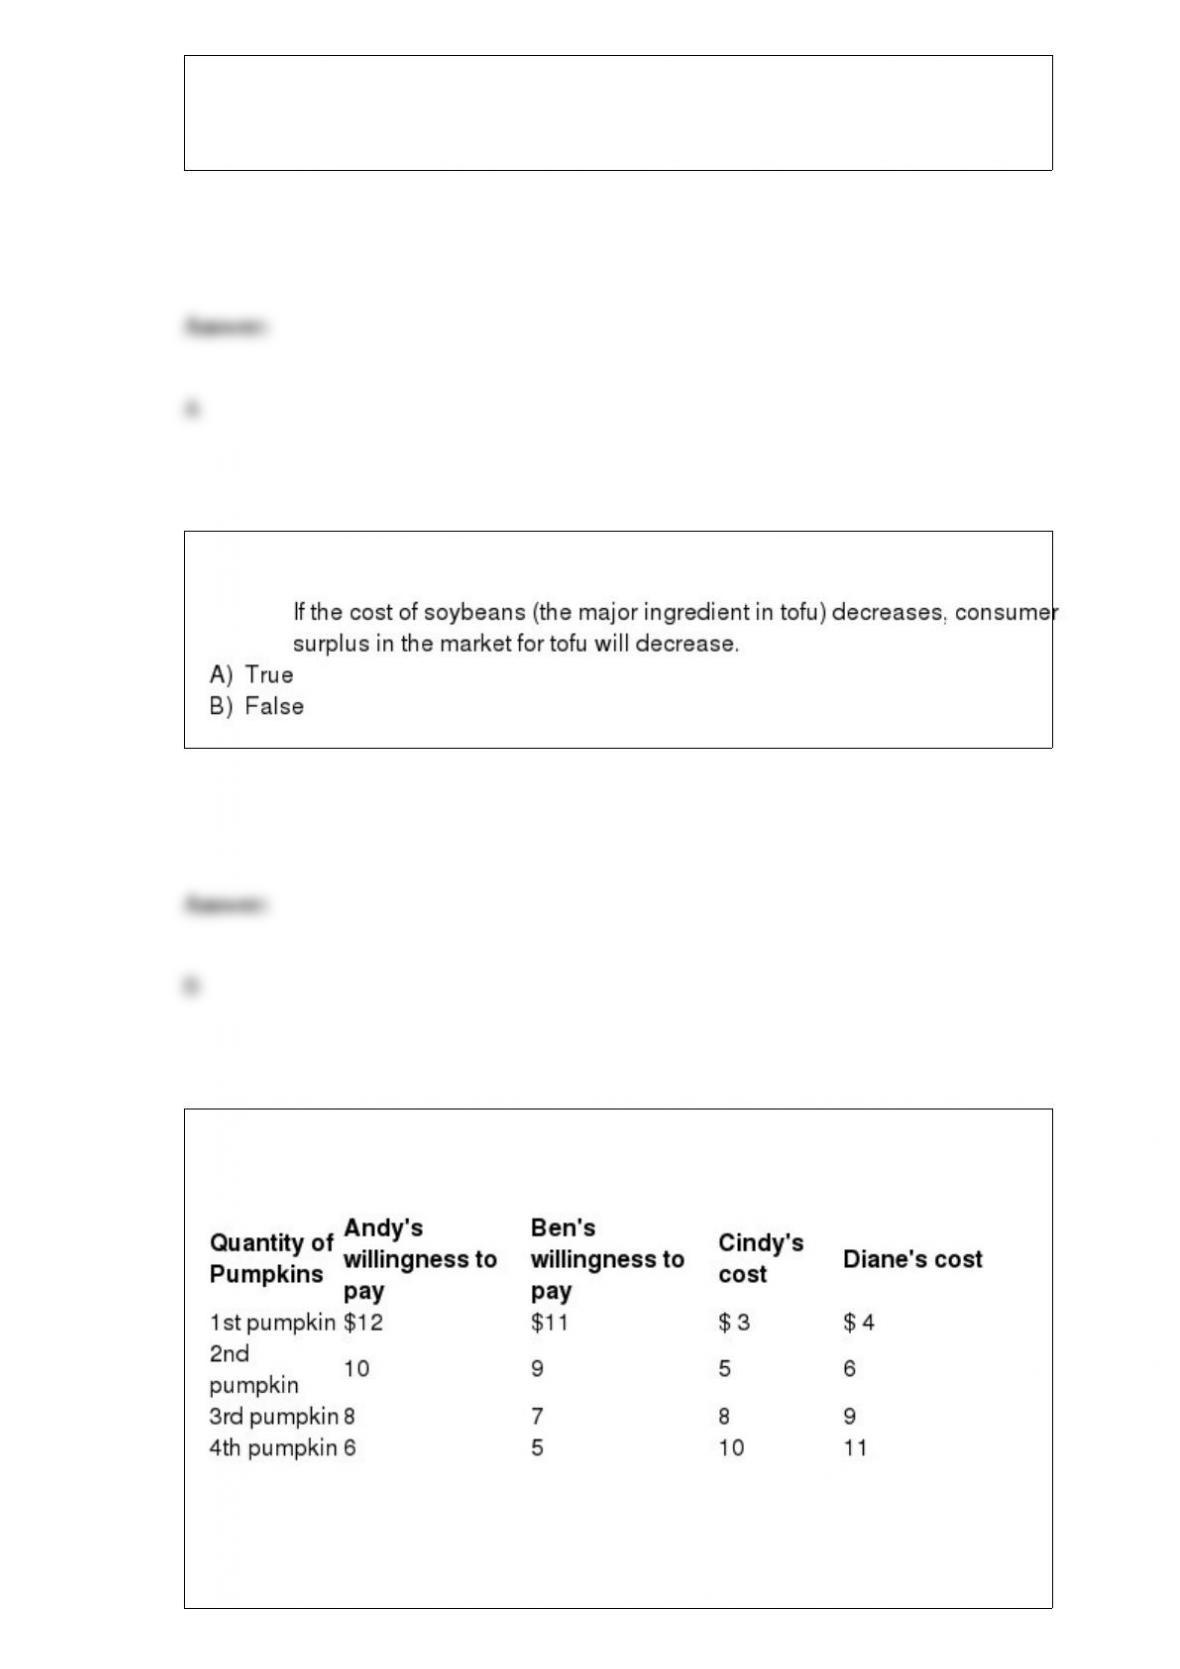
Table: Pumpkin Market
(Table: Pumpkin Market) There are two consumers, Andy and Ben, in the market for
pumpkins. Their willingness to pay for each pumpkin is shown in the table Pumpkin
Market. There are two producers of pumpkins, Cindy and Diane, and their costs are also
shown. The equilibrium quantity of pumpkins is:
A) two.
B) three.
C) four.
D) five.
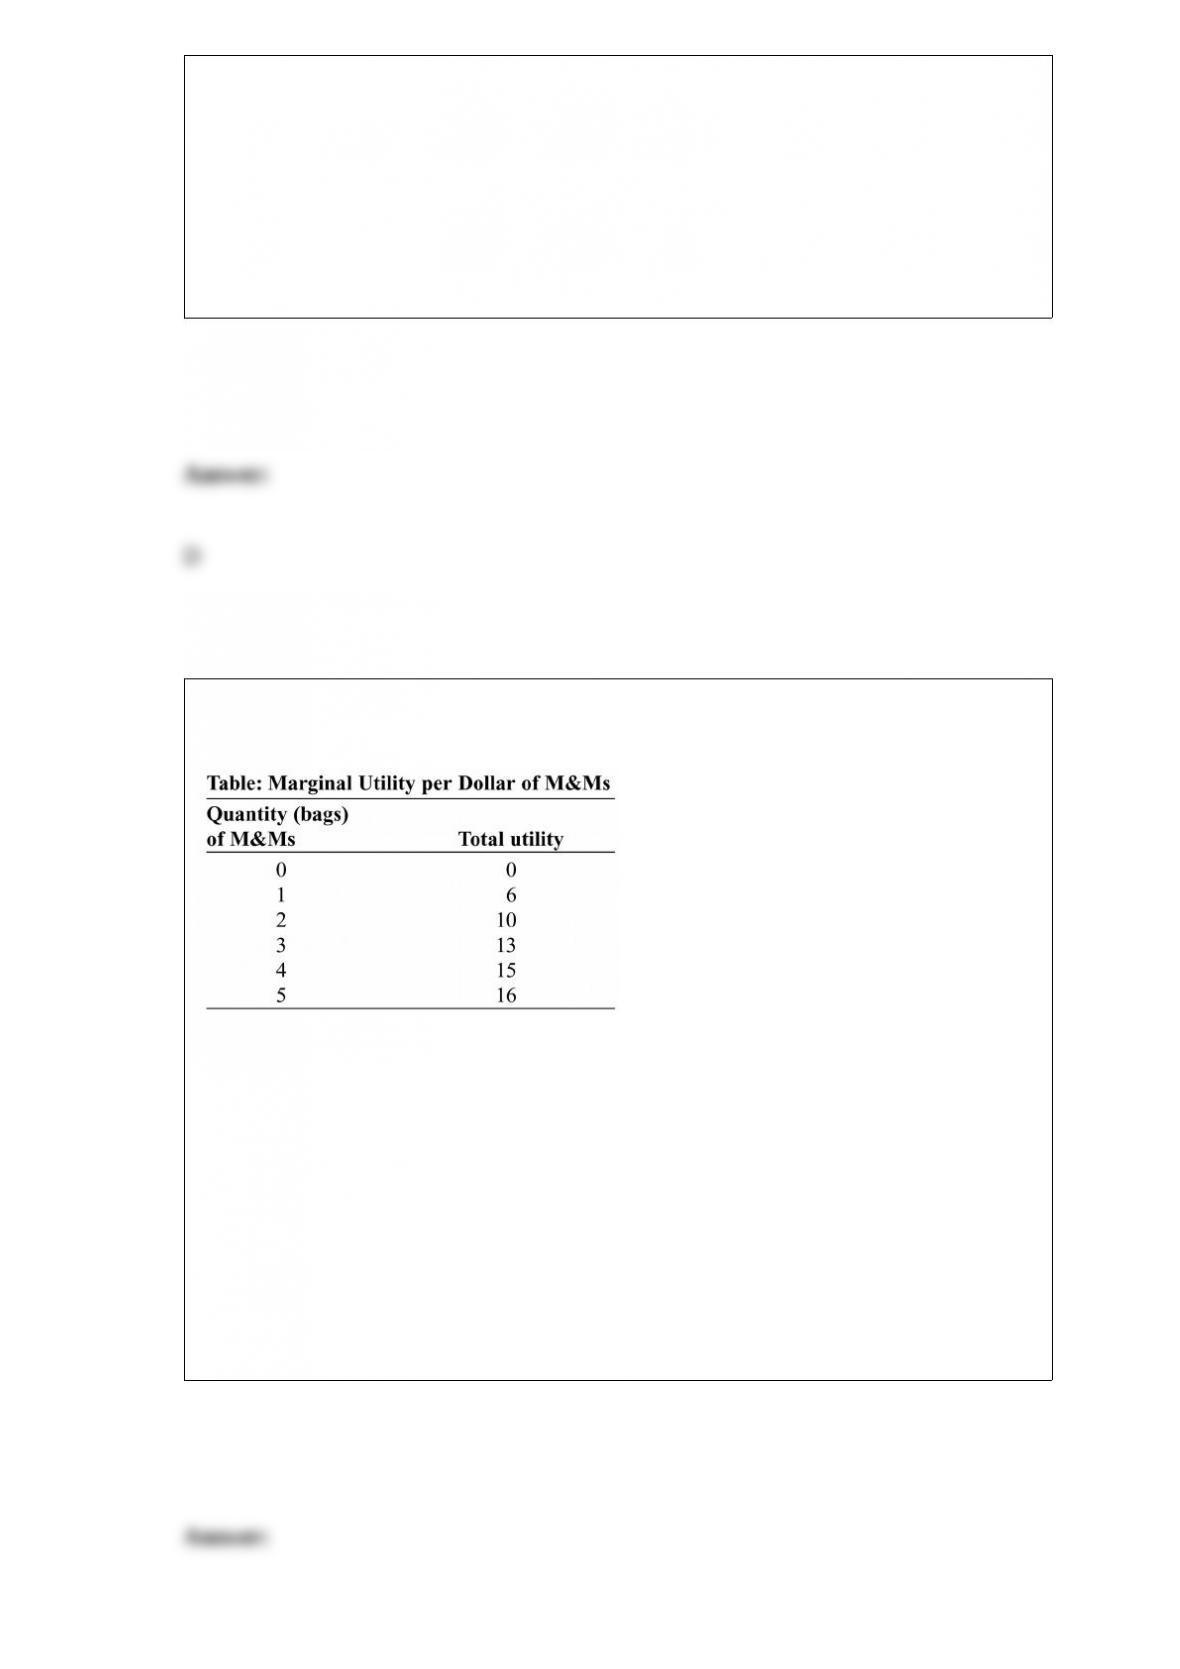
(Table: Marginal Utility per Dollar of M&Ms) Look at the table Marginal Utility per
Dollar of M&Ms. The price of M&Ms is $2 per bag. If the price of M&Ms increases to
$3 per bag, the marginal utility per dollar for each bag of M&Ms will:
A) increase.
B) decrease.
C) remain constant.
D) fluctuate randomly.