1) In which of the following tax systems do taxes increase as income increases?
a.both proportional and progressive
b.proportional but not progressive
c.progressive but not proportional
d.neither proportional nor progressive
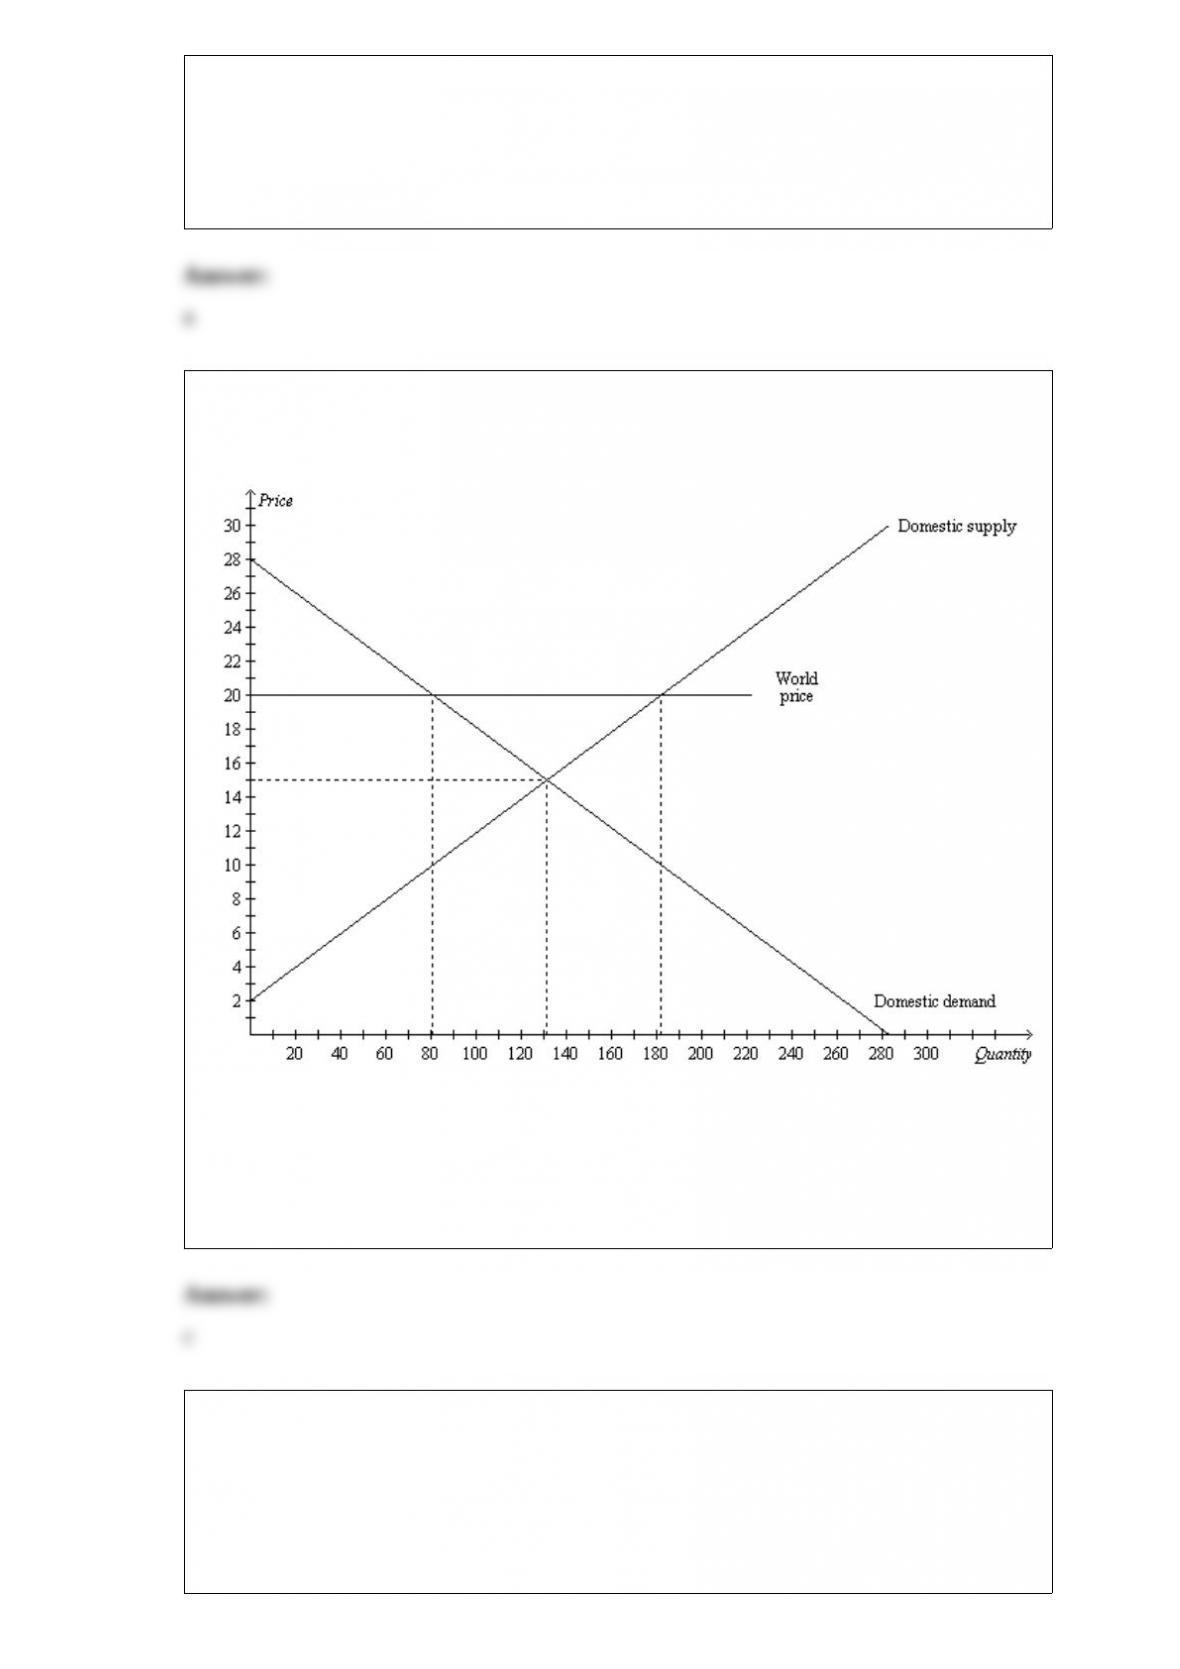
2) Figure 9-2
The figure illustrates the market for calculators in a country.
If this country chooses to trade, the price of calculators in this country will be
a.$15 and 80 calculators will be sold domestically.
b.$15 and 130 calculators will be sold domestically.
c.$20 and 80 calculators will be sold domestically.
d.$20 and 130 calculators will be sold domestically.
3) Domestic producers of a good become better off, and domestic consumers of a good
become worse off, when a country begins allowing international trade in that good and
a.the country becomes an importer of the good as a result.
b.the world price exceeds the domestic price of the good that prevailed before
international trade was allowed.
c.other countries have a comparative advantage, relative to the country in question, in
producing the good.
d.total surplus does not change as a result.
4) From 2009 to 2012, the federal budget deficits were the largest budget shortfalls
since World War II. The primary reason for the record-large deficits was
a.the recession experienced during this time.
b.severe budget tightening by members of Congress.
c.the shift in political power from Republicans to Democrats.
d.All of the above are correct.
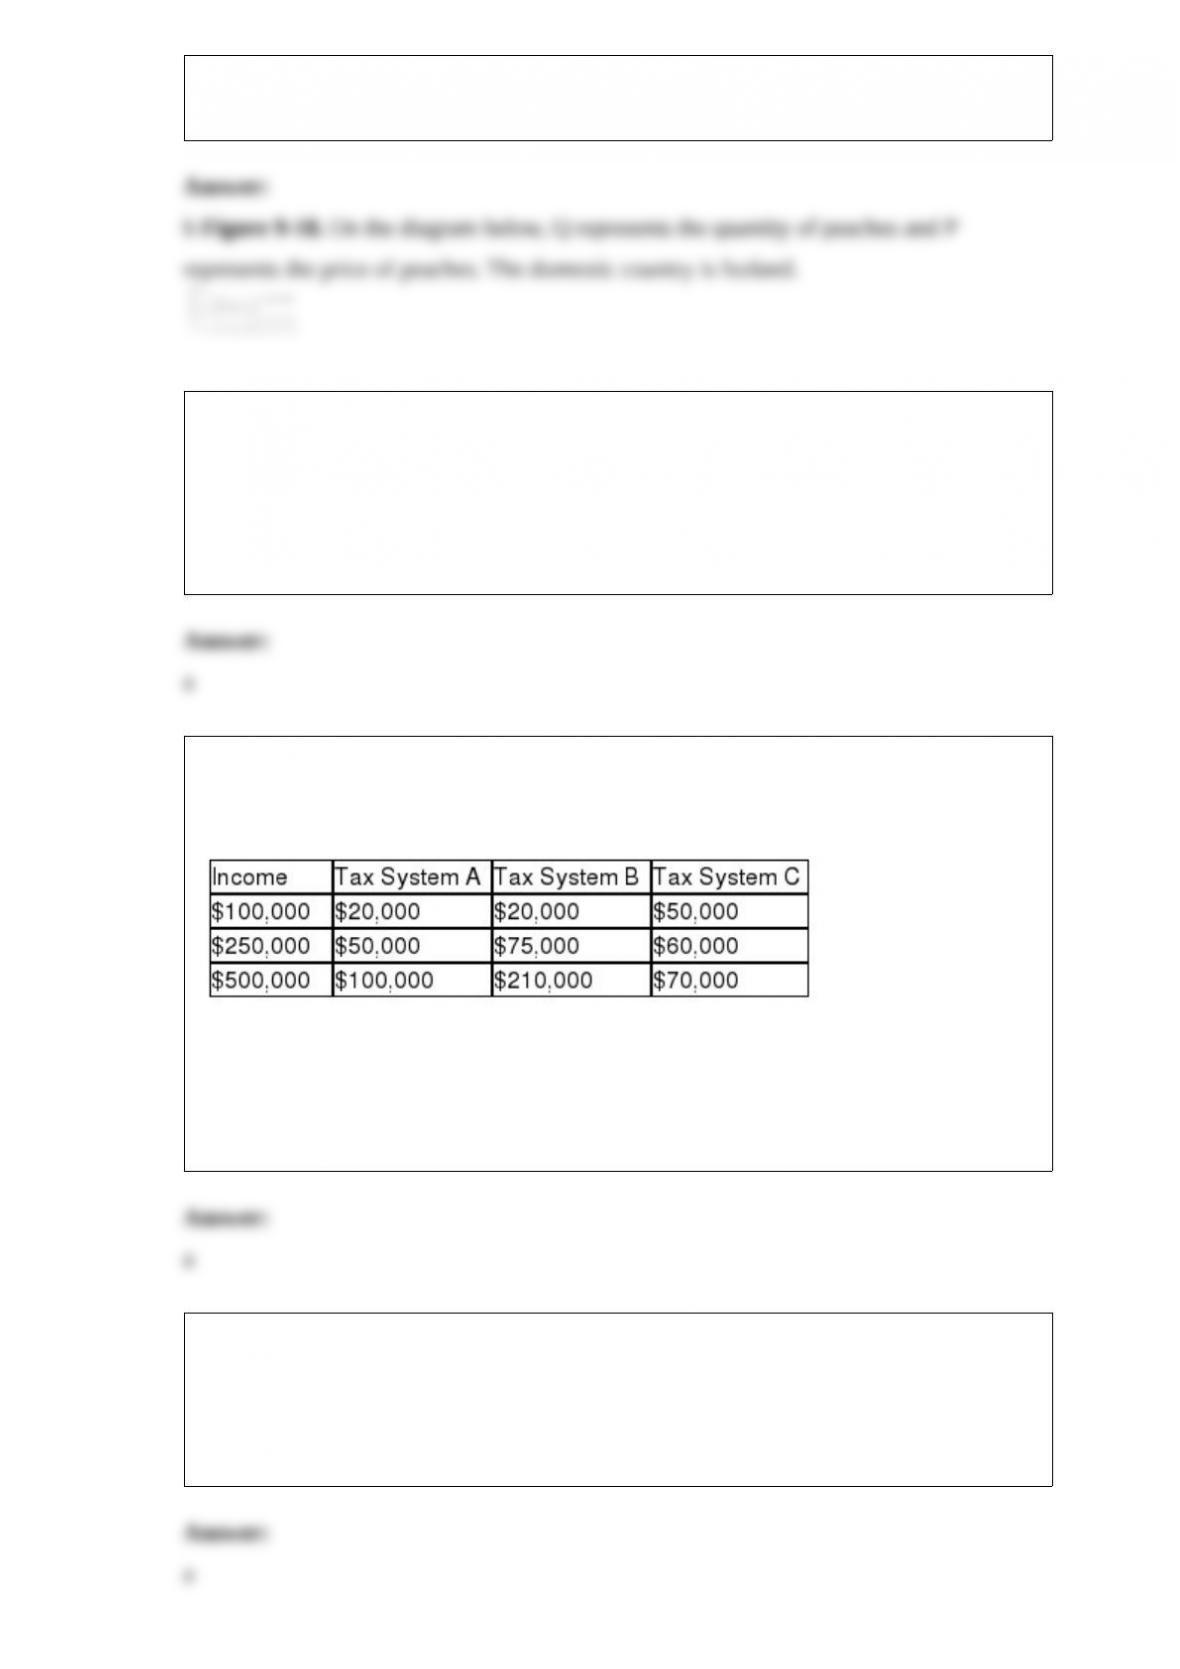
5) Table 12-23
The dollar amounts in the last three columns are the taxes owed under the three
different tax systems.
Which of the three tax systems is proportional?
a.Tax System A
b.Tax System B
c.Tax System C
d.None of the systems are proportional.
6) Other things equal, the demand for a good tends to be more inelastic, the
a.fewer the available substitutes.
b.longer the time period considered.
c.more the good is considered a luxury good.
d.more narrowly defined is the market for the good.
7) The lower the price, the lower the consumer surplus, all else equal.
a.True
b.False
8) Scenario 13-11
Walter builds birdhouses. He spends $5 on the materials for each birdhouse. He can
build one in 30 minutes. He is semi-retired but earns $8 per hour at the local hardware
store. He can sell a birdhouse for $20 each.
An accountant would calculate the total profit for one birdhouse to be
a. $7.
b.$11.
c.$12.
d.$15.
9) International trade may make some individuals in a nation better off, while other
individuals are made worse off.
a.True
b.False
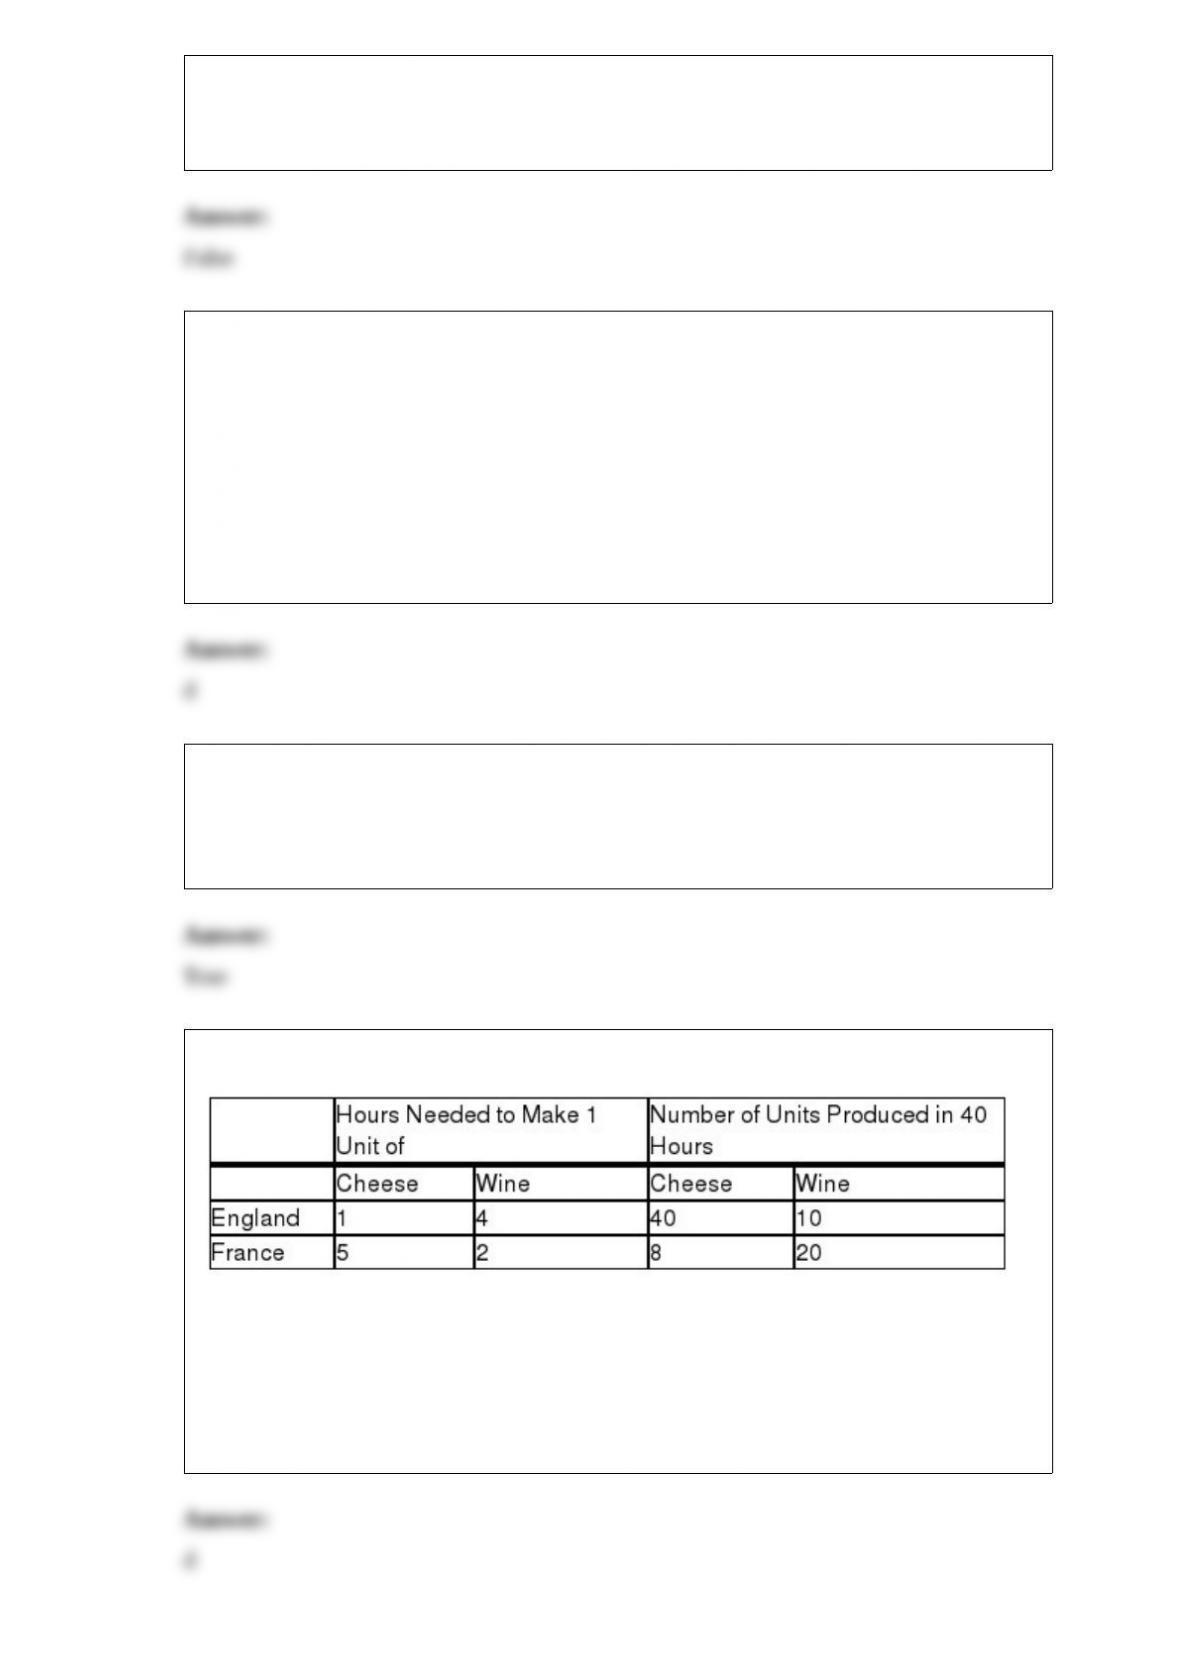
10) Production Opportunities
Which of the following combinations of cheese and wine could England not produce in
40 hours?
a.12 units of cheese and 7 units of wine
b.16 units of cheese and 6 units of wine
c.20 units of cheese and 5 units of wine
d.26 units of cheese and 4 units of wine
11) For teenagers, a 10 percent increase in the price of cigarettes leads to a
a.1 percent reduction in the quantity demanded of cigarettes.
b.4 percent reduction in the quantity demanded of cigarettes.
c.10 percent reduction in the quantity demanded of cigarettes.
d.12 percent reduction in the quantity demanded of cigarettes.
12) A consumer consumes two normal goods, sandwiches and milk. When the price of
milk is $0.50 per glass, the consumer purchases 40 glasses. When the price rises to
$0.65 per glass, the consumer purchases 30 glasses. We can use the information
provided by the consumer’s optimum choices to derive the
a.demand curve for milk.
b.demand curve for sandwiches.
c.supply curve for milk.
d.labor-leisure tradeoff.
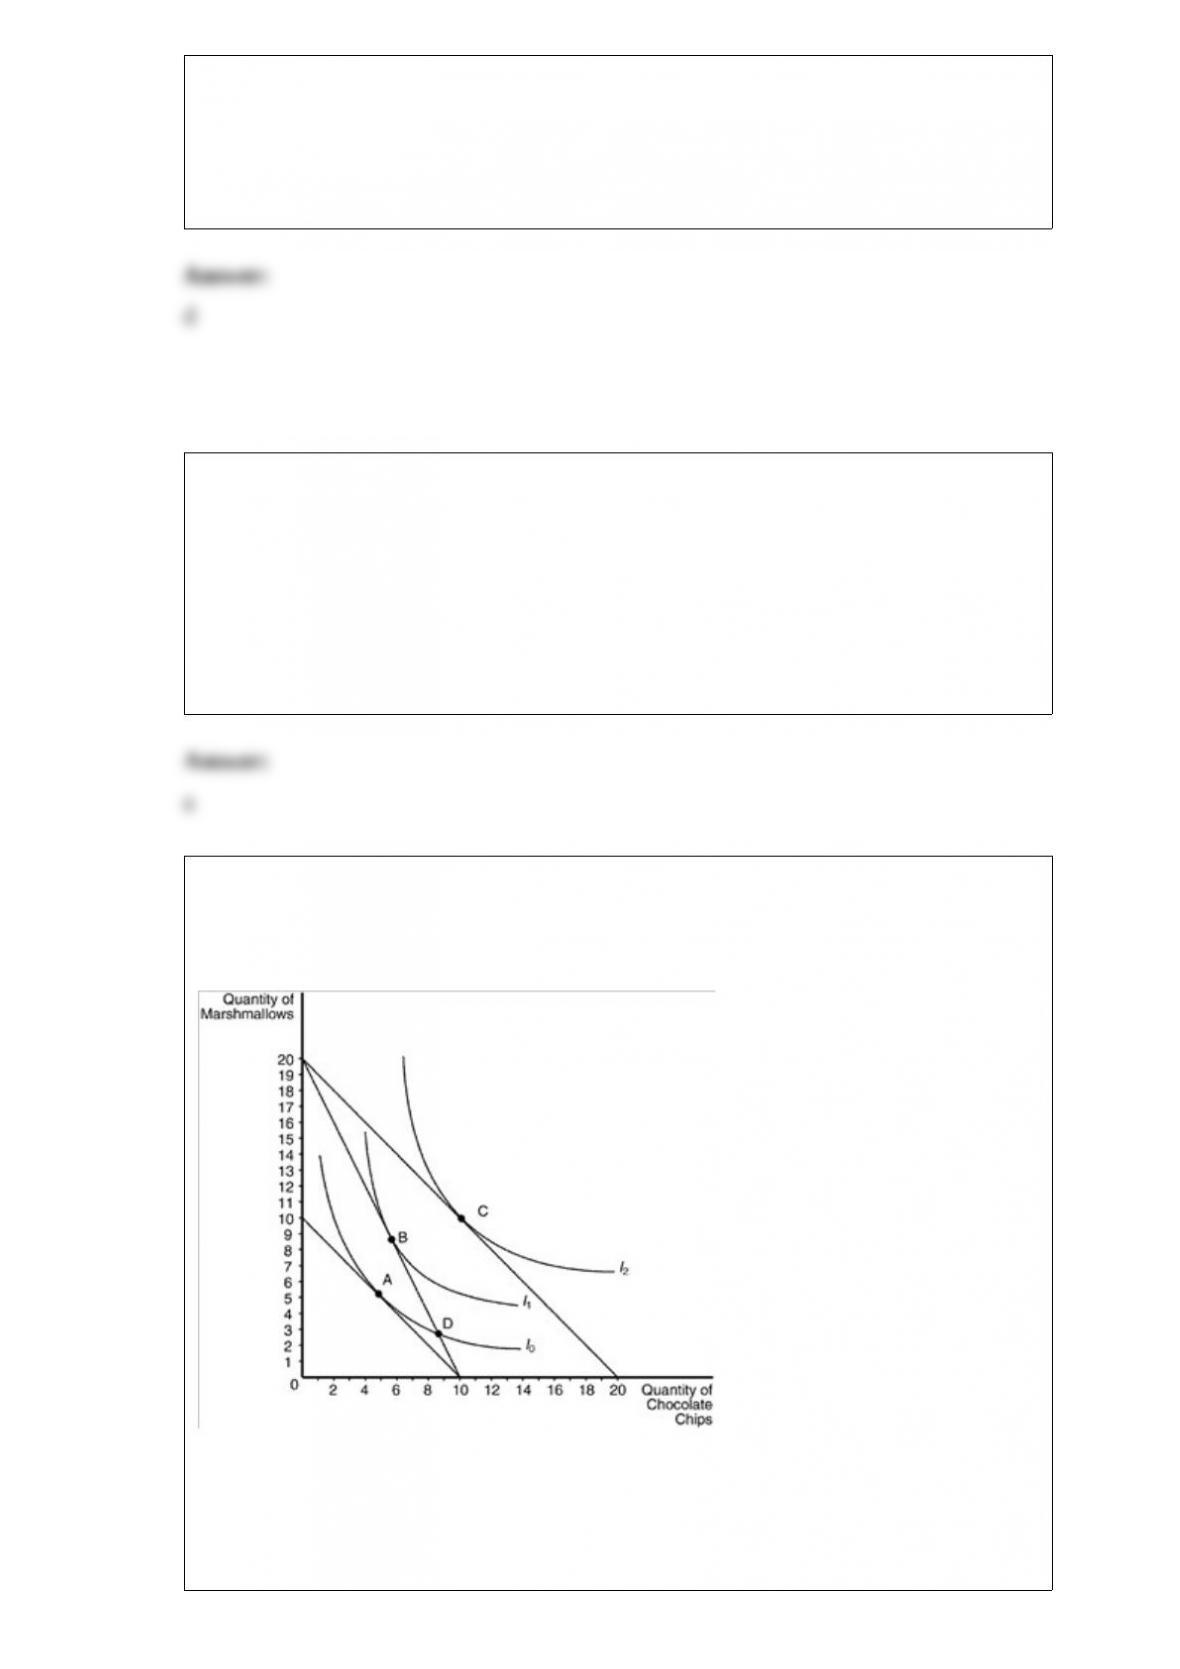
13) Figure 21-20
The following graph illustrates a representative consumer’s preferences for
marshmallows and chocolate chip cookies:
Refer to Figure 21-20. Assume that the consumer has an income of $80. If the price of
chocolate chips is $4 and the price of marshmallows is $4, the optimizing consumer
would choose to purchase
a.9 marshmallows and 6 chocolate chips.
b.10 marshmallows and 10 chocolate chips.
c.5 marshmallows and 5 chocolate chips.
d.3 marshmallows and 9 chocolate chips.
14) A firm will shut down in the short run if the total revenue that it would get from
producing and selling its output is less than its
a.opportunity costs.
b.fixed costs.
c.variable costs.
d.total costs.
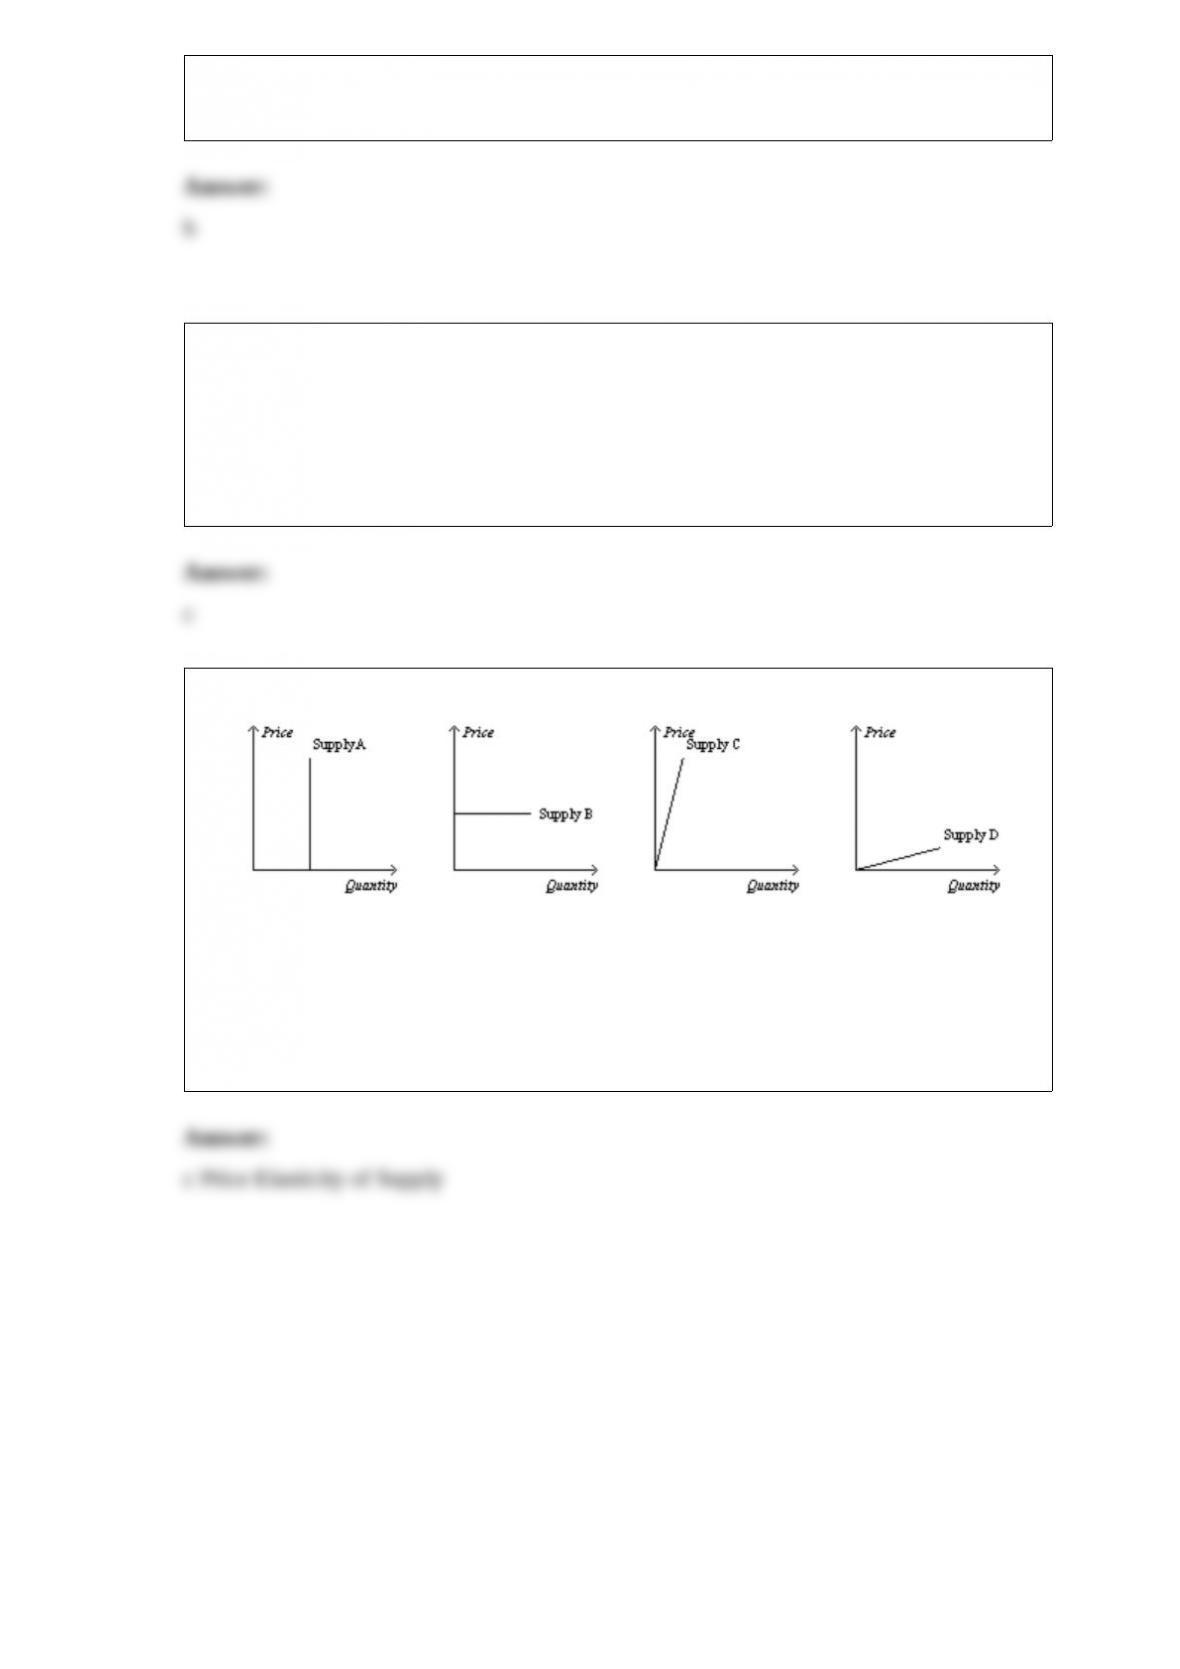
15)
Wh
ich of the following statements is not correct?
a.Supply curve A is perfectly inelastic.
b.Supply curve B is perfectly elastic.
c.Supply curve C is unit elastic.
d.Supply curve D is more elastic than supply curve C.