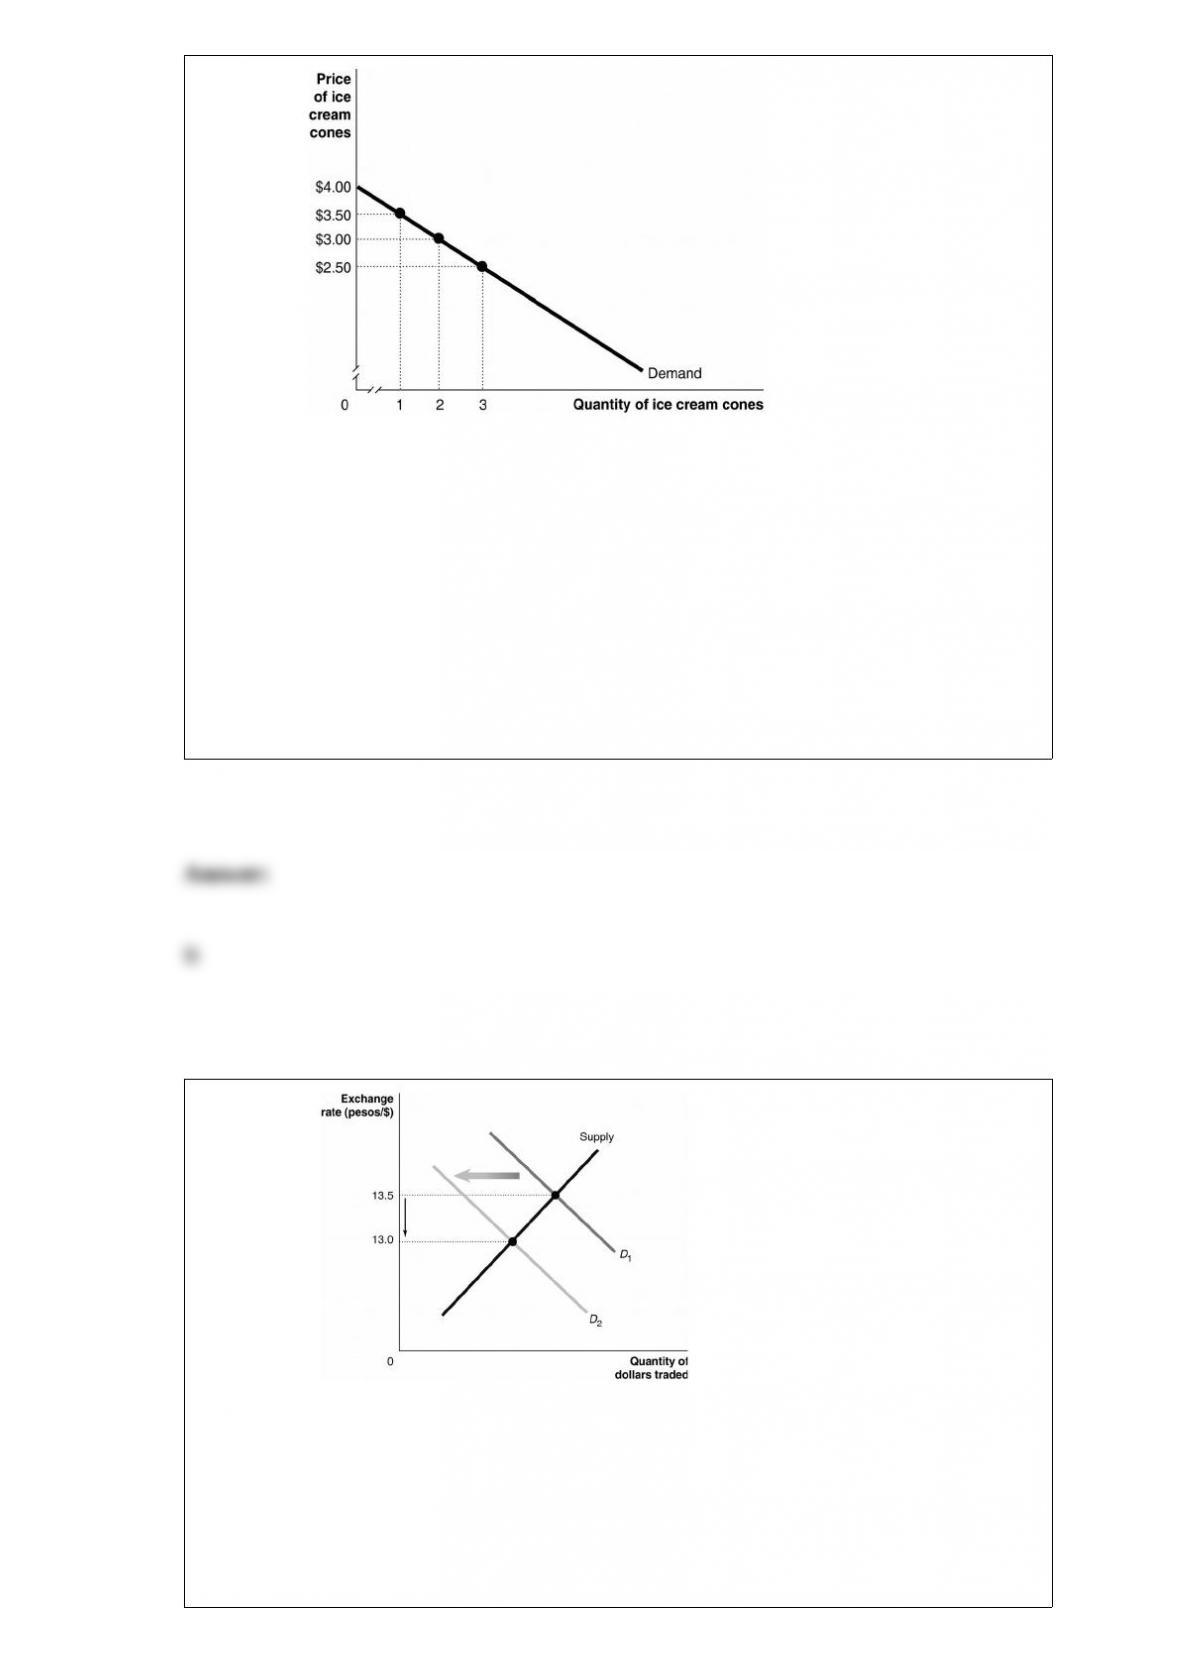
Figure 4-3 Figure 4-3 shows Kendra’s
demand curve for ice-cream cones.
What is the total amount that Kendra is willing to pay for 1 ice cream cone?
A) $0.50
B) $3.50
C) $9.00
D) $13.50
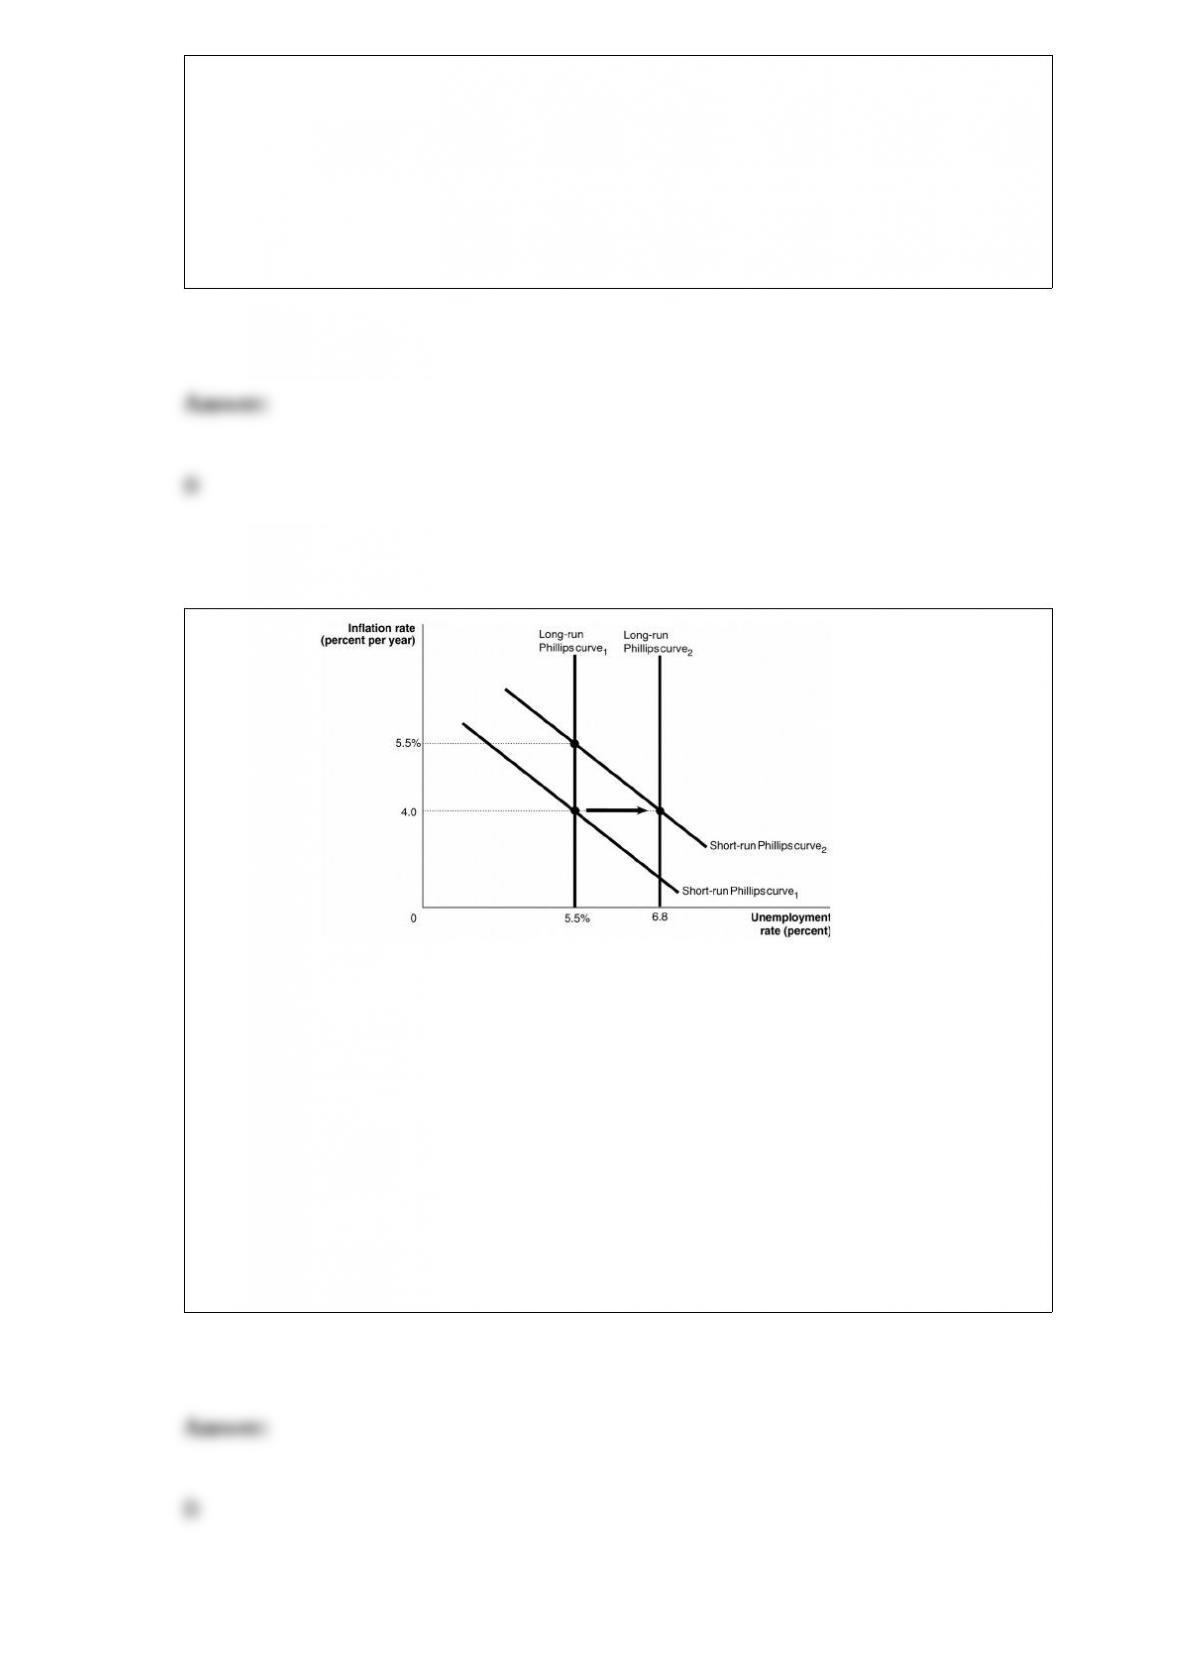
Figure 19-6
Which of the following would cause the change depicted in the figure above?
A) An increase in investment in infrastructure causes U.S. productivity to rise relative
to Mexican productivity.
B) A growing preference for Margaritas causes U.S. consumers to increase their

preferences for Mexican tequila relative to American-produced alcohol.
C) Dumping accusations result in the United States placing tariffs on produce imported
from Mexico.
D) A contractionary monetary policy causes a decrease in the price level of U.S. goods
relative to Mexican goods.
In the market for insurance,
A) buyers often have more information than sellers.
B) sellers often have better information than buyers.
C) sellers are protected from lawsuits brought by buyers.
D) demand is perfectly inelastic because, by law, home owners and automobile drivers
must have insurance.
Potential GDP is also referred to as
A) realized GDP.
B) full-employment GDP.
C) politico-economic GDP.
D) balanced-budget GDP.

NAFTA refers to a 1994 agreement that eliminated most tariffs among which countries?
A) Canada, the United Kingdom and Mexico
B) the United States, the United Kingdom and Mexico
C) the United States, Canada and Mexico
D) the United States, Mexico and Cuba
A decrease in the demand for American-made goods will
A) increase the supply of dollars in the foreign exchange market.
B) decrease the supply of dollars in the foreign exchange market.
C) increase the demand for dollars in the foreign exchange market.
D) decrease the demand for dollars in the foreign exchange market.
The supporters of a monetary growth rule believe that active monetary policy
A) stabilizes the economy, decreasing the number of recessions and their severity.
B) destabilizes the economy, increasing the number of recessions and their severity.
C) cannot change the inflation rate.
D) cannot change real GDP.
Figure 17-3
The shifts shown in the short-run and long-run Phillips curves between period 1 and
period 2 could be explained by
A) an increase in the expected inflation rate from 4.0 to 5.5 percent.
B) an increase in the natural rate of unemployment from 5.5 to 6.8 percent.
C) either an increase in expected inflation from 4.0 to 5.5 percent or an increase in the
natural rate of unemployment from 5.5 to 6.8 percent.
D) None of the above is correct.

If the number employed is 190 million, the working-age population is 230 million, and
the number unemployed is 10 million, then the unemployment rate is
A) 5%.
B) 5.2%.
C) 8%.
D) 10%.
E) 50%.
As a percentage of GDP, imports are greater than exports for which of the following
countries?
A) Germany
B) Japan
C) the Netherlands
D) the United States
An increase in cyclical unemployment will result in
A) an increase in the natural rate of unemployment.
B) an increase in the unemployment rate.

C) an increase in structural unemployment.
D) a decrease in frictional unemployment.
If the exchange rate changes from $2.00 = £1 to $2.01 = £1 then
A) the dollar has depreciated.
B) the dollar has appreciated.
C) the British pound has depreciated.
D) the British pound has stayed constant in value.