
If the Kenyan nominal exchange rate declines, and prices are unchanged in Kenya and
abroad, then the Kenyan real exchange rate
a. does not change.
b. rises.
c. declines
d. None of the above is necessarily correct.
An increase in the real interest rate in the United States changes the quantity of loanable
funds demanded because
a. U.S. residents will want to buy more foreign assets.
b. Foreign residents will want to buy more U.S. goods and services.
c. U.S. firms will want to purchase fewer U.S. capital goods.
d. All of the above are correct.
In 2010, income per person in the United States was about 14 times that in India.
a. True
b. False

The chair of the Board of Governors regularly testifies to Congress about Fed policy.
a. True
b. False
Prices allocate a market economy’s scarce resources.
a. True
b. False
Table 3-3
ProductionOpportunities

Refer to Table3-3. We could use the information in the table to draw a production
possibilities frontier for England and a second production possibilities frontier for
France. If we were to do this, measuring cheese along the horizontal axis, then
a. the slope of England’s production possibilities frontier would be 4 and the slope of
France’s production possibilities frontier would be -0.4.
b. the slope of England’s production possibilities frontier would be 0.25 and the slope of
France’s production possibilities frontier would be -2.5.
c. the slope of England’s production possibilities frontier would be 0.25 and the slope of
France’s production possibilities frontier would be 2.5.
d. the slope of England’s production possibilities frontier would be 4 and the slope of
France’s production possibilities frontier would be 0.4.
Suppose that a country has an inflation rate of about 2 percent per year and a real GDP
growth rate of about 2.5 percent per year. Then the government can have a deficit of
about
a. 5 percent of GDP without raising the debt-to-income ratio.
b. 4.5 percent of GDP without raising the debt-to-income ratio.
c. 1.25 percent of GDP without raising the debt-to-income ratio.
d. .5 percent of GDP without raising the debt-to-income ratio.

The term economists use to describe a situation in which the economy’s overall price
level is rising is
a. growth.
b. inflation.
c. recession.
d. expansion.
A U.S. firm buys apples from New Zealand with New Zealand dollars it got in
exchange for U.S. dollars. New Zealand residents then use these dollars to purchase
oranges from the U.S. Which of the following increases?
a. New Zealand’s net capital outflow and New Zealand’s net exports
b. only New Zealand’s net exports
c. only New Zealand’s net capital outflow
d. neither New Zealand’s net exports nor New Zealand’s capital outflow
Which of the following actions best illustrates adverse selection?
a. A person purposely chooses bonds of corporations with high default risk because of
the high returns.
b. A person dislikes losing $400 more than he likes winning $400.
c. After obtaining automobile insurance a person drives less carefully than before.
d. A person intending to take up dangerous hobbies applies for life insurance.
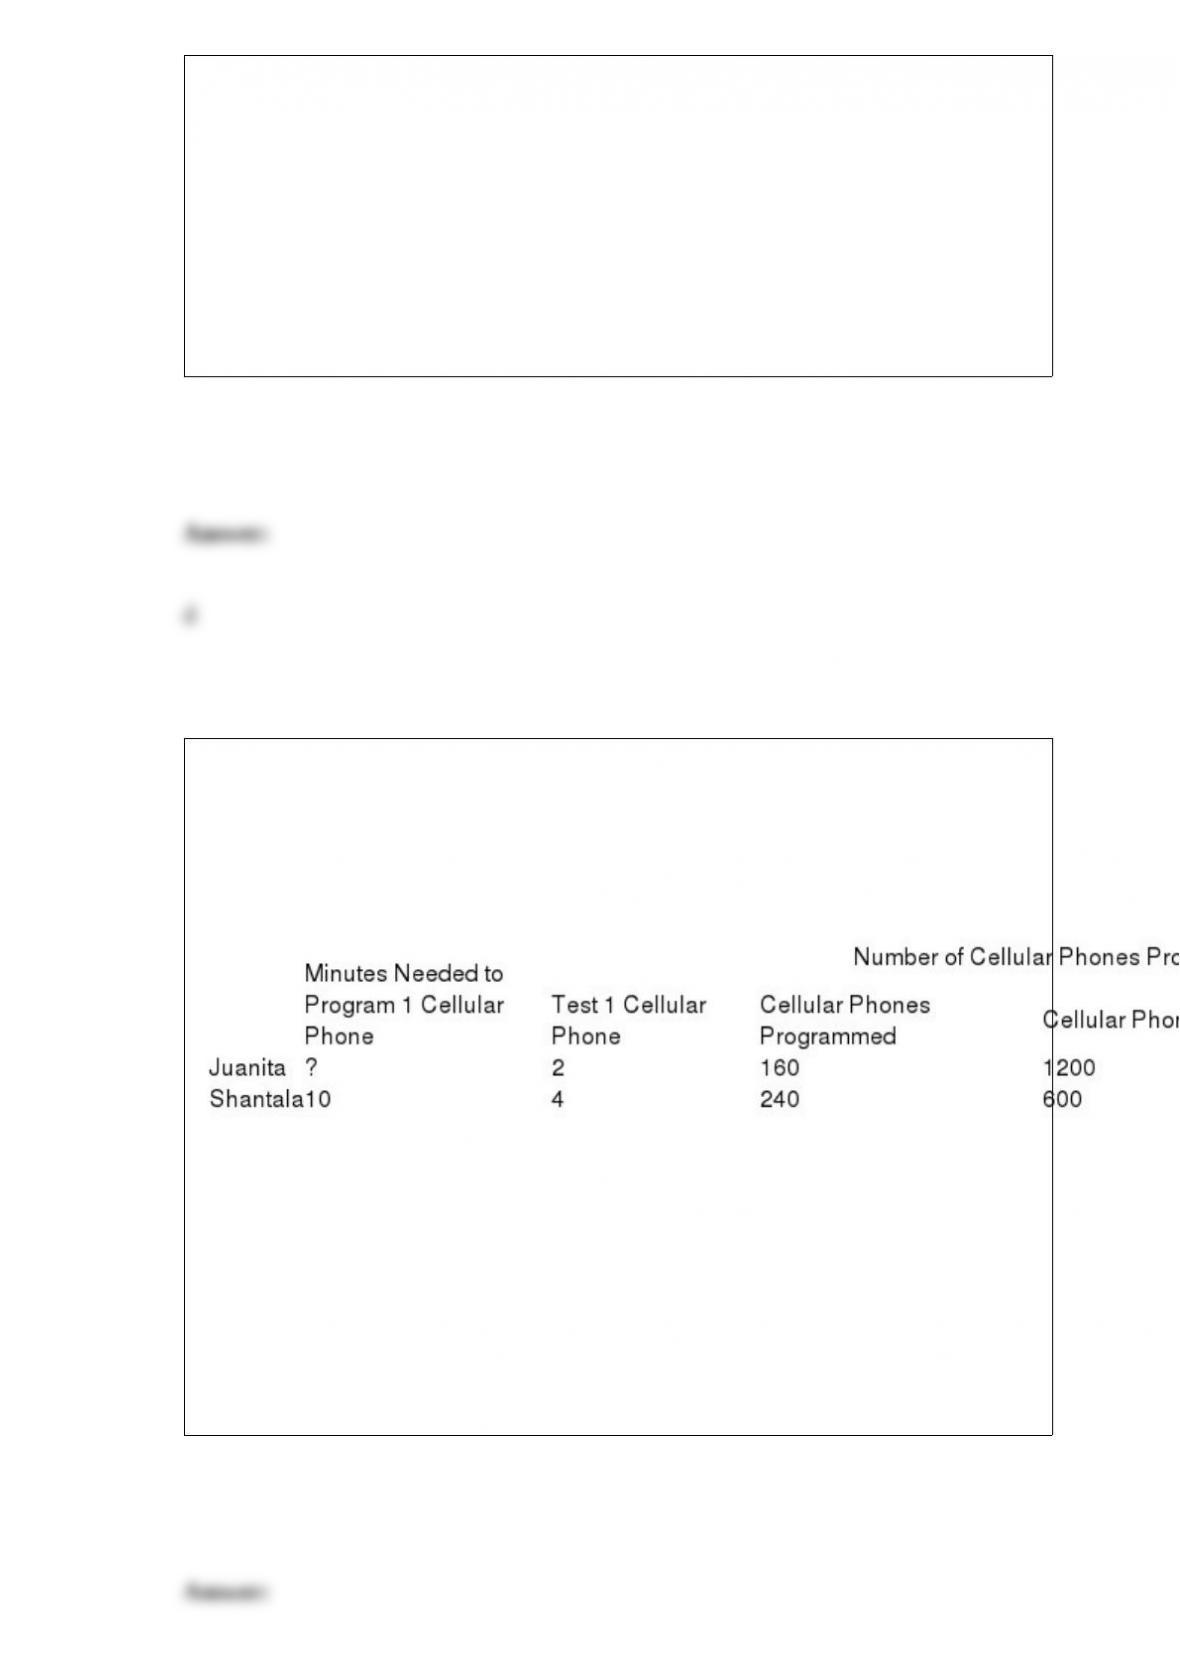
Table 3-13
Juanita and Shantala run a business that programs and tests cellular phones. Assume
that Juanita and Shantala can switch between programming and testing cellular phones
at a constant rate. The following table applies.
Refer to Table3-13. Which of the following points would be on Shantala’s production
possibilities frontier, based on a 40-hour week?
a. (120 cellular phones programmed, 250 cellular phones tested)
b. (180 cellular phones programmed, 150 cellular phones tested)
c. (240 cellular phones programmed, 600 cellular phones tested)
d. More than one of the above would be on Shantala’s production possibilities frontier.
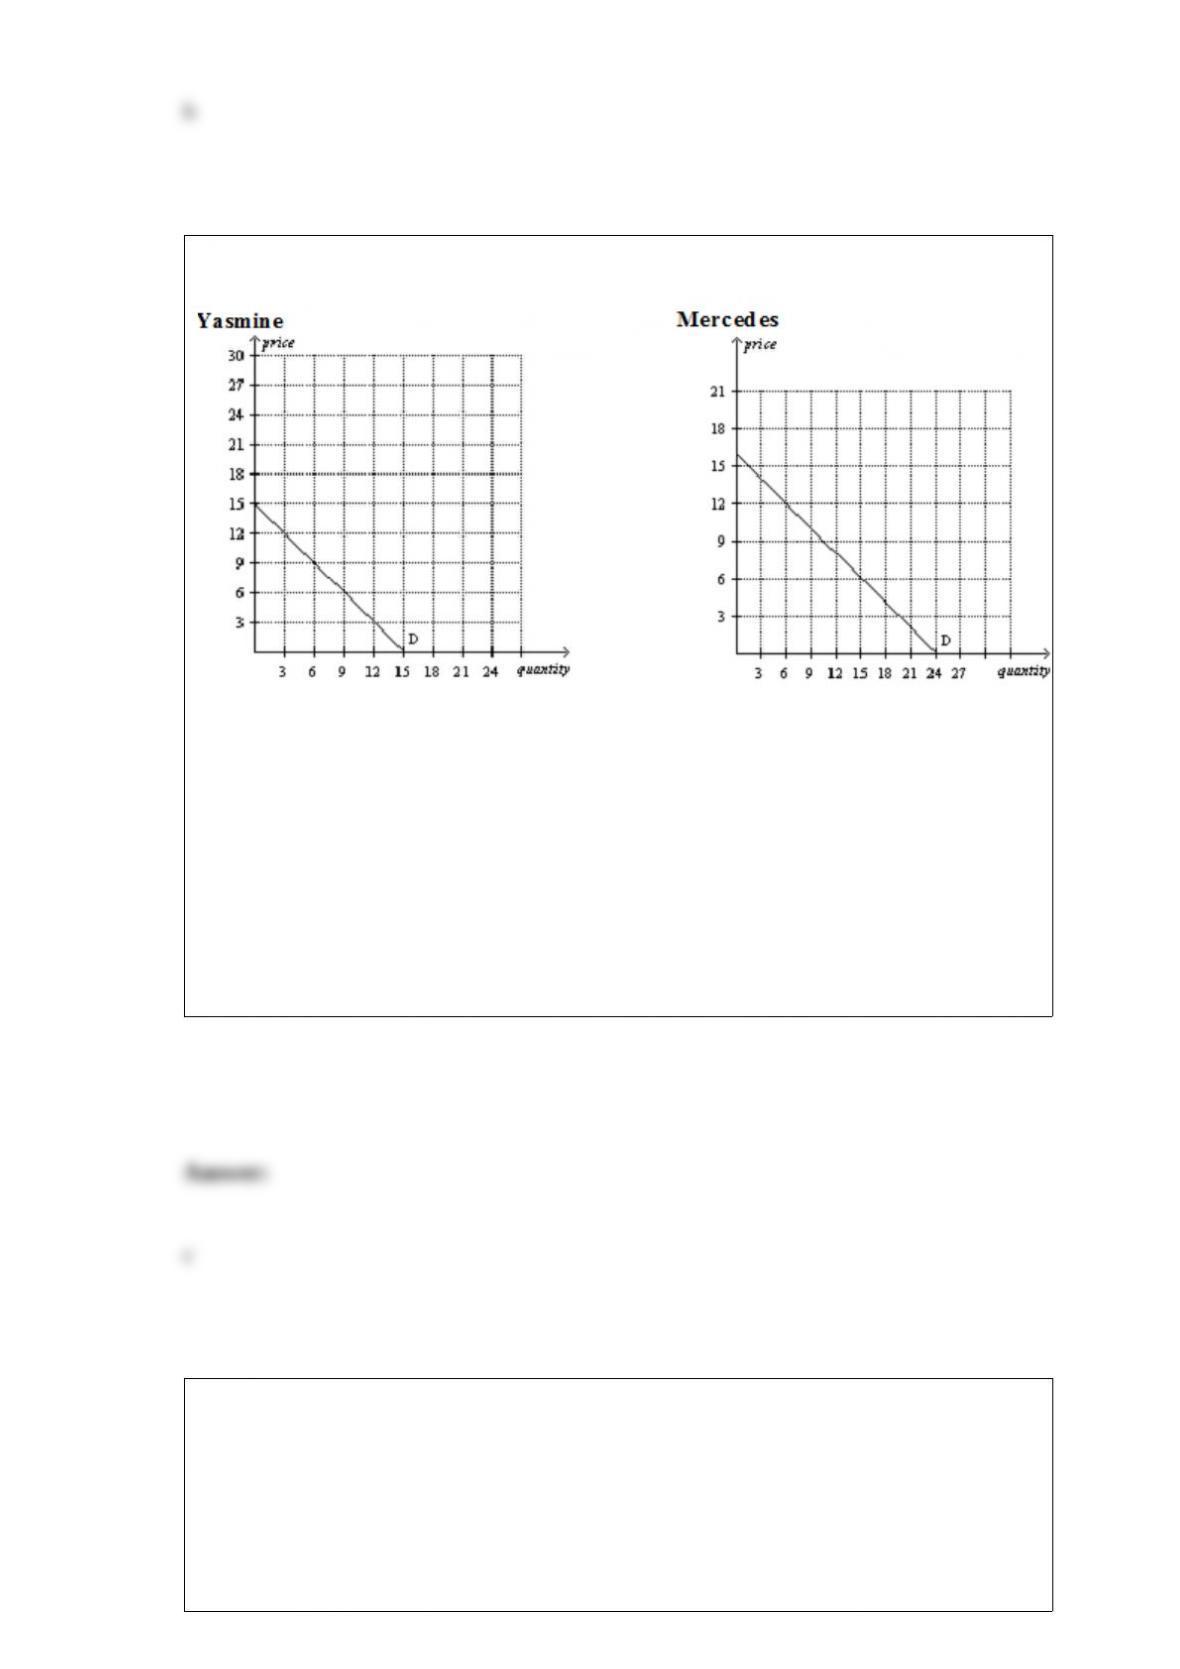
Figure 4-4
RefertoFigure4-4.If Yasmine and Mercedes are the only two consumers in the market,
then the market quantity demanded at a price of $12 is
a. 3 units.
b. 6 units.
c. 9 units.
d. 12 units.
Mary looks over reports on four of her workers. Jack made 30 baskets in 5 hours. Rudy
made 32 baskets in 8 hours. Sam made 40 baskets in 12 hours. Walter made 22 baskets
in four hours. Who has the greatest productivity?
a. Jack
b. Rudy

c. Sam
d. Walter
Which of the following countries achieved higher economic growth, in part by
mandating a reduction in population growth?
a. Great Britain
b. China
c. Australia
d. France
To say that government intervenes in the economy to promote efficiency is to say that
government is attempting to
a. create a more fair distribution of income.
b. change the way in which the economic pie is divided.
c. enlarge the economic pie.
d. All of the above are correct.

When the Federal Reserve sells assets from its portfolio to the public with the intent of
changing the money supply,
a. those assets are government bonds and the Fed’s reason for selling them is to increase
the money supply.
b. those assets are government bonds and the Fed’s reason for selling them is to
decrease the money supply.
c. those assets are items that are included in M2 and the Fed’s reason for selling them is
to increase the money supply.
d. those assets are items that are included in M2 and the Fed’s reason for selling them is
to decrease the money supply.
One plausible explanation for the large amount of U.S. currency outstanding is that
many dollars are held abroad.
a. True
b. False

Political Instability Abroad
Suppose that political instability in other countries makes people fear for the value of
their assets in these countries so that they desire to purchase more U.S assets.
RefertoPoliticalInstabilityAbroad.What would the change in the exchange rate make
happen to U.S. net exports and U.S. aggregate demand?
a. Net exports would rise which by itself would increase U.S. aggregate demand.
b. Net exports would rise which by itself would decrease U.S. aggregate demand.
c. Net exports would fall which by itself would increase U.S. aggregate demand.
d. Net exports would fall which by itself would decrease U.S. aggregate demand.
If the quantity of loanable funds supplied is less than the quantity demanded, then there
is a
a. shortage of loanable funds and the interest rate will fall.
b. shortage of loanable funds and the interest rate will rise.
c. surplus of loanable funds and the interest rate will fall.
d. surplus of loanable funds and the interest rate will rise.

Differences in opportunity cost allow for gains from trade.
a. True
b. False
In the last half of 1999, the U.S. unemployment rate was about 4 percent. Historical
experience suggests that this is
a. above the natural rate, so real GDP growth was likely low.
b. above the natural rate, so real GDP growth was likely high.
c. below the natural rate, so real GDP growth was likely low.
d. below the natural rate, so real GDP growth was likely high.
Fiscal policy is determined by
a. the president and Congress and involves changing government spending and taxation.
b. the president and Congress and involves changing the money supply.
c. the Federal Reserve and involves changing government spending and taxation.

d. the Federal Reserve and involves changing the money supply.
Warrensburg is a small college town in Missouri. At the end of August each year, the
market demand for fast food in Warrensburg
a. increases.
b. decreases.
c. remains constant, but we observe a movement downward and to the right along the
demand curve.
d. remains constant, but we observe a movement upward and to the left along the
demand curve.
Commodity money is
a. backed by gold.
b. the principal type of money in use today.
c. money with intrinsic value.
d. receipts created in international trade that are used as a medium of exchange.

Consider the money market drawn with the value of money on the vertical axis. If
money demand is unchanged and the price level rises, then
a. the money supply must have increased, perhaps because the Fed bought bonds.
b. the money supply must have increased, perhaps because the Fed sold bonds.
c. the money supply must have decreased, perhaps because the Fed bought bonds.
d. the money supply must have decreased, perhaps because the Fed sold bonds.
The long-run aggregate supply curve shifts right if
a. either immigration from abroad increases or technology improves.
b. immigration from abroad increases, but not if technology improves.
c. technology improves, but not if immigration from abroad increases.
d. None of the above are correct.

Wages in excess of their equilibrium level help explain
a. structural unemployment but not the natural rate of unemployment.
b. the natural rate of unemployment but not structural unemployment.
c. both structural unemployment and the natural rate of unemployment.
d. neither structural unemployment nor the natural rate of unemployment.
Which of the following is consistent with moving from a surplus to equilibrium in the
market for foreign-currency exchange?
a. the exchange rate appreciates making domestic goods relatively more expensive.
b. the exchange rate appreciates making domestic goods relatively less expensive.
c. the exchange rate depreciates making domestic goods relatively more expensive.
d. the exchange rate depreciates making domestic goods relatively less expensive.
In the long run, an increase in the money supply
a. leaves prices and unemployment unchanged.
b. raises prices and unemployment.

c. raises prices and leaves unemployment unchanged.
d. leaves prices unchanged and reduces unemployment.
Suppose a central bank takes actions that will lead to a higher inflation rate. The public,
however, is slow to adjust its expectation of inflation. Then, in the short run,
unemployment
a. rises. As inflation expectations adjust, the short-run Phillips curve shifts right.
b. rises. As inflation expectations adjust, the short-run Phillips curve shifts left.
c. falls. As inflation expectations adjust, the short-run Phillips curve shifts right.
d. falls. As inflation expectations adjust, the short-run Phillips curve shifts left.
If the reserve ratio is 8 percent, then a decrease in reserves of $6,000 can cause the
money supply to fall by as much as
a. $48,000.
b. $75,000.
c. $55,200.
d. $10,800.

The country of Robinya has a tax system identical to that of the United States. Suppose
someone in Robinya bought a parcel of land for 10,000 deera (the local currency) in
1970 when the price index equaled 100. In 2010, the person sold the land for 100,000
deera, and the price index equaled 500. The tax rate on nominal capital gains was 20
percent. Compute the taxes the person paid on the nominal gain and the change in the
real value of the land in terms of 2010 prices to find the after-tax real rate of capital
gain.
a. -20 percent
b. 20 percent
c. 42 percent
d. 64 percent