
Scenario 5.2:
Randy and Samantha are shopping for new cars (one each). Randy expects to pay
$15,000 with 1/5 probability and $20,000 with 4/5 probability. Samantha expects to pay
$12,000 with 1/4 probability and $20,000 with 3/4 probability.
Refer to Scenario 5.2. Which of the following is true?
A) Randy has a higher expected expense than Samantha for the car.
B) Randy has a lower expected expense than Samantha for the car.
C) Randy and Samantha have the same expected expense for the car, and it is somewhat
less than $20,000.
D) Randy and Samantha have the same expected expense for the car: $20,000.
E) It is not possible to calculate the expected expense for the car until the true
probabilities are known.
Alvin’s preferences for good X and good Y are shown in the diagram below.
Figure 3.1
Refer to Figure 3.1. Which assumption concerning preferences do Alvin’s indifference

curves violate?
A) Diminishing marginal rates of substitution
B) Transitivity of preferences
C) More is preferred to less
D) Completeness
A bilateral monopoly is characterized by a market with a single buyer and a single
seller. Which factor is most likely to determine the market outcome in this situation?
A) Share of total costs that are fixed
B) Degree of demand elasticity
C) Degree of supply elasticity
D) Bargaining power of the firms
The law of diminishing returns assumes that
A) there is at least one fixed input.
B) all inputs are changed by the same percentage.

C) additional inputs are added in smaller and smaller increments.
D) all inputs are held constant.
Scenario 12.1:
Suppose mountain spring water can be produced at no cost and that the demand and
marginal revenue curves for mountain spring water are given as follows:
Q = 6000 – 5P MR = 1200 – 0.4Q
Refer to Scenario 12.1. What will be the price in the long run if the industry is a
Cournot duopoly?
A) $400
B) $600
C) $800
D) $900
E) Competition will drive the price to zero.
People often use probability statements to describe events that can only happen once.
For example, a political consultant may offer their opinion about the probability that a

particular candidate may win the next election. Probability statements like these are
based on ________ probabilities.
A) frequency-based
B) objective
C) subjective
D) universally known
Although firms earn zero profits in the long run, why is the outcome from monopolistic
competition considered to be inefficient?
A) Price exceeds marginal cost.
B) Quantity is lower than the perfectly competitive outcome.
C) Goods are not identical.
D) A and B are correct.
E) B and C are correct.
The difference between what a consumer is willing to pay for a unit of a good and what
must be paid when actually buying it is called

A) producer surplus.
B) consumer surplus.
C) cost benefit analysis.
D) net utility.
An important factor that contributes to labor productivity growth is:
A) growth in the capital stock.
B) technological change.
C) the standard of living.
D) A and B only
E) A, B, and C are correct.
Albatross Software has two main products: WindSong is a program that can be used to
edit audio files and SunBurst is a program that can be used to edit digital photos. The
two major types of customers are small businesses and home users. The small business
customers have a reservation price of $300 for WindSong and $450 for SunBurst. The
home users have a reservation price of $100 for WindSong and $125 for SunBurst.
Which of the following statements is true?

A) Bundling the two software products is not likely to be profitable because the
marginal cost of producing software is positive by very small.
B) Bundling the two software products is not likely to be profitable because the
consumer demands are homogeneous.
C) Bundling the two software products is likely to be profitable because the demands
are negatively correlated.
D) Bundling the two software products is not likely to be profitable because the
demands are positively correlated.
What is net marginal revenue?
A) The same as marginal profit.
B) The additional revenue the firm earns from an extra unit of an internally produced
intermediate input.
C) The additional revenue the firm earns from producing one more unit of output.
D) The additional revenue the firm earns from selling one more unit of output.
Scenario 10.3:
The demand curve and marginal revenue curve for red herrings are given as follows:

Q = 250 – 5P
MR = 50 – 0.4Q
Refer to Scenario 10.3. Compared to a competitive red herring industry, the
monopolistic red herring industry
A) produces more output at a higher price.
B) produces less output at a higher price.
C) produces more output at a lower price.
D) produces less output at a lower price.
E) not enough information to relate the monopolistic red herring industry to a
competitive industry.
A Giffen good
A) is always the same as an inferior good.
B) is the special subset of inferior goods in which the substitution effect dominates the
income effect.
C) is the special subset of inferior goods in which the income effect dominates the
substitution effect.
D) must have a downward sloping demand curve.
Which of the following statements identifies a key difference between condominiums
and cooperative housing?
A) Condos tends to be less expensive.
B) Condo owners are not responsible for maintaining the common spaces in the
building.
C) Co-op owners have more control over who can move into their building.
D) Co-op owners generally commit less time to the building governance.
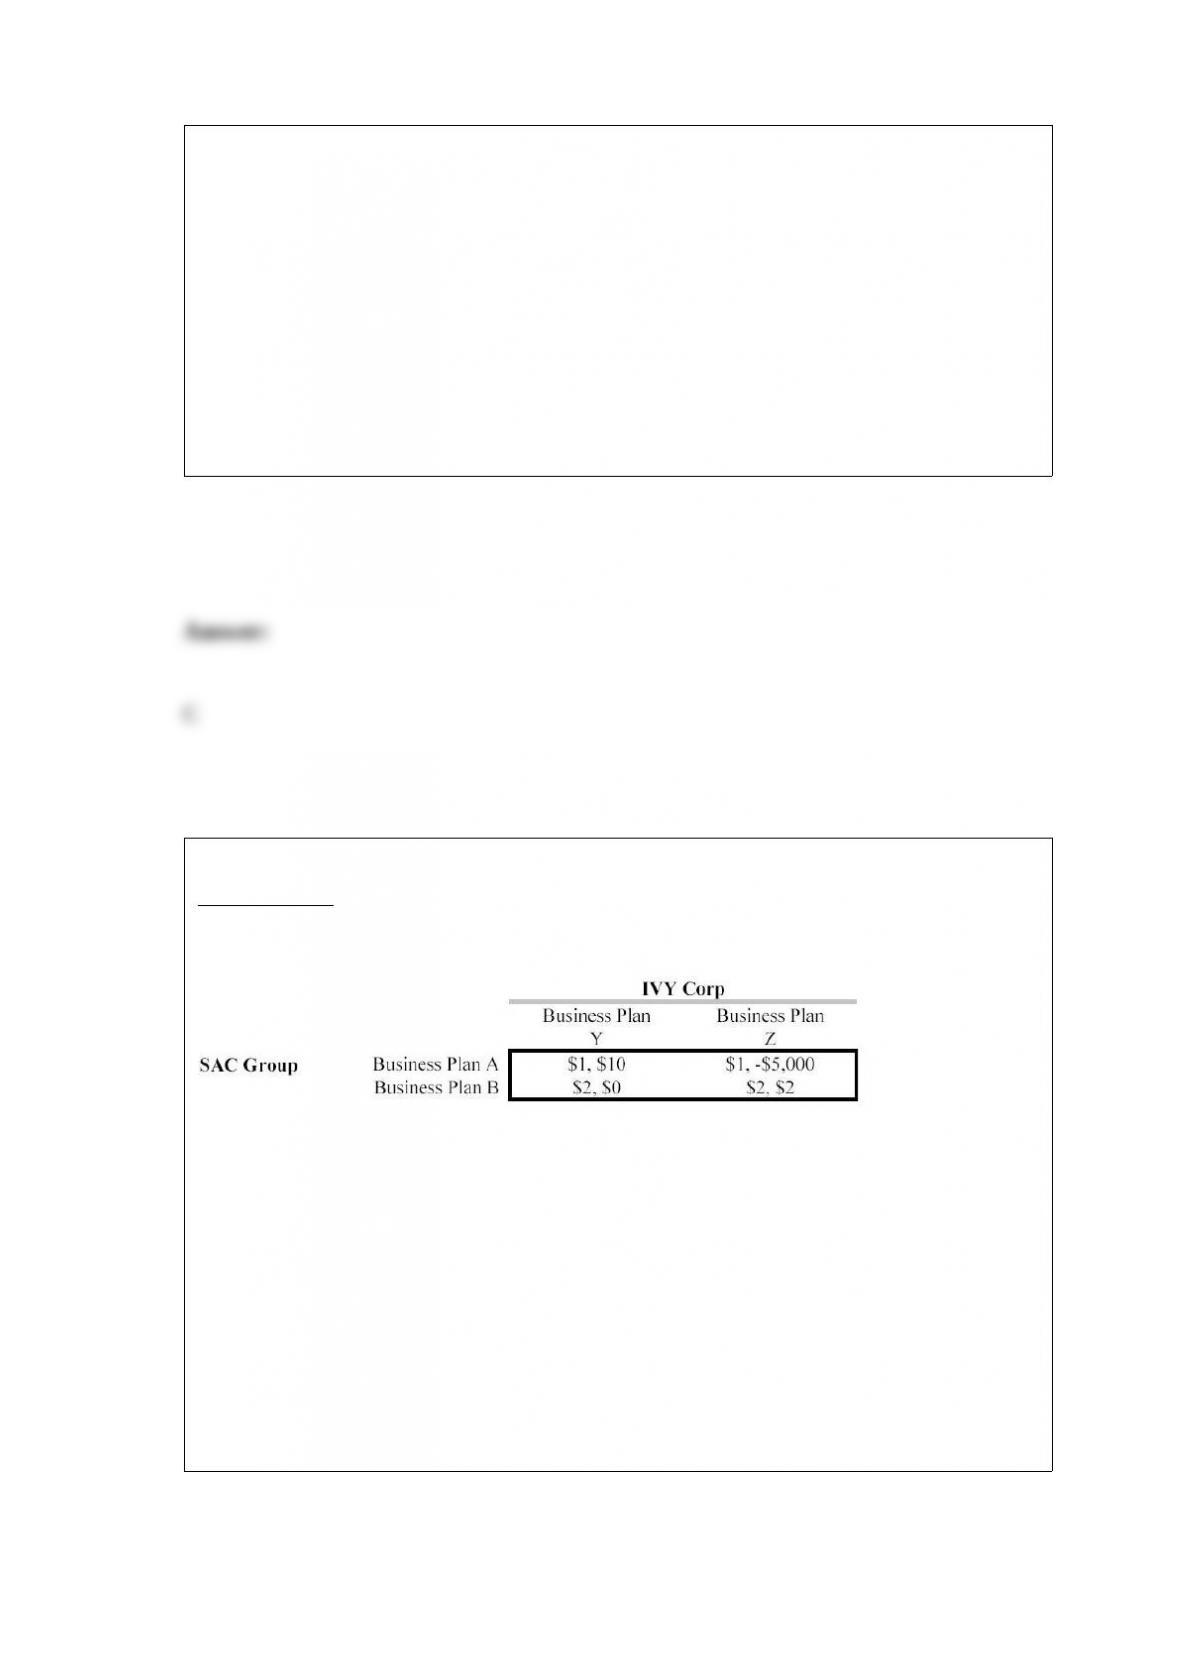
Scenario 13.8
Consider the following game:
The game in Scenario 13.8 is
A) variable-sum.
B) constant-sum.
C) cooperative.
D) a Prisoner’s Dilemma.
E) a Conjoint Crux.

In a supply-and-demand graph, producer surplus can be pictured as the
A) vertical intercept of the supply curve.
B) area between the demand curve and the supply curve to the left of equilibrium
output.
C) area under the supply curve to the left of equilibrium output.
D) area under the demand curve to the left of equilibrium output.
E) area between the equilibrium price line and the supply curve to the left of
equilibrium output.
Suppose the nominal price of gasoline was $0.90 per gallon in 1987. To convert this
value to the real price of 1987 gasoline in 2012 dollars, we should:
A) multiply by the 1987 CPI and divide by the 2012 CPI.
B) multiply by the 2012 CPI and divide by the 1987 CPI.
C) not do anything because this is the real price in 2012 dollars.
D) none of the above

Scenario 10.2:
A monopolist faces the following demand curve, marginal revenue curve, total cost
curve and marginal cost curve for its product:
Q = 200 – 2P
MR = 100 – Q
TC = 5Q
MC = 5
Refer to Scenario 10.2. How much profit does the monopolist earn?
A) $4512.50
B) $4987.50
C) $475.00
D) $5.00
Consider the following diagram where a perfectly competitive firm faces a price of $40.
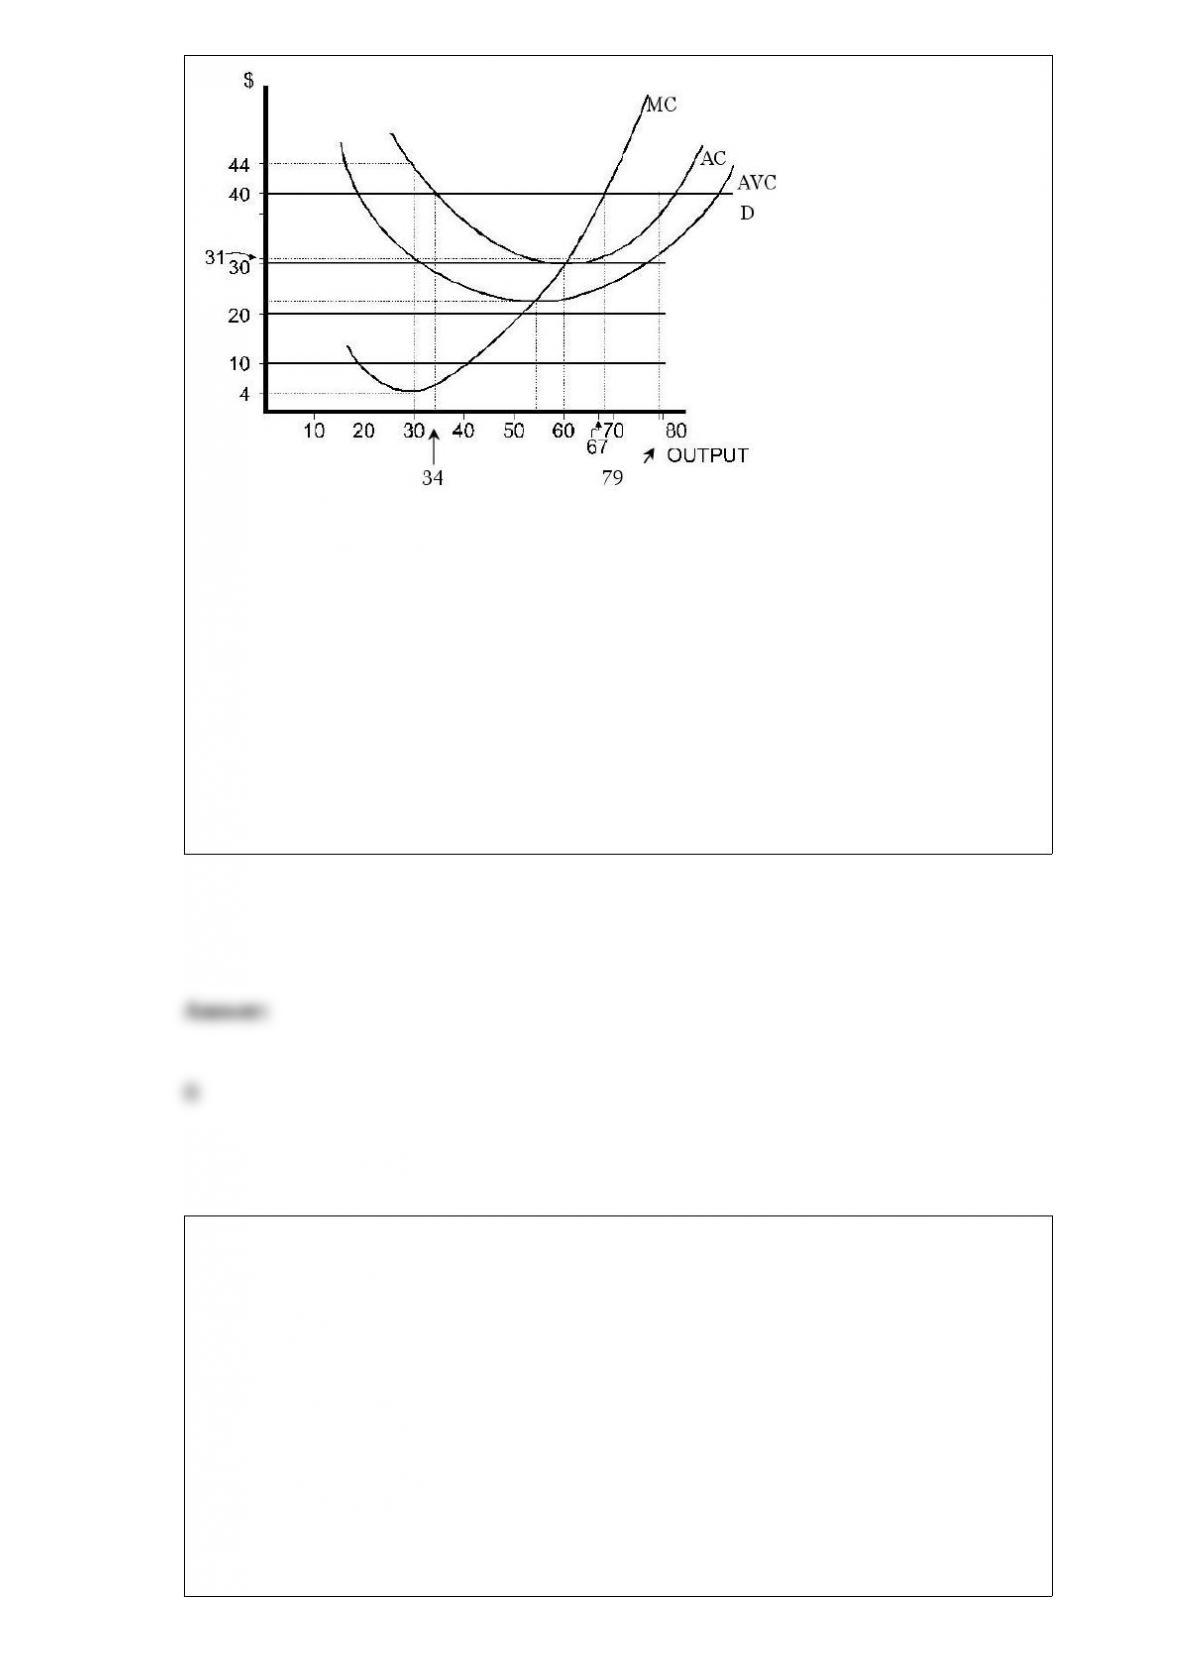
At the profit-maximizing level of output, AVC is
A) $22.
B) $26.
C) $30.
D) $32.
E) $40.
Assume that a particular state has decided to outlaw the sharing of individuals’ credit
histories as an illegal invasion of privacy. As a result of this action we would expect the
A) cost of borrowing money to rise.
B) number of loans to unworthy credit risks to rise.
C) problems of asymmetric information to become more severe.
D) all of the above
E) none of the above

Clarke Mementos manufactures small figurines that they sell to retailers around the
country. Clarke sells the figurines for $5.00 each, a price the firm considers given.
Clarke’s production function is given by the expression:
Q = 60L – 0.5L2,
where Q = number of figurines per day, and L = number of skilled workers per day.
Based on this production function, the average and marginal products of labor are as
follows:
AP = 60 – 0.5L MP = 60 – L
a. Write an expression for the firm’s marginal revenue product.
b. Clarke currently pays $150 per day (including fringe benefits) for each of its skilled
workers. How many workers should the firm employ?
c. Clarke’s workers are highly skilled artisans with a great deal of job mobility. The
firm’s managers fear that they must increase the workers’ total compensation to $200
per day to remain competitive. What impact would the wage increase have upon the
firm’s employment?

When labor usage is at 12 units, output is 36 units. From this we may infer that
A) the marginal product of labor is 3.
B) the total product of labor is 1/3.
C) the average product of labor is 3.
D) none of the above

The kinked demand curve model is based on the assumption that each firm
A) considers its rival’s output to be fixed.
B) considers its rival’s price to be fixed.
C) believes rivals will match all price changes.
D) believes rivals will never match price changes.
E) none of the above
In the United States, major league baseball is exempt from antitrust laws. Before 1975,
the baseball team owners agreed to hold an annual draft of amateur baseball players.
Once the players were drafted and signed by a team, they were effectively tied to that
team for life. Before 1975, professional baseball players were paid:
A) less than their marginal revenue product.
B) their marginal revenue product.
C) more than their marginal revenue product.
D) none of the above is necessarily correct.

Laughlin and Sons is a company that provides estate planning services to 100 wealthy
clients. Although the clients have different wealth levels, their demands for the hourly
estate planning services are identical. The aggregate annual demand for estate planning
services facing Laughlin and Sons is Q = 20000 – 200P where Q is the total hours of
estate planning services and P is the hourly rate charged for the services, and the firm’s
total cost of providing the estate planning services is TC = 80Q. The firm wants to
establish a two-part tariff scheme for charging the clients, and the fees include an
annual fixed retainer (entry fee) plus an hourly rate (usage fee).
a. What is the firm’s marginal cost of providing estate planning services? What is the
demand curve for a representative client?
b. What are the profit maximizing levels for the retainer and hourly rate? What is the
firm’s aggregate annual profit under the two-part tariff scheme?
c. Suppose Laughlin and Sons has a local monopoly on estate planning services. What
are the profit maximizing hourly rate (price) and quantity under a single-price
monopoly? How does the profit earned under the single-price monopoly compare to the
profit earned under the two-part tariff scheme?

When new technologies make cleaner production possible,
A) emissions would fall under a system of fees, but would not fall under a system of
transferable emissions permits unless the government bought back some of the permits.
B) emissions would fall under a system of permits, but would not fall under a system of
fees unless the government raised them.
C) the price of transferable permits would rise.
D) the quantity of transferable permits would rise.
E) the quantity of transferable permits would fall.
Technological improvement
A) can hide the presence of diminishing returns.
B) can be shown as a shift in the total product curve.
C) allows more output to be produced with the same combination of inputs.
D) All of the above are true.

The indifference curves of two investors are plotted against a single budget line.
Indifference curve A is shown as tangent to the budget line at a point to the left of
indifference curve B’s tangency to the same line.
A) Investors A and B are equally risk averse.
B) Investor A is more risk averse than investor B.
C) Investor A is less risk averse than investor B.
D) It is not possible to say anything about the risk aversion of the two investors, but
they will hold the same portfolio.
E) It is not possible to say anything about either the risk aversion or the portfolio of the
two investors.
In 1992, the Occupational Safety and Health Authority passed the Bloodborne
Pathogens Standard (BBP), which regulates dental office procedures. This regulation is
designed to minimize the transmission of infectious disease from patient to dental
worker. The effect of this regulation was both to increase the cost of providing dental
care and to ease the fear of going to the dentist as the risk of contracting an infectious
disease.
What is the effect of the BBP on the equilibrium price of dental care?
A) It unambiguously increases.
B) It unambiguously decreases.
C) It increases only if supply shifts more than demand.
D) It increases only if demand shifts more than supply.

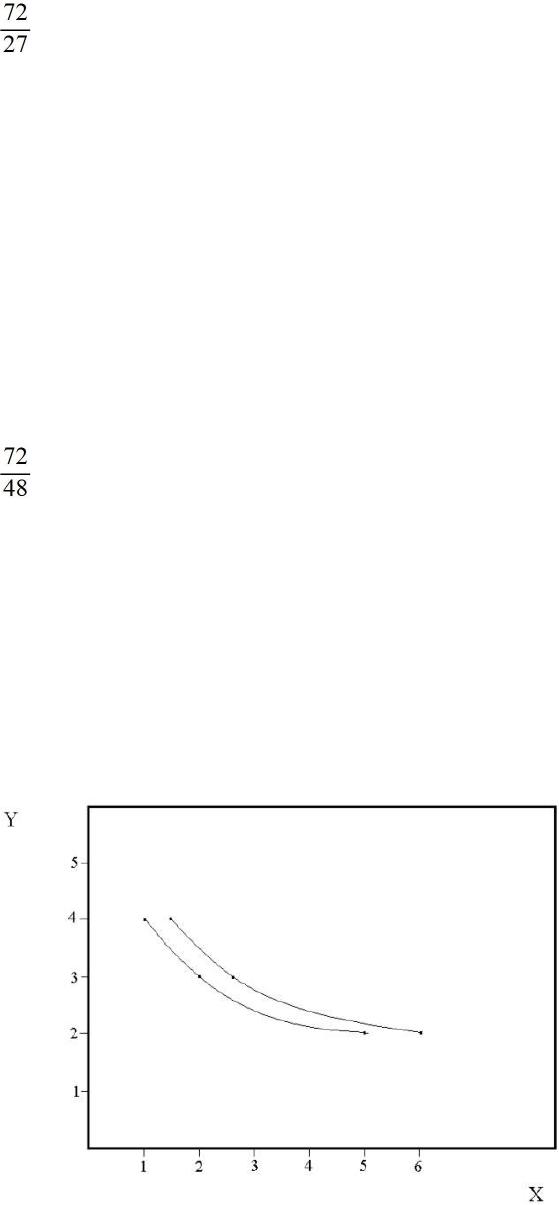
Sally consumes two goods, X and Y. Her utility function is given by the expression U =
3 ∙ XY2. The current market price for X is $10, while the market price for Y is $5.
Sally’s current income is $500.
a. Sketch a set of two indifference curves for Sally in her consumption of X and Y.
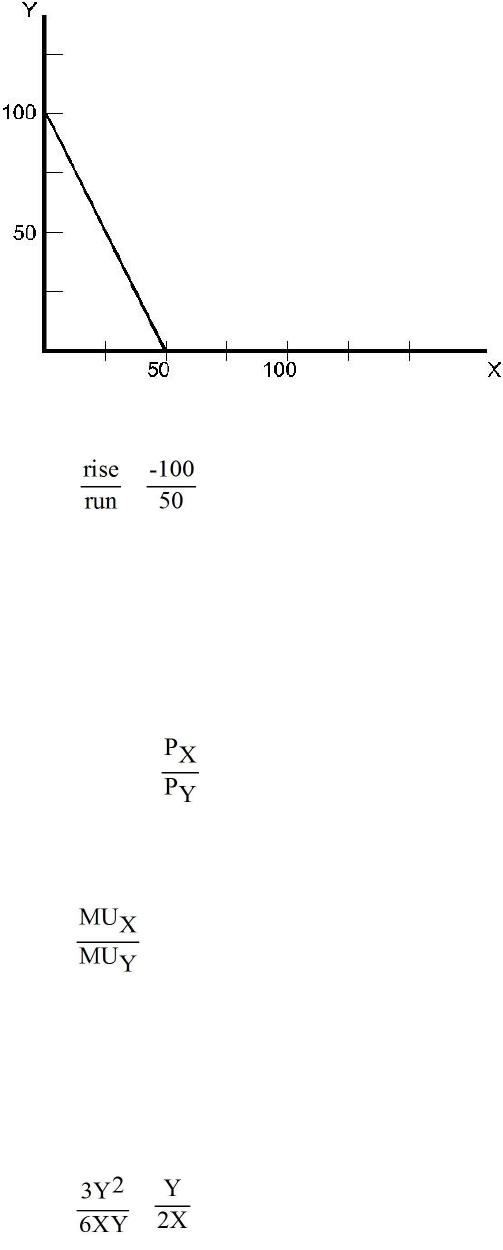
b. Write the expression for Sally’s budget constraint. Graph the budget constraint and
determine its slope.
c. Determine the X,Y combination which maximizes Sally’s utility, given her budget
constraint. Show her optimum point on a graph. (Partial units for the quantities are
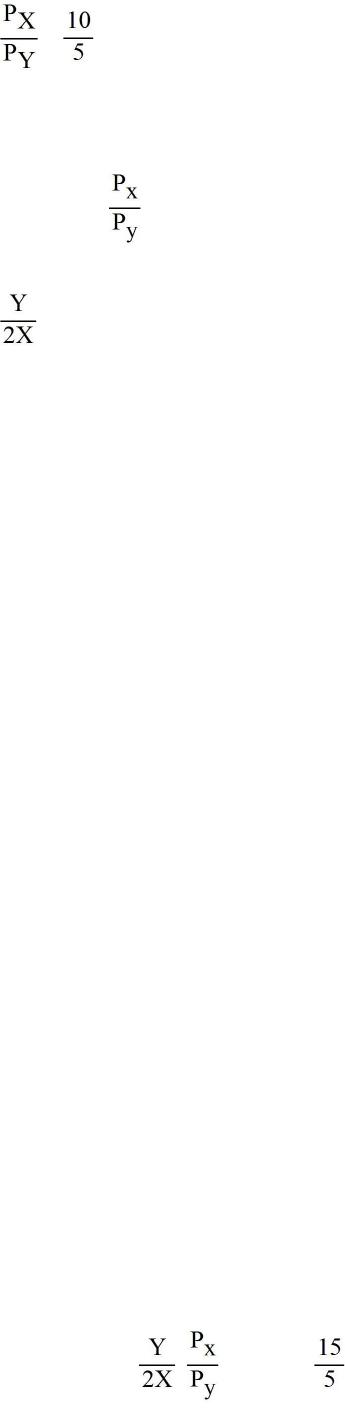
possible.) (Note: MUY = 6XY and MUX = 3Y2.)
d. Calculate the impact on Sally’s optimum market basket of an increase in the price of
X to $15. What would happen to her utility as a result of the price increase?

In comparing the Cournot equilibrium with the competitive equilibrium,
A) both profit and output level are higher in Cournot.
B) both profit and output level are higher in the competitive equilibrium.
C) profit is higher, and output level is lower in the competitive equilibrium.

D) profit is higher, and output level is lower in Cournot.
The ________ elastic a firm’s demand curve, the greater its ________.
A) less; monopoly power
B) less; output
C) more; monopoly power
D) more; costs
If households could be charged differently for different types of garbage,
A) the total amount of garbage would be reduced.
B) recycling would be more difficult.
C) costs of collecting garbage could be kept much lower.
D) billing for garbage collection would be much easier.
E) there would be a change in the types of items that are disposed of as garbage.

If a market basket is changed by adding more of at least one good, then rational
consumers will:
A) rank the market basket more highly after the change.
B) more likely prefer a different market basket.
C) rank the market basket as being just as desirable as before.
D) be unable to decide whether the first market basket is preferred to the second or vice
versa.
E) have indifference curves that cross.
Trisha’s Fashion Boutique production function for dresses is y(K, L) = K1/2L1/3, where
K is the number of sewing machines and L is the amount of labor hours employed.
Trisha pays $15 per labor hour and sells each dress for $87.50. Also, Trisha currently
has 4 sewing machines. Fill in the table below. How many units of labor will Trisha
employ before the value of the marginal product of labor is less than the cost of a labor
hour?
Internet service in the local market is supplied by Laura’s Internet Service. The demand
is
QD = 6,500 – 100P <=>P = 65 – 0.01Q. Laura’s marginal cost function is
MC(Q) = 6.67 + 0.0067Q
If Laura practices first-degree price discrimination, what are consumer surplus and
Laura’s producer surplus in this market? Does Laura’s market power and first-degree
price discrimination result in reduced societal welfare?
The nominal price of milk was $2.25 in 1998 while the CPI was 163.0 that year. Also,
the CPI in 1970 was 38.8. What was the real value of 1998 milk in terms of 1970
dollars?
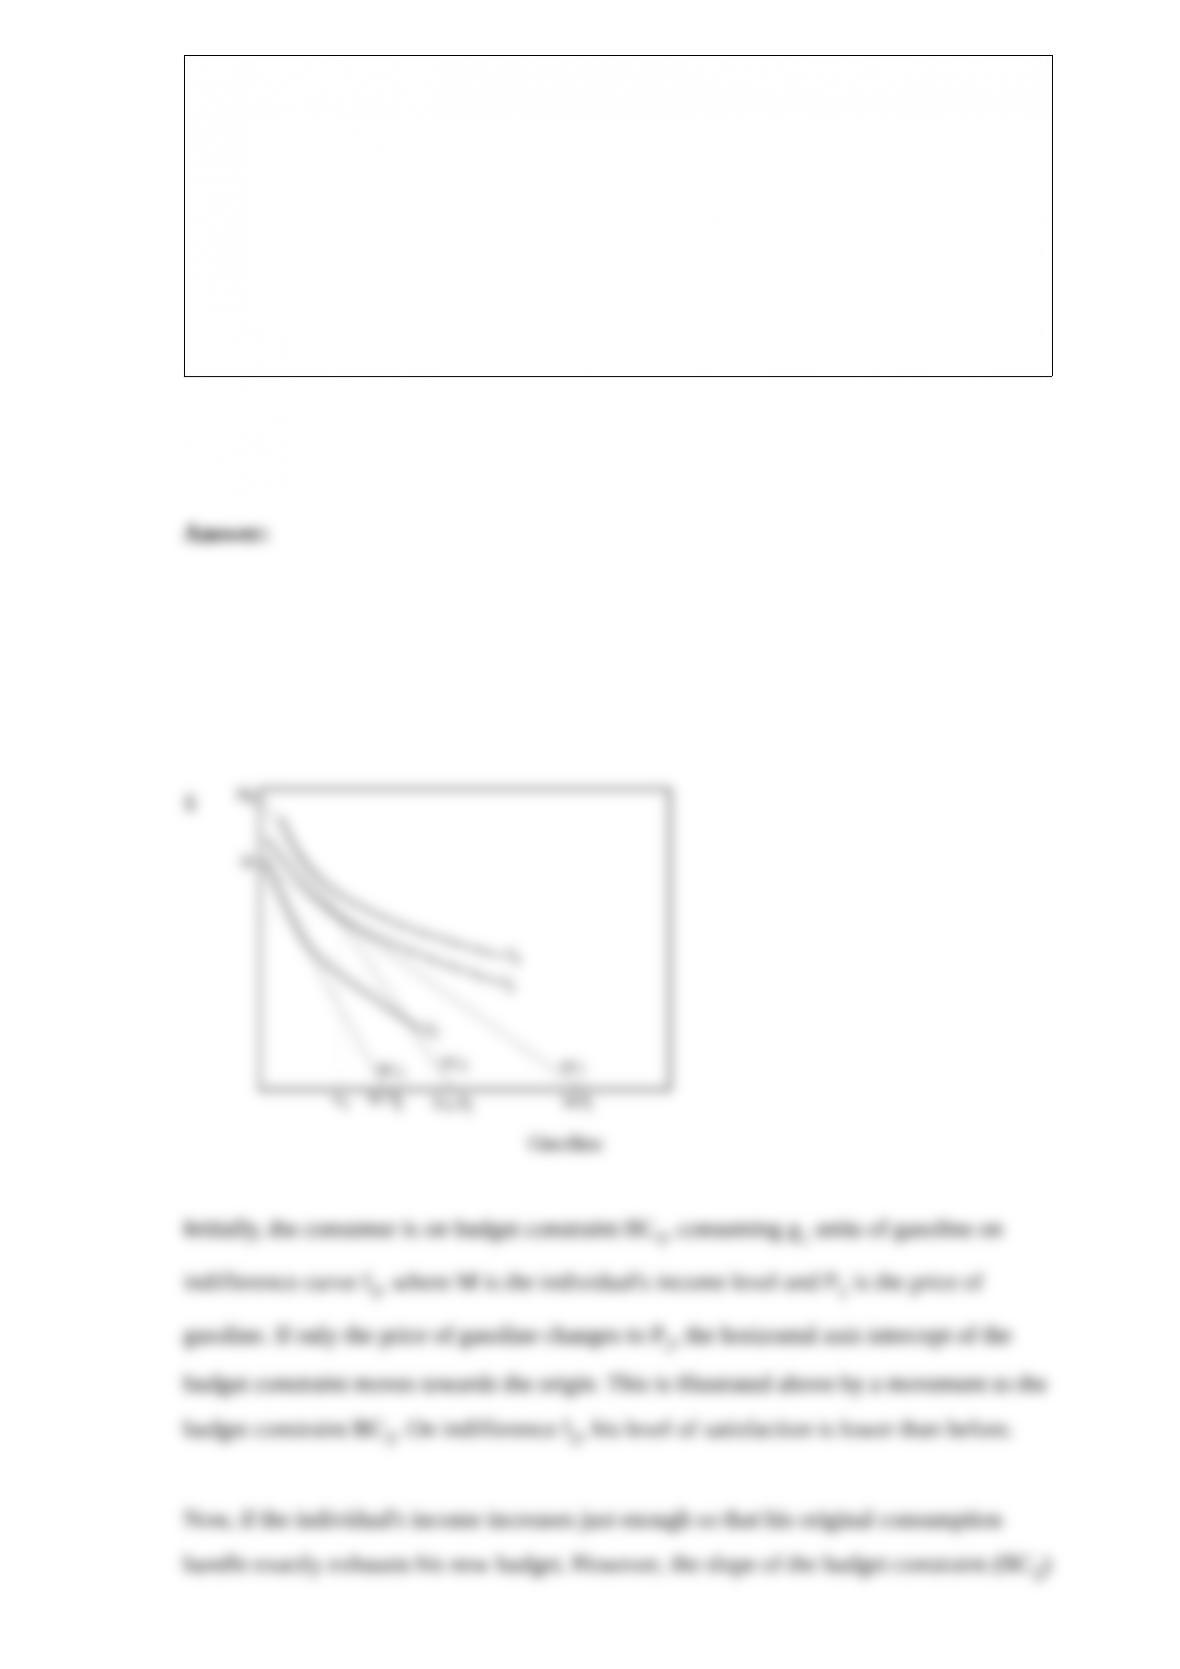
Suppose that the price of gasoline has risen by 50%. What happens to a consumer’s
level of well-being given he spends some of his income on gasoline? Diagram the
impact of the increase in gas prices in a commodity space diagram, and show the
relevant indifference curves.
Now, if the individual’s income rises just enough so that his original consumption
bundle exactly exhausts his income, will the individual purchase more or less gasoline
(this level of income implies the consumer can afford his original consumption bundle)?
Is the individual better-off at the higher price level of gasoline with the higher income
level or the original price of gas and income?
The current price charged by a local movie theater is $8 per ticket. The concession
stand at the theater averages $5 in revenue for each ticket sold. At the current ticket
price, the theater typically sells 300 tickets per showing. If the theater raises ticket
prices to $9, the theater will sell 270 tickets. What is the price elasticity of demand at
$8? What happens to ticket revenue if the theater increases ticket prices to $9 from $8?
What happens to concession revenue if the theater increases ticket prices? If the theater
wants to maximize the sum of ticket and concession revenue, should they raise ticket
prices to $9?
The following combinations of goods X and Y represent various market baskets.
Consumption is measured in pounds per month.
Market Basket Units of X Units of Y
A 4 6
B 16 7
C 15 3
D 3 2
Explain which market basket(s) is(are) preferred to other(s), and if there is any
uncertainty over which is preferable, point this out as well.
Suppose that the resale of tickets to professional football games is illegal in Missouri.
Due to the high demand for Chiefs (who play in Kansas City, Missouri) tickets there is
a shortage of tickets at the current ticket price. Given that the Chiefs will not raise the
price at which they sell the tickets, what would be the result of allowing tickets to be
resold in a secondary market at whatever price the market would support? If speculators
entered the market and began buying tickets directly from the Chiefs in hopes of
reselling the tickets later, what would happen to the line outside of the ticket offices
when the tickets are initially sold?
Irene’s utility of income function is U(I) = 20I + 300. Irene is offered the following
game of chance. The odds of winning are 1/100 and the pay-off is 75 times the wager. If
she loses, she loses her wager amount. Calculate Irene’s expected utility of the game.
The relationship between income and total utility for three investors (A, B, and C) is
shown in the tables below.
A B C
Income TU Income TU Income TU

5,000 14 5,000 4 5,000 6
10,000 24 10,000 8 10,000 14
15,000 32 15,000 12 15,000 24
20,000 38 20,000 16 20,000 36
25,000 43 25,000 20 25,000 52
30,000 47 30,000 24 30,000 72
35,000 49 35,000 28 35,000 100
Each investor has been confronted with the following three investment opportunities.
The first opportunity is an investment which pays $15,000 risk free. Opportunity two
offers a 0.4 probability of a $25,000 payment and a 0.6 probability of paying $10,000.
The final investment will either pay $35,000 with a probability of 0.25 or $5,000 with a
probability of 0.75. Determine the alternative each of the above investors would choose.
Provide an intuitive explanation for the differences in their choices.


Sheila can watch as many television programs as she wants for free, but she must pay
$2 for each video she rents. Draw Sheila’s budget line for t.v. shows (T) and videos (V),
and identify the set of affordable bundles (be sure to label the axes). At a particular
point on Sheila’s budget line, her MRS is 1T/2V. Illustrate this situation on your
diagram. Has Sheila maximized her satisfaction at this point? If not, identify a change
in consumption that will make her better off. Describe her preferences when satisfaction
is maximized.
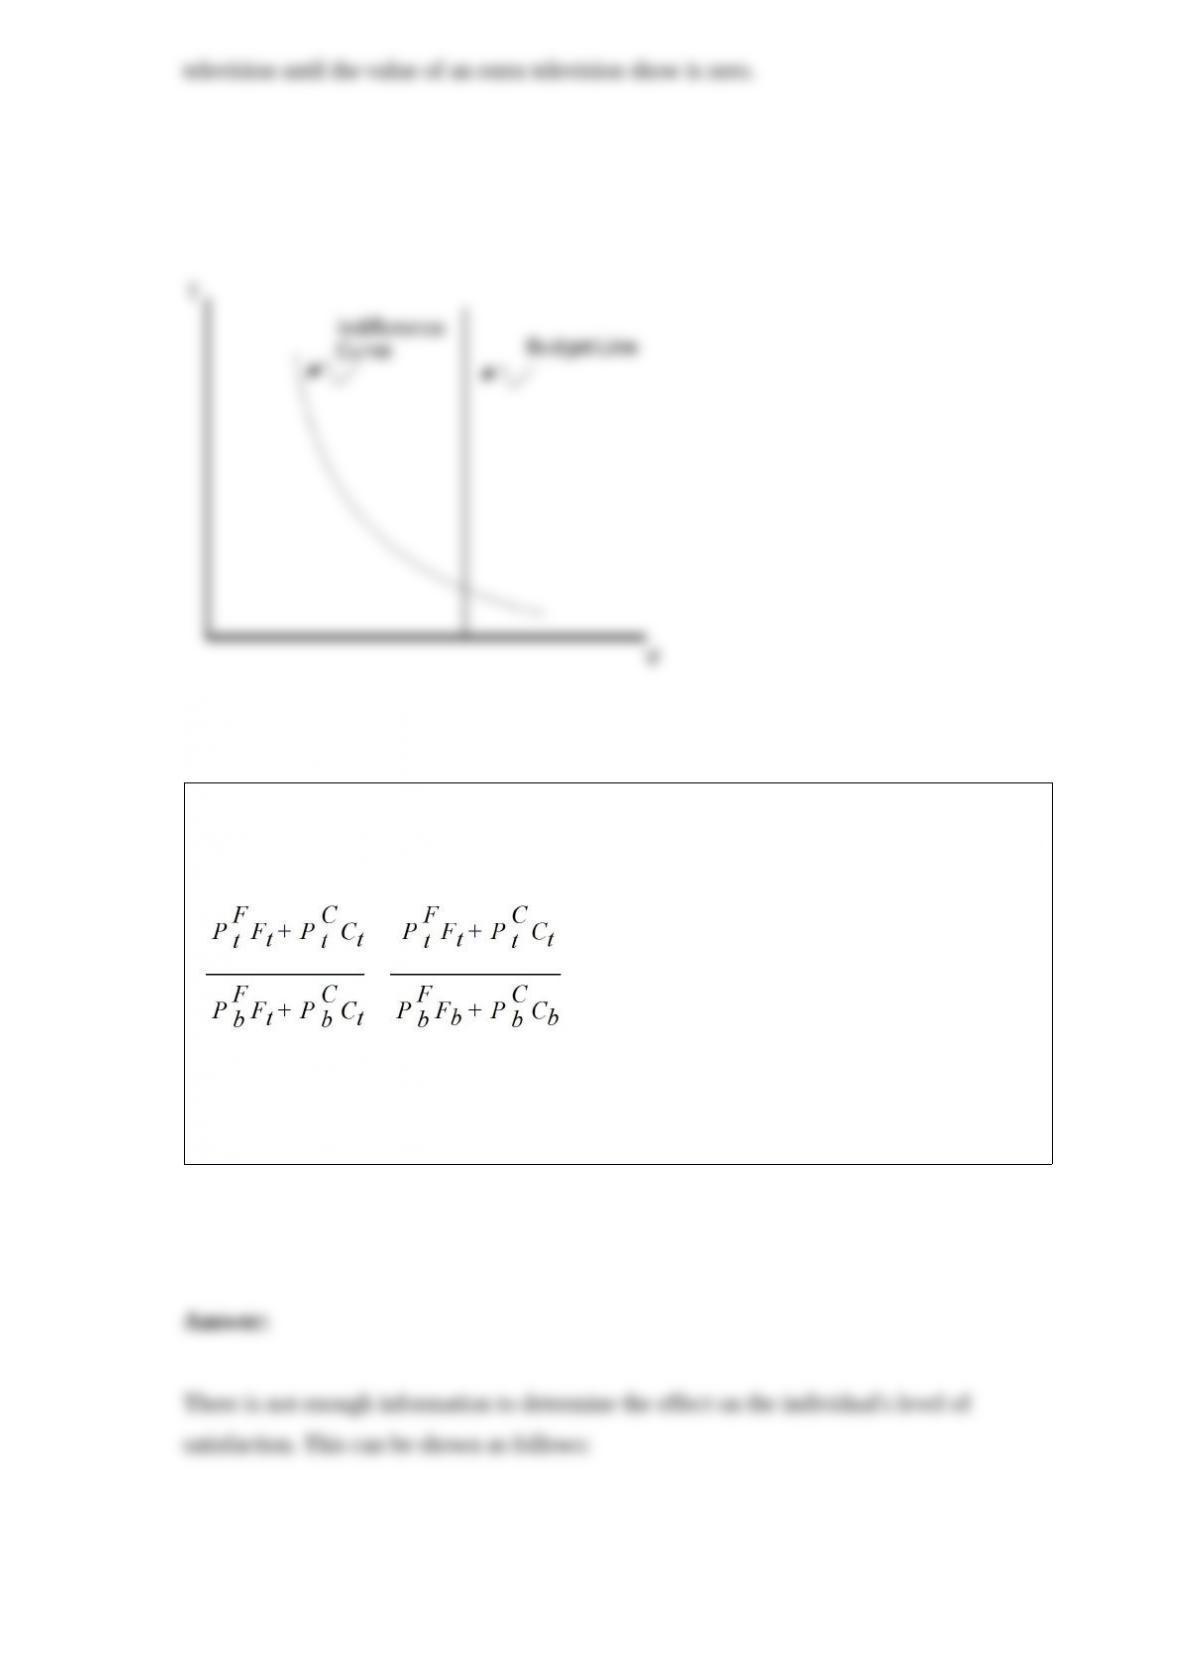
Suppose that a consumer’s increase in nominal income from the base year exceeds the
inflation level given by a Paasche cost of living index for their level of purchases:
( < )
Is this information enough to imply how the consumer’s level of well-being has
changed? (Hint: Use a revealed preference argument.)

John Smith is considering the purchase of a used car that has a bank book value of
$16,000. He believes that there is a 20% chance that the car’s transmission is damaged.
If the transmission is damaged, the car would be worth only $12,000 to Smith. What is
the expected value of the car to Smith?
Suppose the Social Security Administration would like to guarantee the purchasing
power of social security payments to the elderly does not diminish. That is, the real
value of the payments does not decrease. The CPI in 1990 was 130.7 and the CPI in
1998 was 163.0. How much does the Social Security Administration need to increase
payments from 1990 to 1998 to accomplish this objective?
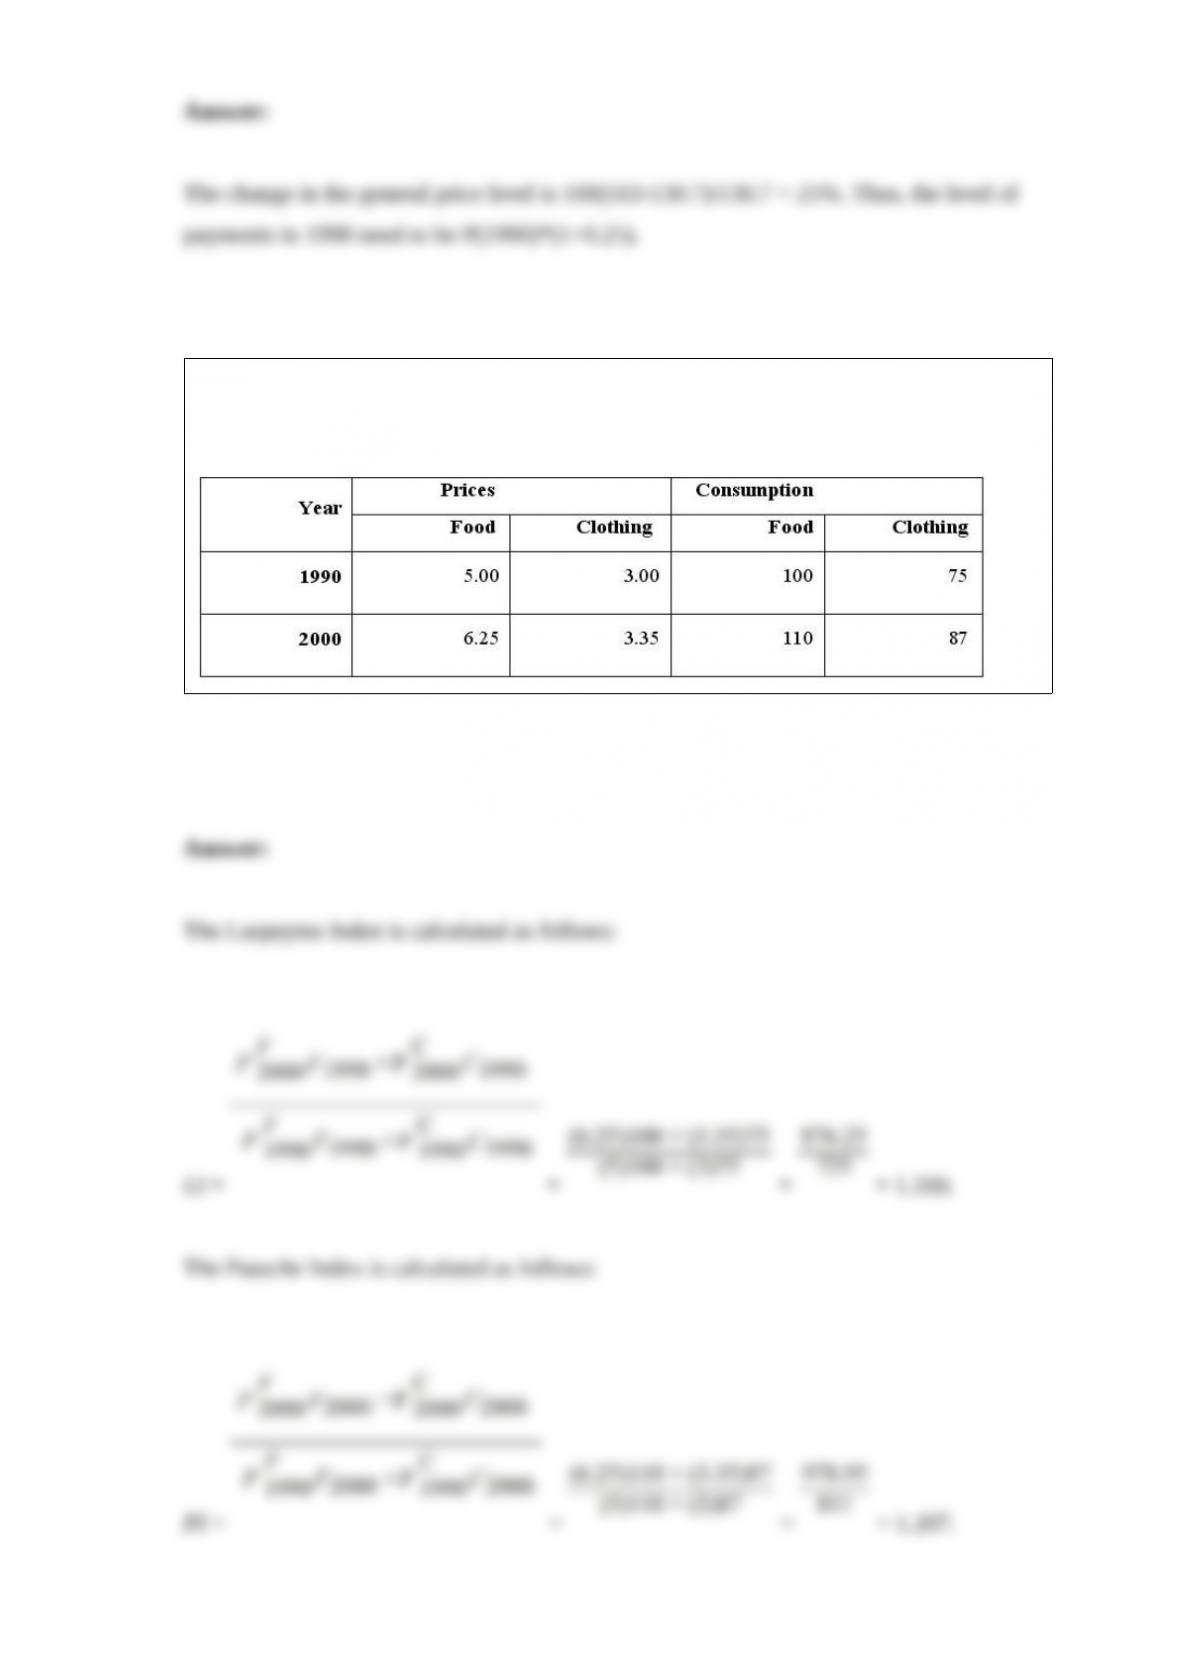
Suppose the table below lists the price and consumption levels of food and clothing
during 1990 and 2000. Calculate a Laspeyres and Paasche index using 1990 as the base
year.