Real GDP
a. moves in the opposite direction as unemployment.
b. increases as production falls.
c. falls when households save a smaller fraction of their income.
d. All of the above are correct.
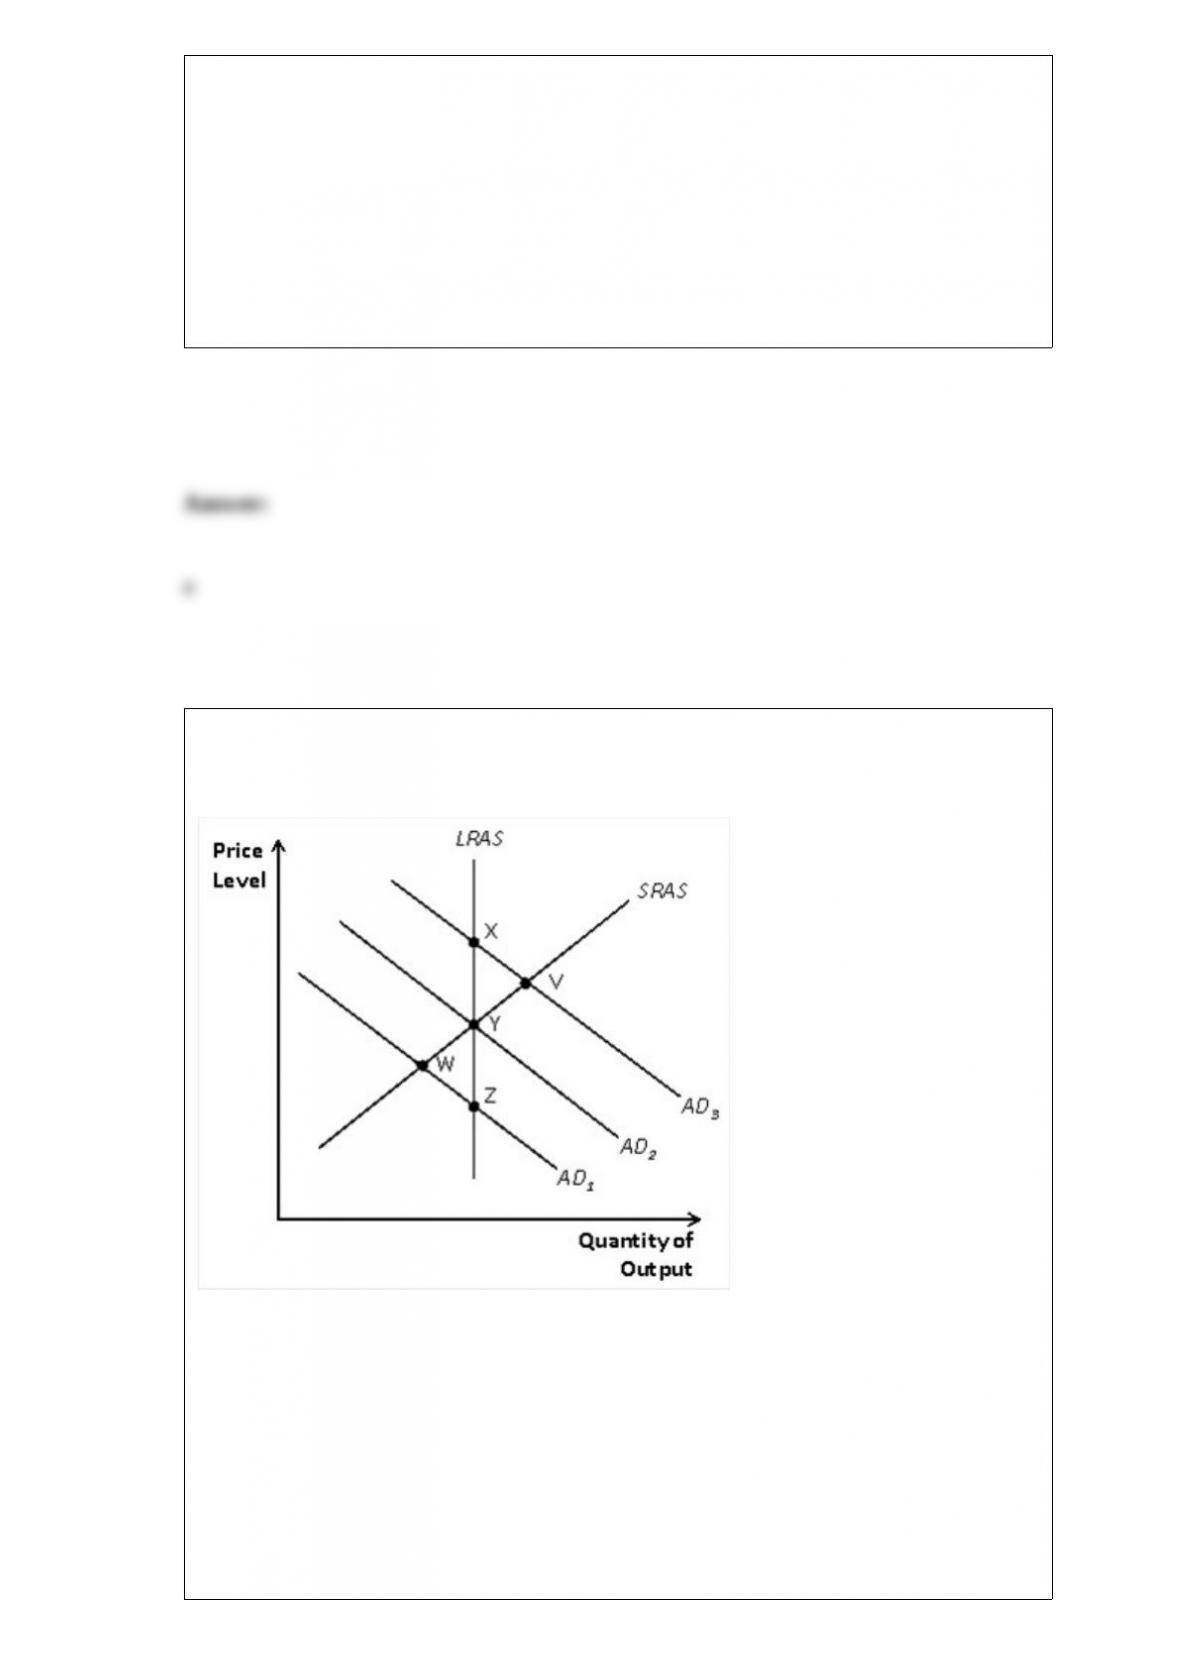
Figure 33-7.
RefertoFigure33-7. Suppose the economy starts at Y. If there is a fall in aggregate
demand, then the economy moves to
a. V in the long run.
b. W in the long run.
c. X in the long run.
d. Z in the long run.
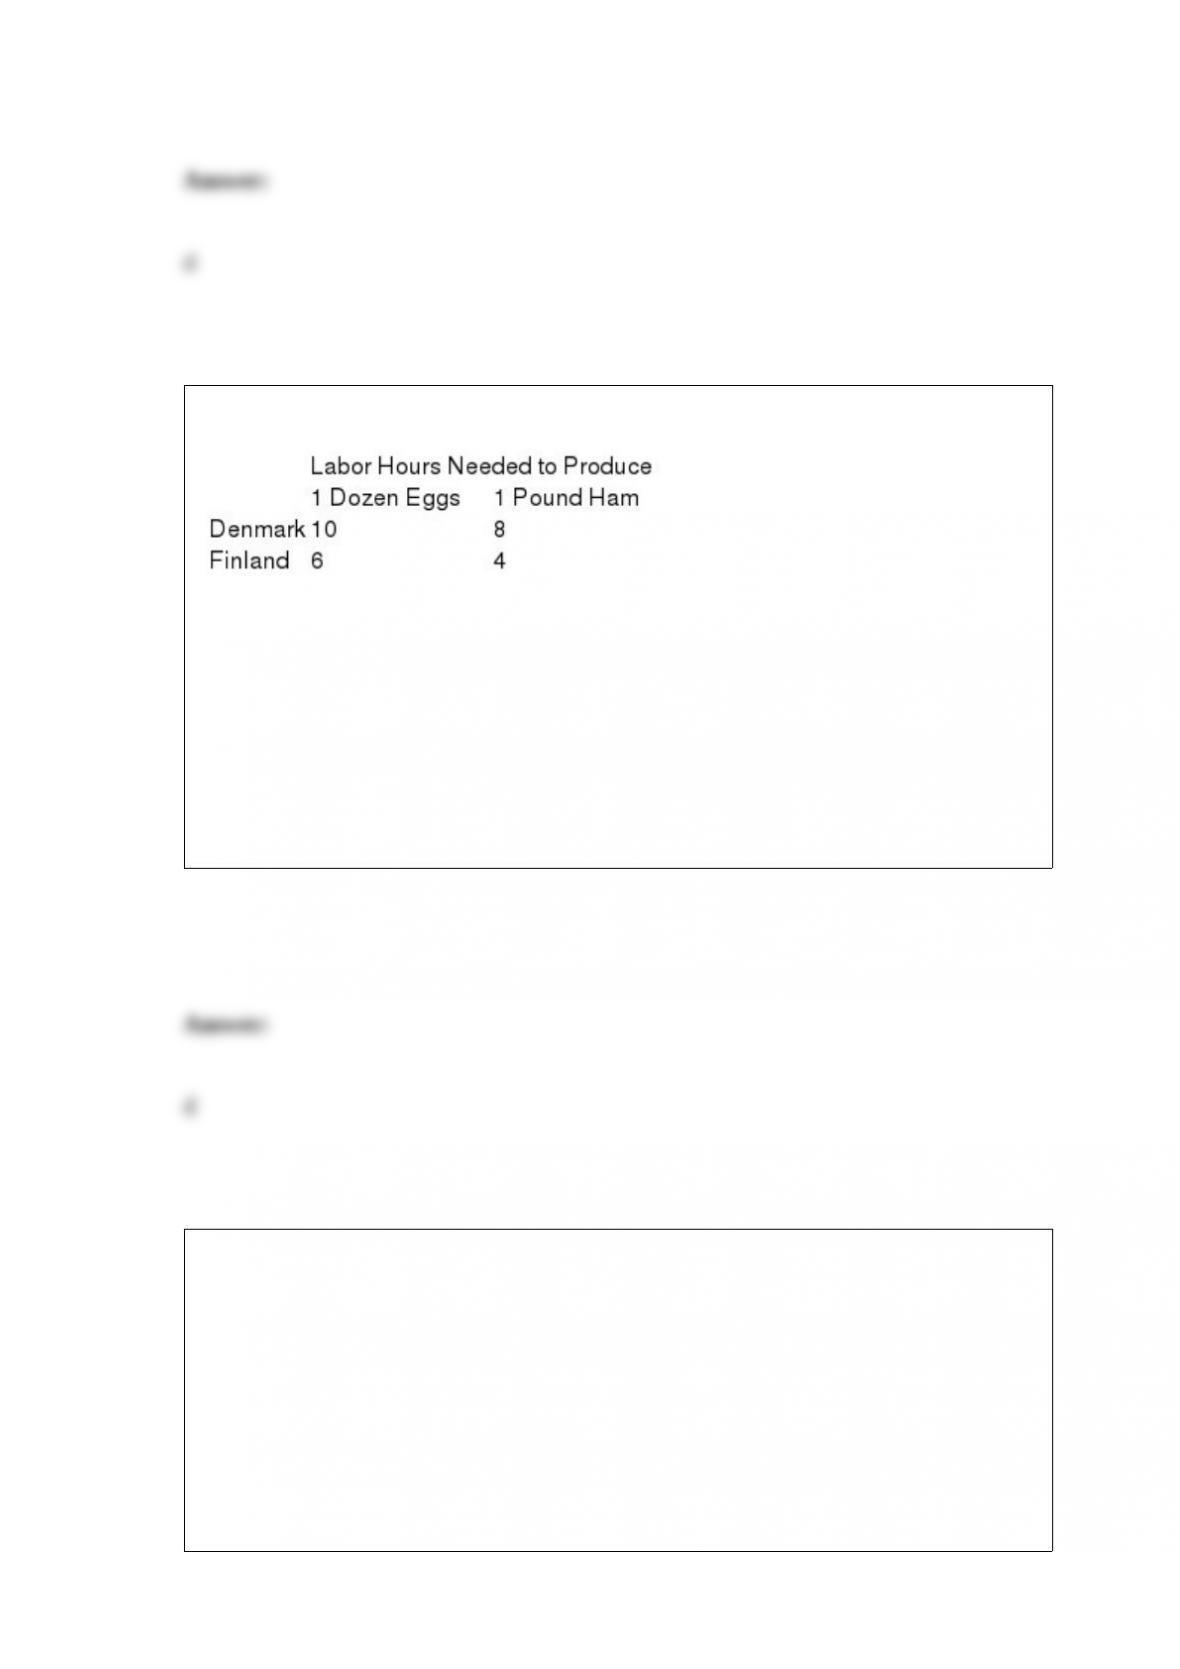
Table 3-35
RefertoTable3-35.Finland’s opportunity cost of producing 1 unit of ham is
a. 3/2 dozen eggs. This is higher than Denmark’s opportunity cost.
b. 3/2 dozen eggs. This is lower than Denmark’s opportunity cost.
c. 2/3 dozen eggs. This is higher than Denmark’s opportunity cost.
d. 2/3 dozen eggs. This is lower than Denmark’s opportunity cost.
If a central bank increases the money supply in response to an adverse supply shock,
then which of the following quantities moves closer to its pre-shock value as a result?
a. both the price level and output
b. the price level but not output
c. output but not the price level
d. neither output nor the price level

Which of the following both make the interest rate on a bond higher than otherwise?
a. the interest it pays is taxed and it was issued by a financially strong corporation
b. the interest it pays is taxed and it was issued by a financially weak corporation
c. the interest it pays is tax exempt and it was issued by a financially strong corporation
d. the interest it pays is tax exempt and it was issued by a financially weak corporation
Which of the following is notcorrect?
a. American families save a larger fraction of their incomes than their counterparts in
many other countries such as Germany and Japan.
b. Saving is an important long-run determinant of a nation’s standard of living.
c. A change in tax laws that encouraged greater saving would lower interest rates.
d. Taxes on interest income can substantially decrease the future value of current
saving.

Which movie is an allegory about late 19th century monetary policy?
a. TheWizardofOz
b. MaryPoppins
c. It”aWonderfulLife
d. TradingPlaces
In a small closed economy investment is $50 billion and private saving is $45 billion.
What are public saving and national saving?
a. $5 billion and $45 billion
b. -$5 billion and $45 billion
c. $5 billion and $50 billion
d. -$5 billion and $50 billion
A.W. Phillips’s discovery of a particular relationship between unemployment and
inflation for the United Kingdom
a. could not be extended to other countries, despite many researchers’ attempts to

provide that extension.
b. was quickly extended to other countries by researchers.
c. was extended to only one other country the United States.
d. was harshly criticized by the American economists Paul Samuelson and Robert
Solow on the grounds that Phillips’s study was fundamentally flawed.
The Bureau of Labor Statistics produces data on unemployment and other aspects of the
labor market from a regular survey of about 60,000 households, called the Current
Population Survey.
a. True
b. False
A policymaker against stabilizing the economy would be likely to believe
a. policymakers should “do no harm”.
b. there are no obstacles to the practical application of policy in real life.
c. policy lags are short enough that implementing policy changes in response to
recession is not too risky.
d. policy mitigates the magnitude of economic fluctuations.

In the long run, money demand and money supply determine
a. the price level and the real interest rate.
b. the price level but not the real interest rate.
c. the real interest rate but not the price level.
d. neither the price level nor the real interest rate.
In the circular-flow diagram, in the markets for
a. goods and services, households and firms are both sellers.
b. goods and services, households are sellers and firms are buyers.
c. the factors of production, households are sellers and firms are buyers.
d. the factors of production, households and firms are both buyers.

James offers you $1,000 today or $Xin 7 years. If the interest rate is 4.5 percent, then
you would prefer to take the $1,000 today if and only if a. X< 1,045.00.
b. X< 1,188.89.
c. X< 1,266.67.
d. X< 1,360.86.
In 2011, Modern Electronics, Inc. produced 60,000 calculators, employing 80 workers,
each of whom worked 8 hours per day. In 2012, the same firm produced 76,500
calculators, employing 85 workers, each of whom worked 10 hours per day.
Productivity at Modern Electronics
a. decreased by 4%
b. remained constant.
c. increased by 8.33%
d. increased by 27.50%
According to the theory of efficiency wages, firms operate more efficiently if wages are
above the equilibrium level.
a. True

b. False
During the economic downturn of 2008-2009, the Federal Reserve
a. used open-market operations to purchase mortgages and corporate debt, just as it
frequently does even when the economy is functioning normally.
b. took the unusual step of using open-market operations to purchase mortgages and
corporate debt.
c. explicitly set its target rate of inflation at zero.
d. explicitly set its target rate of inflation well above zero.
Kara receives a promotion at work, which increases her income. We would expect
Kara’s demand for
a. each good she purchases to remain unchanged.
b. normal goods to decrease.
c. substitute goods to increase.
d. inferior goods to decrease.

A market demand curve shows how the total quantity demanded of a good varies as
a. income varies.
b. price varies.
c. price of the nearest substitute good varies.
d. supply varies.
If China experienced capital flight, the supply of Chinese yuan in the market for
foreign-currency exchange would shift
a. left, which would make the real exchange rate of the Chinese yuan appreciate.
b. left, which would make the real exchange rate of the Chinese yuan depreciate.
c. right, which would make the real exchange rate of the Chinese yuan appreciate.
d. right, which would make the real exchange rate of the Chinese yuan depreciate.

Table 3-8
Assume that England and Spain can switch between producing cheese and producing
bread at a constant rate.
Refer to Table3-8. We could use the information in the table to draw a production
possibilities frontier for England and a second production possibilities frontier for
Spain. If we were to do this, measuring bread along the horizontal axis, then
a. the slope of England’s production possibilities frontier would be 0.67 and the slope of
Spain’s production possibilities frontier would be -0.5.
b. the slope of England’s production possibilities frontier would be 1.5 and the slope of
Spain’s production possibilities frontier would be -2.
c. the slope of England’s production possibilities frontier would be .75 and the slope of
Spain’s production possibilities frontier would be -1.
d. the slope of England’s production possibilities frontier would be 2 and the slope of
Spain’s production possibilities frontier would be -.5.
As the price level rises, the exchange rate
a. falls, so exports rise and imports fall.
b. falls, so exports fall and imports rise.
c. rises, so exports rise and imports fall.
d. rises, so exports fall and imports rise.

Which of the following would notshift the supply curve for mp3 players?
a. an increase in the price of mp3 players
b. a decrease in the number of sellers of mp3 players
c. an increase in the price of plastic, an input into the production of mp3 players
d. an improvement in the technology used to produce mp3 players
Scenario25-1. An economy’s production form takes the form Y= AF(L, K, H, N).
RefertoScenario25-1. If the production function has the constant-returns-to-scale
property, then it is possible that the specific form of the production function is
Table 4-7

RefertoTable4-7.If these are the only four sellers in the market for ice cream, then the
market quantity supplied at a price of $8 is
a. 10 gallons.
b. 20 gallons.
c. 32 gallons.
d. 40 gallons.
A worker received $5 for a daily wage in 1930, which has the equivalent value of
$63.24 today. If the CPI was 17 in 1930 what is the value of the CPI today, rounded to
the nearest whole number?
a. 215
b. 134
c. 17
d. 1.3

Which of the following increases when the Fed makes open-market sales?
a. currency and reserves
b. currency but not reserves
c. reserves but not currency
d. neither currency nor reserves
Which of the following will reduce the price level and real output in the short run?
a. an increase in government purchases.
b. an decrease in oil prices
c. a decrease in the money supply
d. technical progress
In surveys of professional economists, fourteen propositions were endorsed by an
overwhelming majority of respondents.

a. True
b. False
Which of the following is downward-sloping?
a. both the long-run Phillips curve and the short-run Phillips curve
b. neither the long-run Phillips curve nor the short-run Phillips curve
c. the long-run Phillips curve, but not the short-run Phillips curve
d. the short-run Phillips curve, but not the long-run Phillips curve
If, for an imaginary closed economy, investment amounts to $12,000 and the
government is running a $2,000 deficit, then private saving must amount to $10,000.
a. True
b. False

Which of the following effects provide incentives for consumers to spend less when the
price level rises?
a. the wealth effect and the interest-rate effect
b. the wealth effect but not the interest-rate effect
c. the interest-rate effect but not the wealth effect
d. neither the wealth-effect nor the interest rate effect
If an inexpensive alternative to oil were found, the price of oil adjusted for inflation
a. would decline as the alternative would reduce the demand for oil.
b. would decline as the alternative would reduce the supply of oil.
c. would increase as the alternative would increase the demand for oil.
d. would increase as the alternative would increase the supply of oil.