Other factors held constant, a decrease in resource prices will shift the aggregate:
a. demand curve leftward.
b. demand curve rightward.
c. supply curve leftward.
d. supply curve rightward.
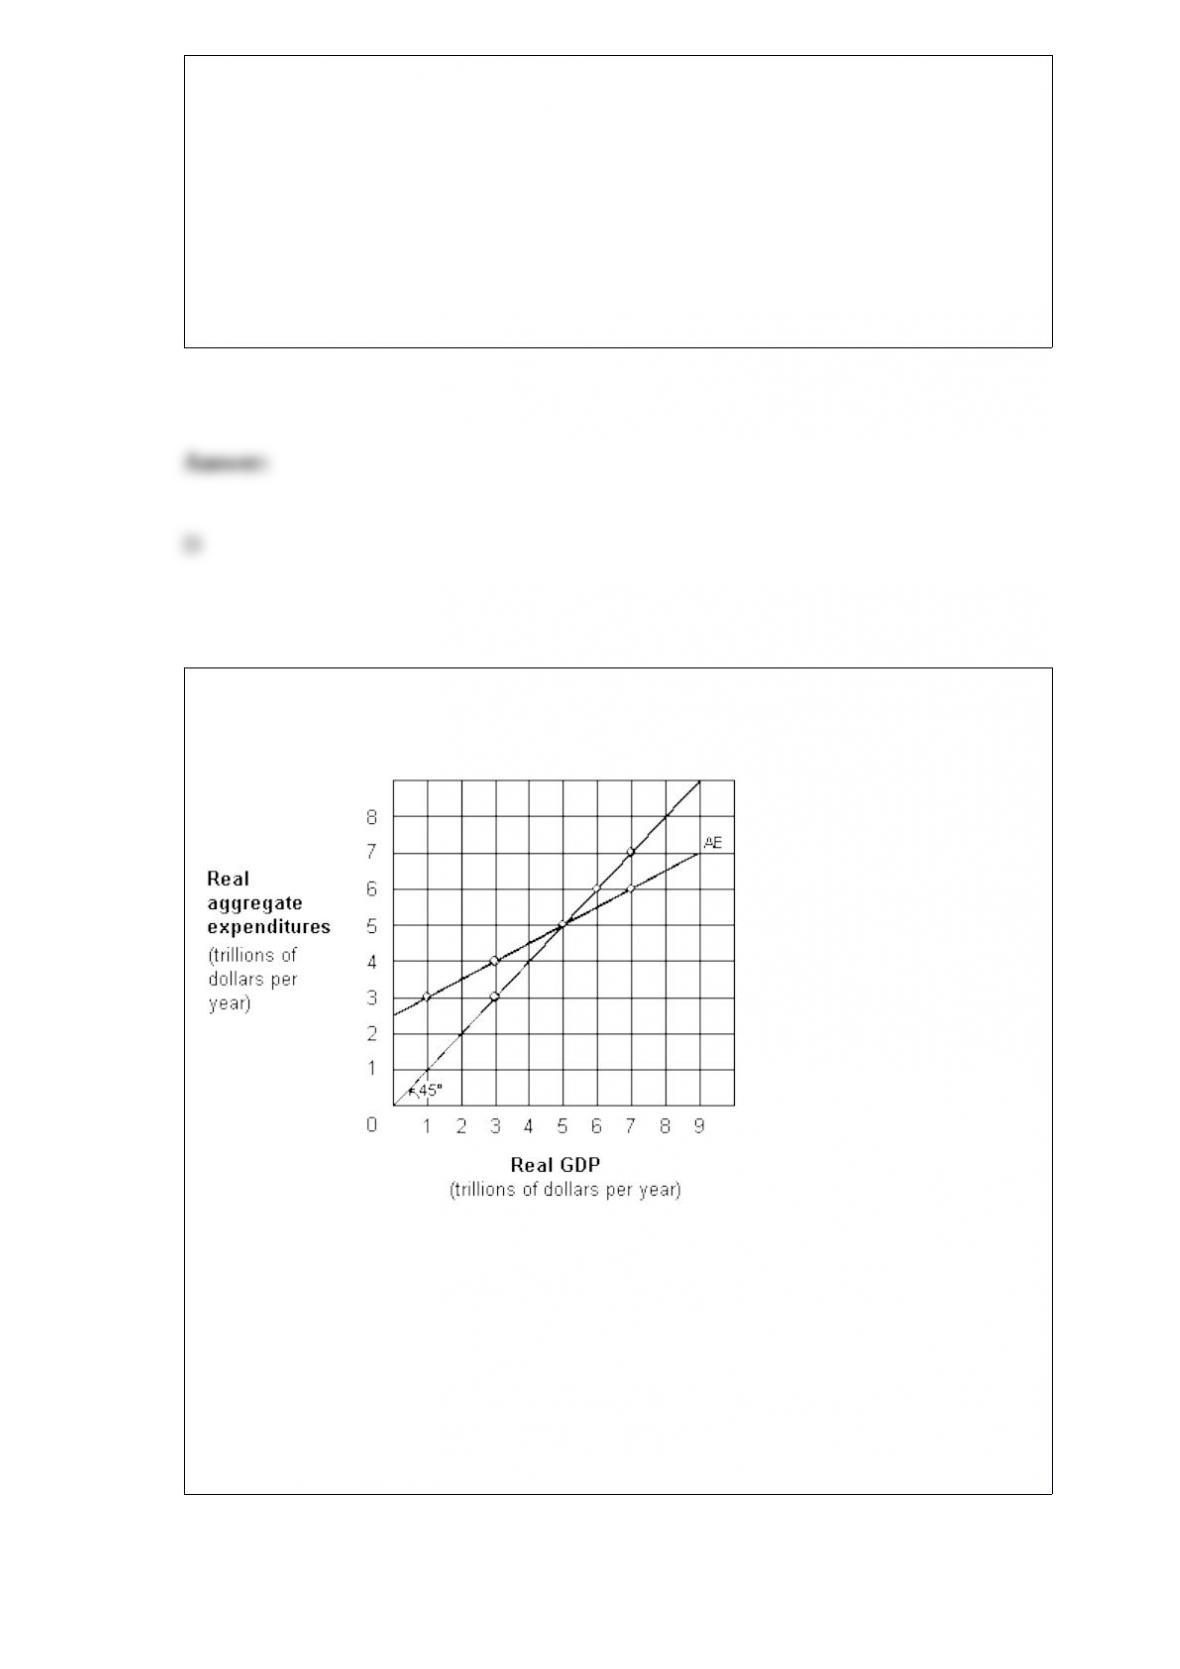
Exhibit 9-2 Keynesian aggregate-expenditures model
As shown in Exhibit 9-2, if
GDP is $3 trillion, the economy experiences unplanned inventory:
a. depletion of $1 trillion.
b. depletion of $2 trillion.
c. accumulation of $1 trillion.
d. accumulation of $2 trillion.

The number of people officially unemployed is not the same as the number of people
who can’t find a job because:
a. the armed forces is included.
b. some people have jobs but continue to look for a better one.
c. some people who can’t find a job become discouraged and quit looking.
d. none of these.
In order for Ethiopia to increase its future economic growth, it must choose a point that
is:
a. below its production possibilities curve.
b. further along on its production possibilities curve toward the capital goods axis.
c. further along on its production possibilities curve toward the consumption goods
axis.
d. further along on its production possibilities curve away from the population axis.
e. above its production possibilities curve.

Public goods are usually provided by:
a. private industry.
b. the government.
c. private citizens.
d. internal markets
e. local industry.
Which of the following is the best example of a nonrenewable resource?
a. Forests.
b. Oil.
c. Clean air.
d. Fish in the ocean.
If it costs the DuPont Chemical Company more to make the chemical flaxinate in the
United States than it does to make it in Formosa, the Formosans must have:
a. lower demand for flaxinate.
b. tariffs on flaxinate.
c. inefficient markets.

d. a more favorable political environment.
e. an absolute advantage in flaxinate production.
Exhibit 15-3 Balance sheet of Tucker National Bank Assets Liabilities
Required reserves $ 20,000 Checkable deposits $100,000
Excess reserves 0
Loans 80,000
Total $100,000 Total $100,000 The required reserve ratio in Exhibit 15-3 is:
a. 10 percent.
b. 20 percent.
c. 80 percent.
d. 100 percent.
The result of the balanced budget multiplier is that aggregate demand changes by the
amount of the change in:
a. government spending.
b. tax revenue.
c. government spending plus tax revenue.
d. government spending minus tax revenue.
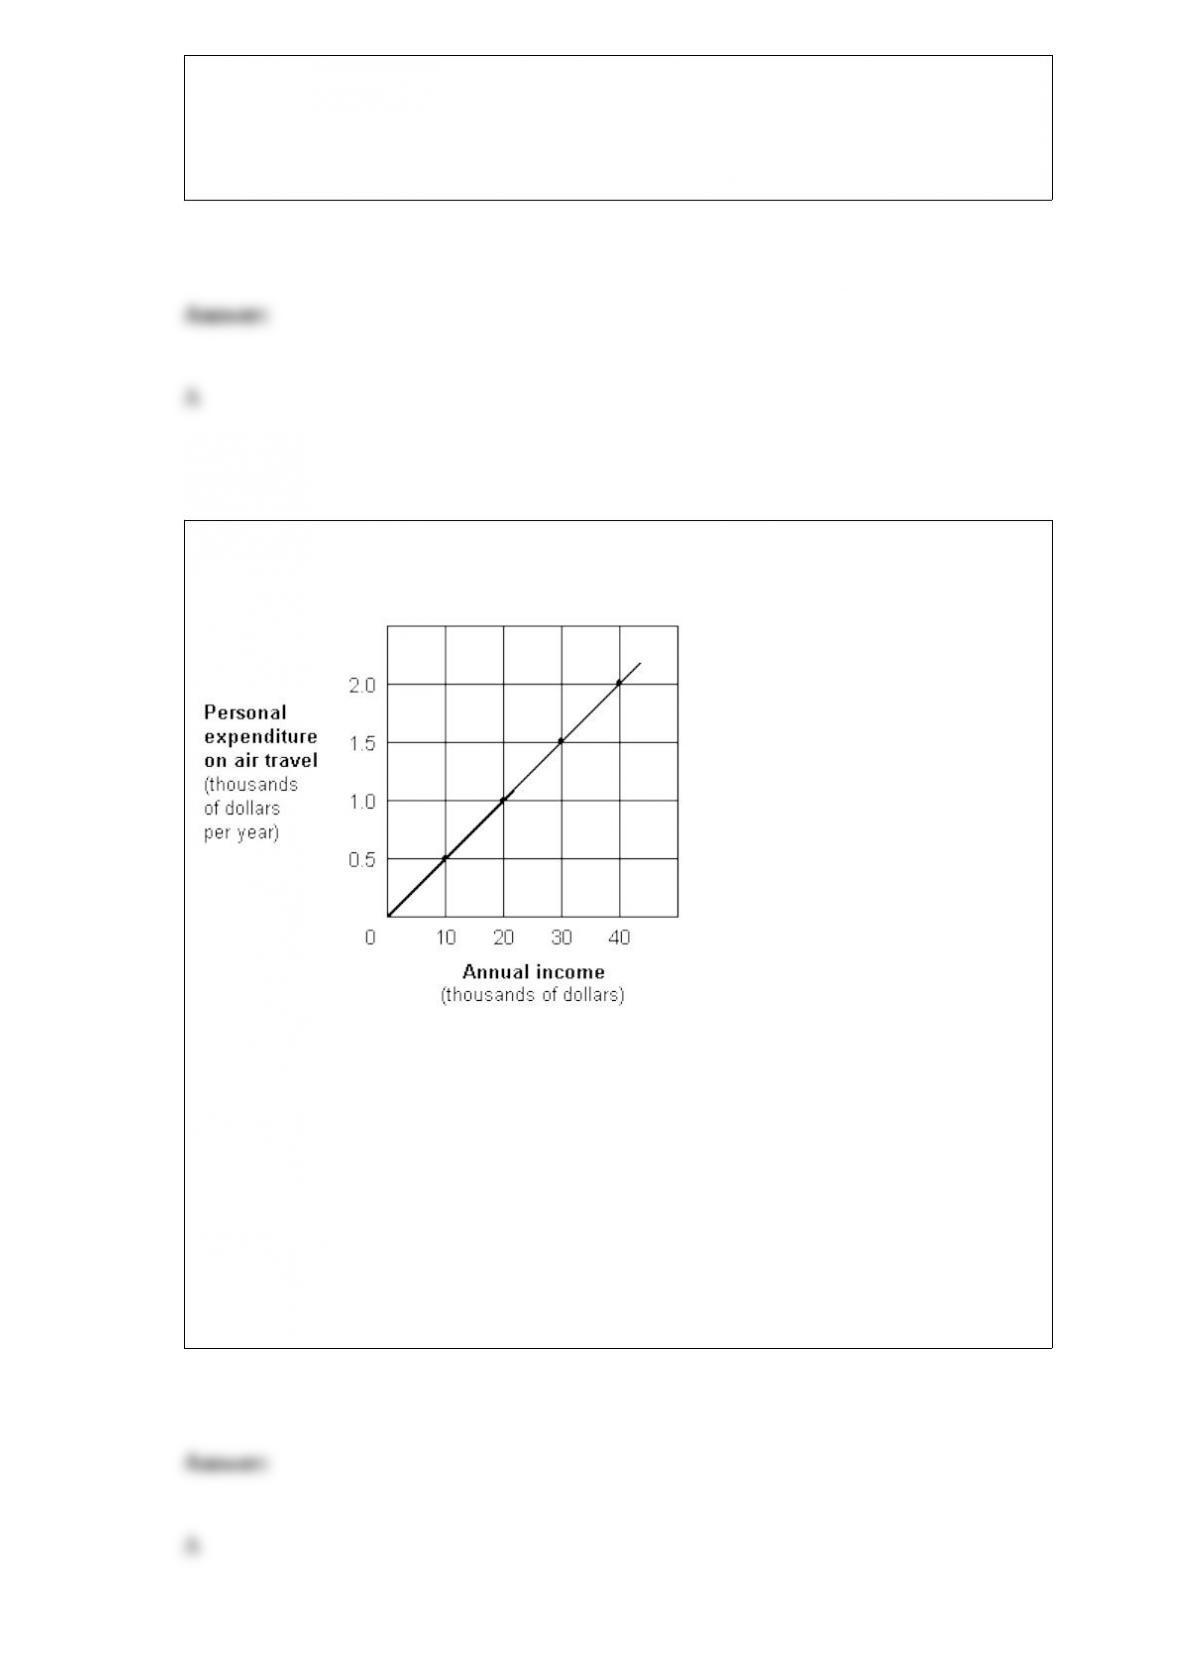
Exhibit 1A-7 Straight line relationship
According to Exhibit 1A-7, the relationship between annual income and air-travel
expenditures is:
a. direct.
b. inverse.
c. complex.
d. independent.

Which of the following is the best example of a quota?
a. a tax placed on all small cars sold in the domestic market
b. a limit imposed on the number of men’s suits that can be imported from a foreign
country
c. a subsidy from the U.S. government to domestic manufacturers of men’s suits so they
can compete more effectively with foreign producers of men’s suits
d. a $100-per-car fee imposed on all small imported cars
The economies of most less-developed countries (LDCs) are based on:
a. agriculture.
b. manufacturing.
c. services.
d. oil.
Suppose that consumers become more pessimistic about the future and, as a result,
reduce their consumption by $10 billion. If the marginal propensity to consume is 0.80,
how will this $10 billion reduction in consumption affect the equilibrium level of real
GDP?

a. Real GDP will decrease by $8 billion.
b. Real GDP will decrease by $10 billion.
c. Real GDP will decrease by $40 billion.
d. Real GDP will decrease by $50 billion.
The sun is an example of:
a. a natural resource.
b. capital. c. labor.
d. none of these.
Which of the following would be most likely to improve the standard of living of
people in less-developed nations?
a. The development of strong labor unions.
b. An increase in foreign investment.
c. An increase in the share of the population under 15 years of age.
d. Higher tariffs and the imposition of other restraints designed to restrict international
trade.

An increase in the general price level is termed:
a. the Consumer Price Index.
b. inflation.
c. deflation.
d. stagflation.
e. nominal pricing.
Which of the following is an example of a negative externality?
a. A Japanese company begins to produce cars, which causes American workers to lose
their jobs.
b. An employee of a chemical company spills acid on his arm, causing severe damage.
c. John plants fruit trees in his front yard, which attracts bees, which sting neighbor
Mary.
d. Sally buys coffee at McDonald’s, spills some on her, and burns her arm.
e. Jack attempts to fix his roof, falls off, and breaks his leg.

Assuming DVDs and DVD players are complements, the effect of an increase in the
price of DVD players on the market for DVDs is a(n):
a. downward movement along the demand curve for DVDs.
b. upward movement along the demand curve for DVDs.
c. rightward shift in the demand curve for DVDs.
d. leftward shift in the demand curve for DVDs.