
At the equilibrium price of a good, the good will be purchased by those buyers who
a. value the good more than price.
b. value the good less than price.
c. have the money to buy the good.
d. consider the good a necessity.
An example of positive analysis is studying
a. how market forces produce equilibrium.
b. whether equilibrium outcomes are fair.
c. whether equilibrium outcomes are socially desirable.
d. if income distributions are fair.
A decrease in quantity demanded
a. results in a movement downward and to the right along a demand curve.
b. results in a movement upward and to the left along a demand curve.
c. shifts the demand curve to the left.
d. shifts the demand curve to the right.
According to economist John Maynard Keynes, a great economist must also be a(n)
a. mathematician.
b. historian.
c. philosopher.
d. All of the above are correct.
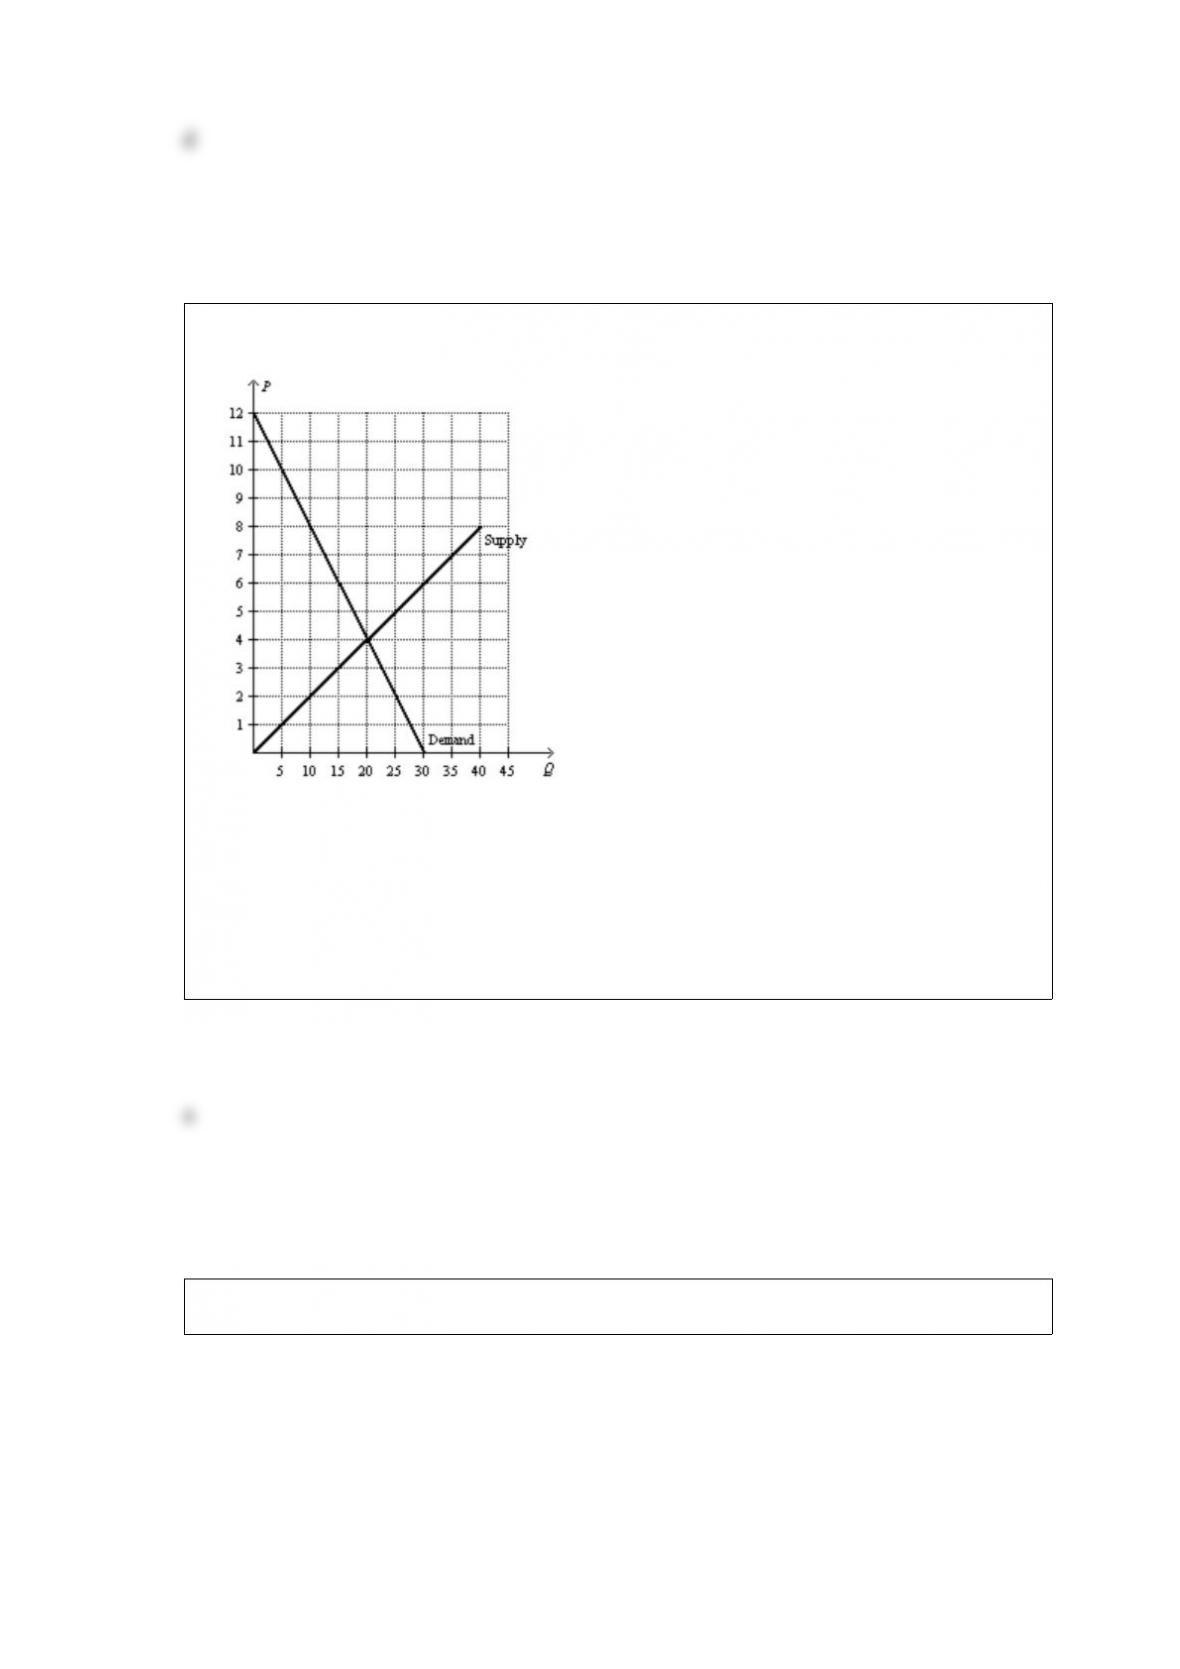
Figure 812
Refer to Figure 812. Suppose a $3 perunit tax is placed on this good. The loss of
consumer surplus resulting from this tax is
a. $35.
b. $45.
c. $70.
d. $80.
Figure 624
Refer to Figure 624. The perunit burden of the tax on buyers of the good is
a. $2.
b. $4.
c. $6.
d. $8.
Matthew bakes apple pies that he sells at the local farmer’s market. If the price of
apples increases, the
a. supply curve for Matthew’s pies will increase.
b. supply curve for Matthew’s pies will decrease.
c. demand curve for Matthew’s pies will increase.
d. demand curve for Matthew’s pies will decrease.
When a country that imports a particular good imposes an import quota on that good,
a. consumer surplus increases and total surplus increases in the market for that good.
b. consumer surplus increases and total surplus decreases in the market for that good.
c. consumer surplus decreases and total surplus increases in the market for that good.
d. consumer surplus decreases and total surplus decreases in the market for that good.
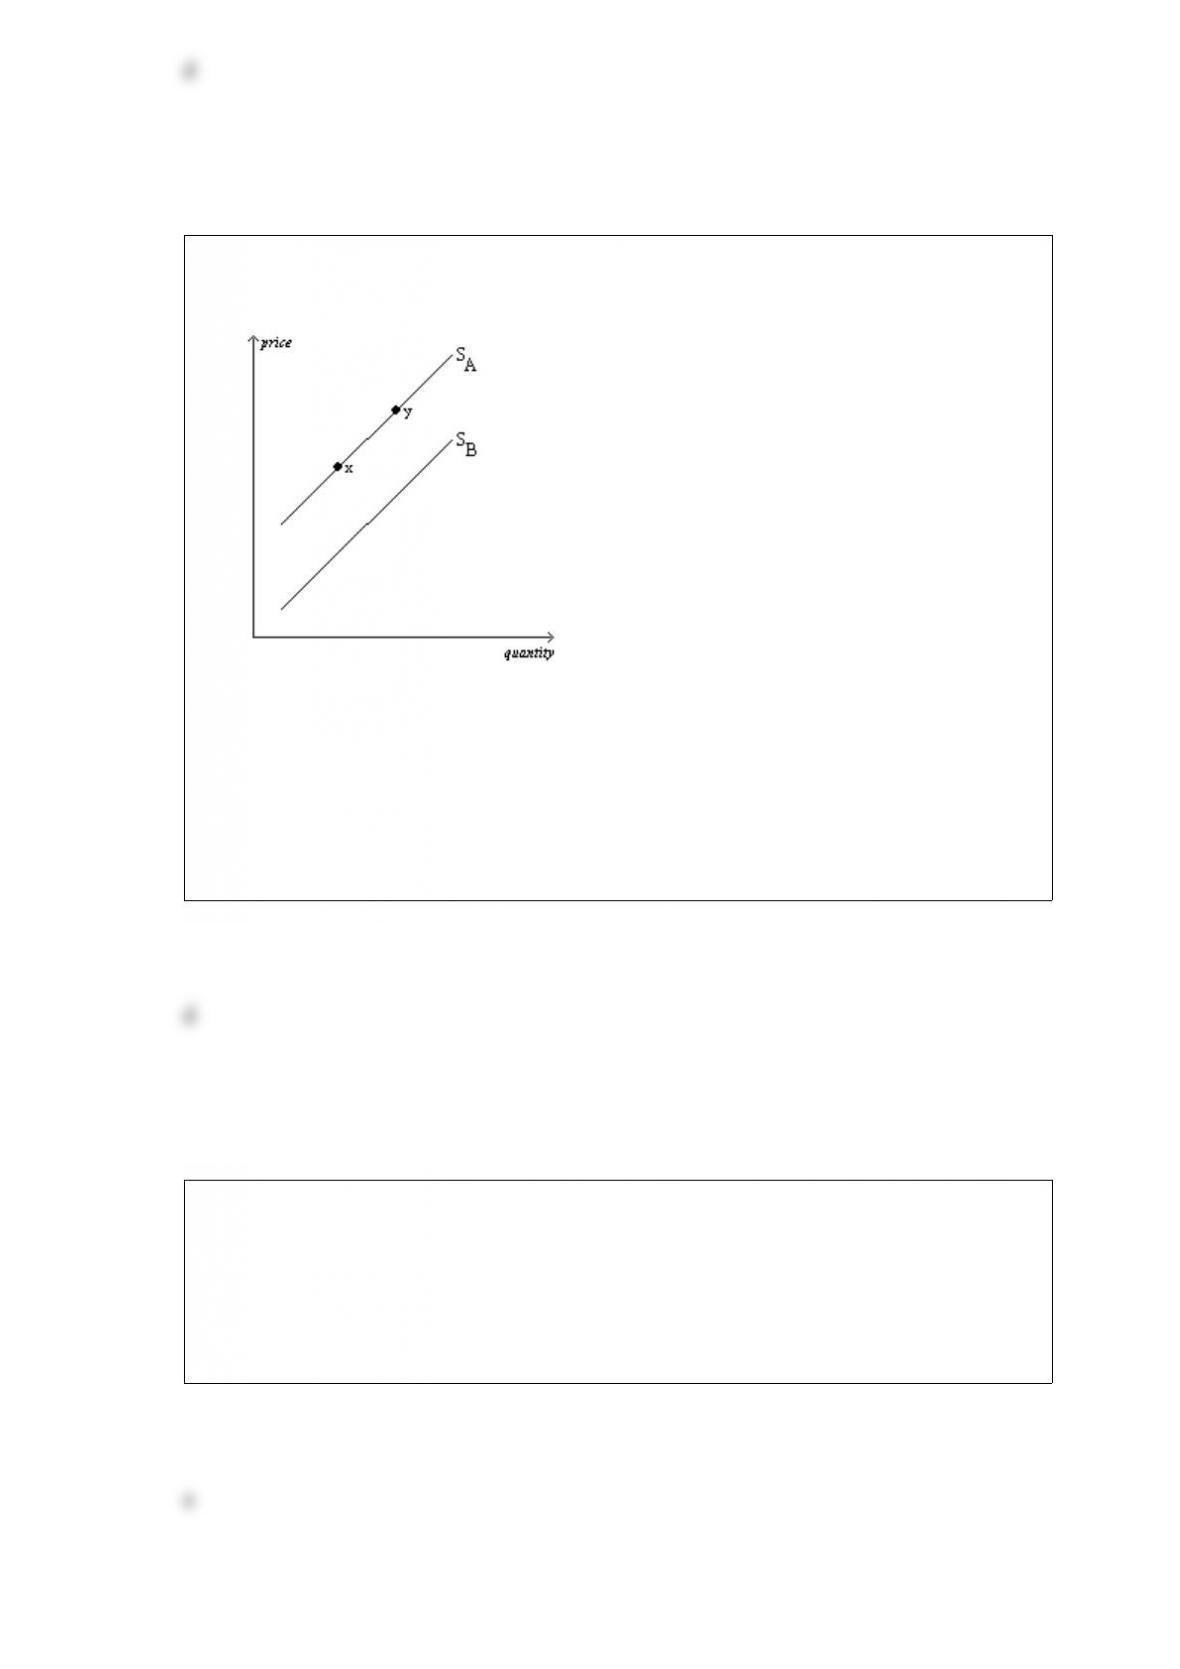
Figure 425
The graph below pertains to the supply of paper to colleges and universities.
Refer to Figure 425. All else equal, an increase in the price of the pulp used in the
paper production process would cause a move from
a. x to y.
b. y to x.
c. SA to SB.
d. SB to SA.
Thousands of people develop lung cancer from secondhand exposure to cigarette
smoke. This is an example of
a. a market failure caused by an externality.
b. a market failure caused by market power.
c. a market failure caused by equality.
d. There is no market failure in this case.
Suppose that the demand for picture frames is highly inelastic, and the supply of picture
frames is highly elastic. A tax of $1 per frame levied on picture frames will increase the
price paid by buyers of picture frames by
a. less than $0.50.
b. $0.50.
c. between $0.50 and $1.
d. $1.
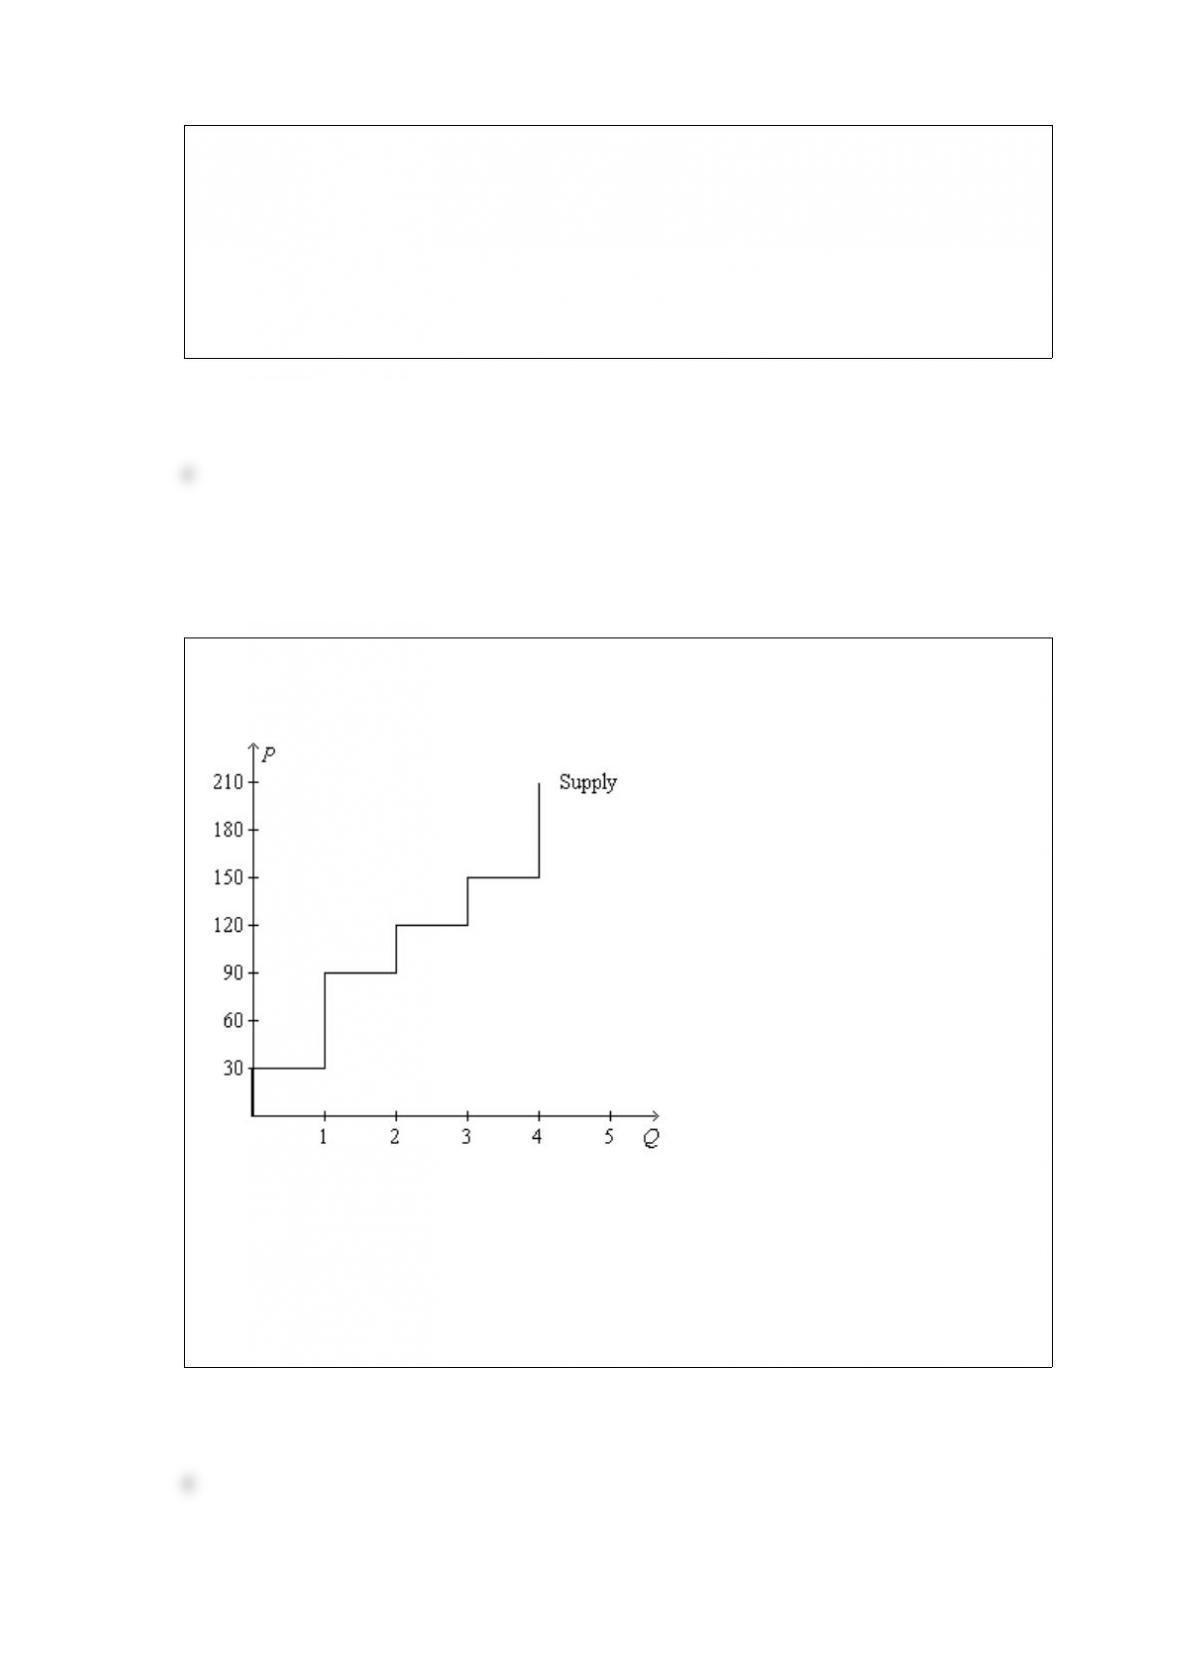
Figure 718
Refer to Figure 718. Suppose the willingness to pay of the marginal buyer of the 3rd
unit is $125. Then total surplus is maximized if
a. 1 unit of the good is produced and sold.
b. 2 units of the good are produced and sold.
c. 3 units of the good are produced and sold.
d. 4 units of the good are produced and sold.
Suppose that a worker in Boatland can produce either 5 units of wheat or 25 units of
fish per year, and a worker in Farmland can produce either 25 units of wheat or 5 units
of fish per year. There are 10 workers in each country. Political pressure from the fish
lobby in Farmland and from the wheat lobby in Boatland has prevented trade between
the two countries on the grounds that cheap imports would kill the fish industry in
Farmland and the wheat industry in Boatland. As a result, Boatland produces and
consumes 25 units of wheat and 125 units of fish per year while Farmland produces and
consumes 125 units of wheat and 25 units of fish per year. If the political pressure were
overcome and trade were to occur, each country would completely specialize in the
product in which it has a comparative advantage. If trade were to occur, the combined
output of the two countries would increase by
a. 25 units of wheat and 25 units of fish.
b. 50 units of wheat and 50 units of fish.
c. 75 units of wheat and 75 units of fish.
d. 100 units of wheat and 100 units of fish.
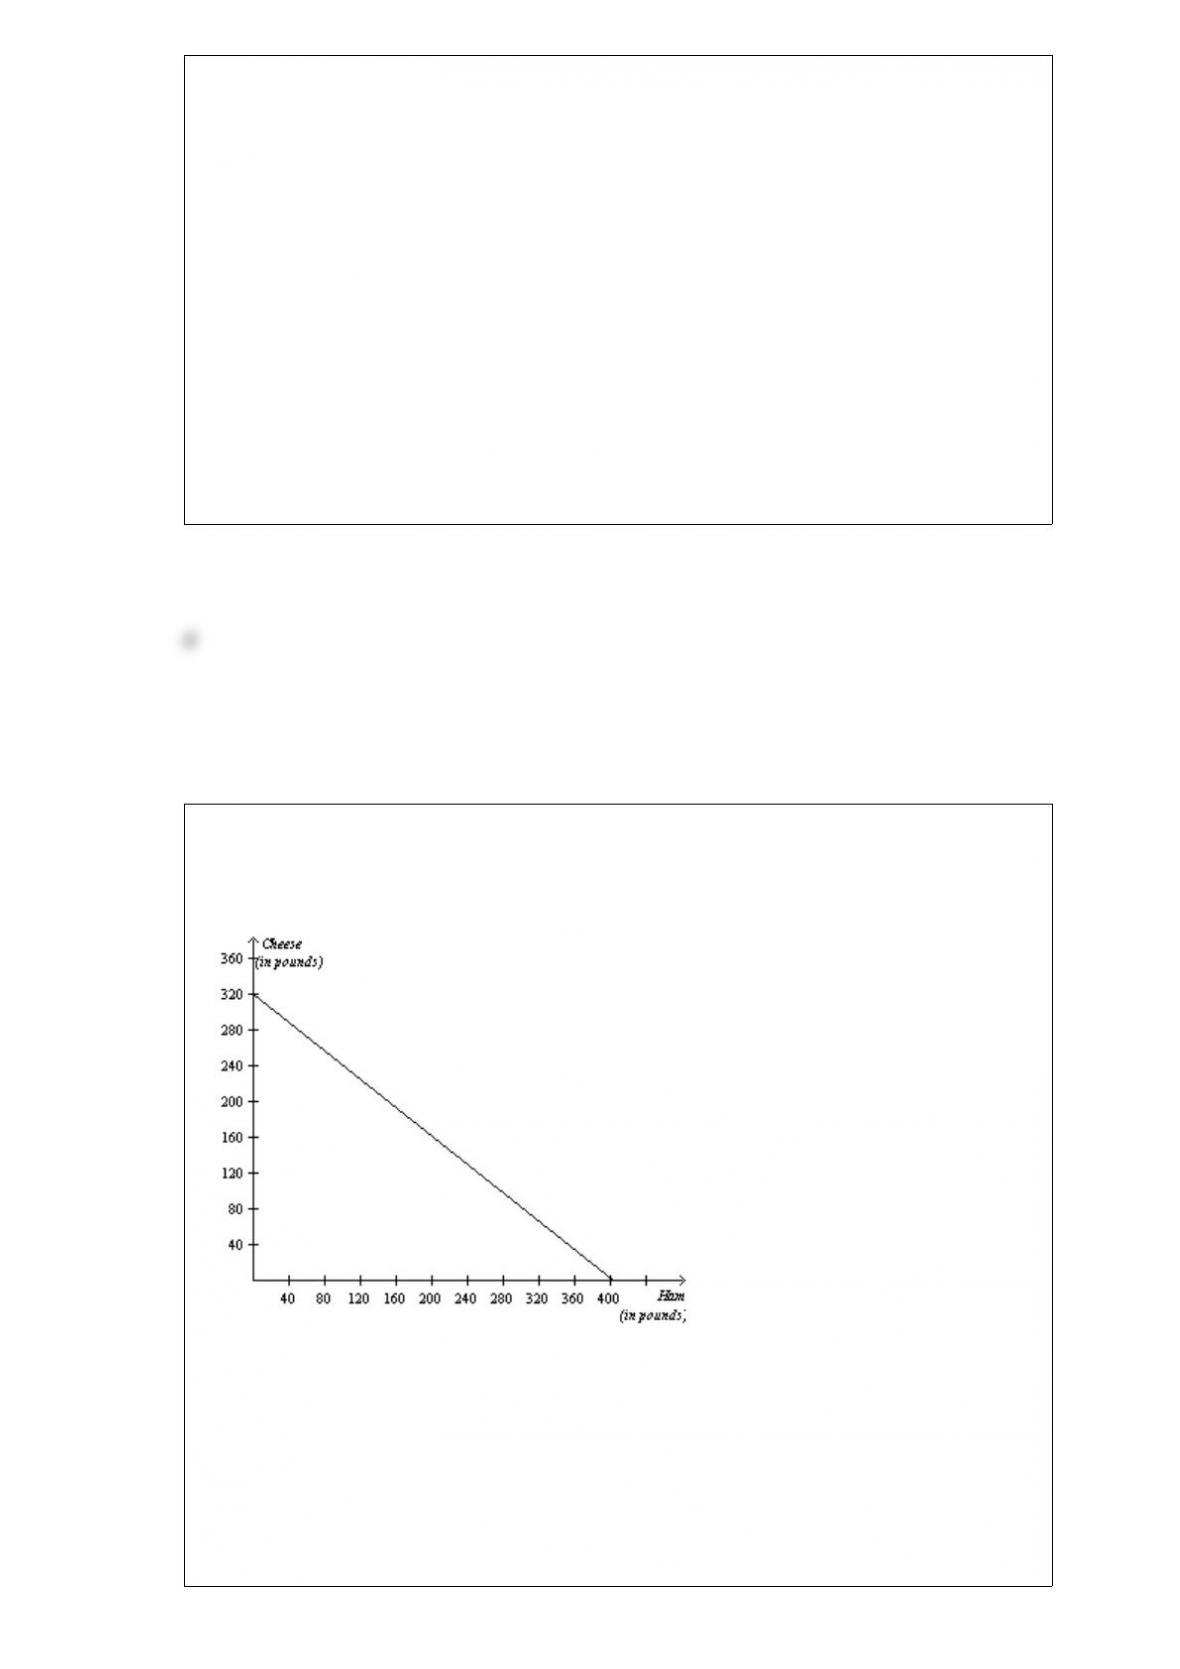
Figure 323
The graph below represents the various combinations of ham and cheese (in pounds)
that the nation of Bonovia could produce in a given month.
Refer to Figure 323. The nation of Cropitia has a comparative advantage over Bonovia
in producing ham if
a. Cropitia can produce more than 400 pounds of ham per month.
b. Cropitia can produce more than 320 pounds of cheese per month.
c. Cropitia’s opportunity cost of producing a pound of ham is less than 0.8 pounds of
cheese.
d. Cropitia’s opportunity cost of producing a pound of ham is greater than 0.8 pounds of
cheese.
Kari downloads 7 songs per month when the price is $1.29 per song and 10 songs per
month when the price is $0.99 per song. Kari’s behavior demonstrates the law of
a. price.
b. supply.
c. demand.
d. income.
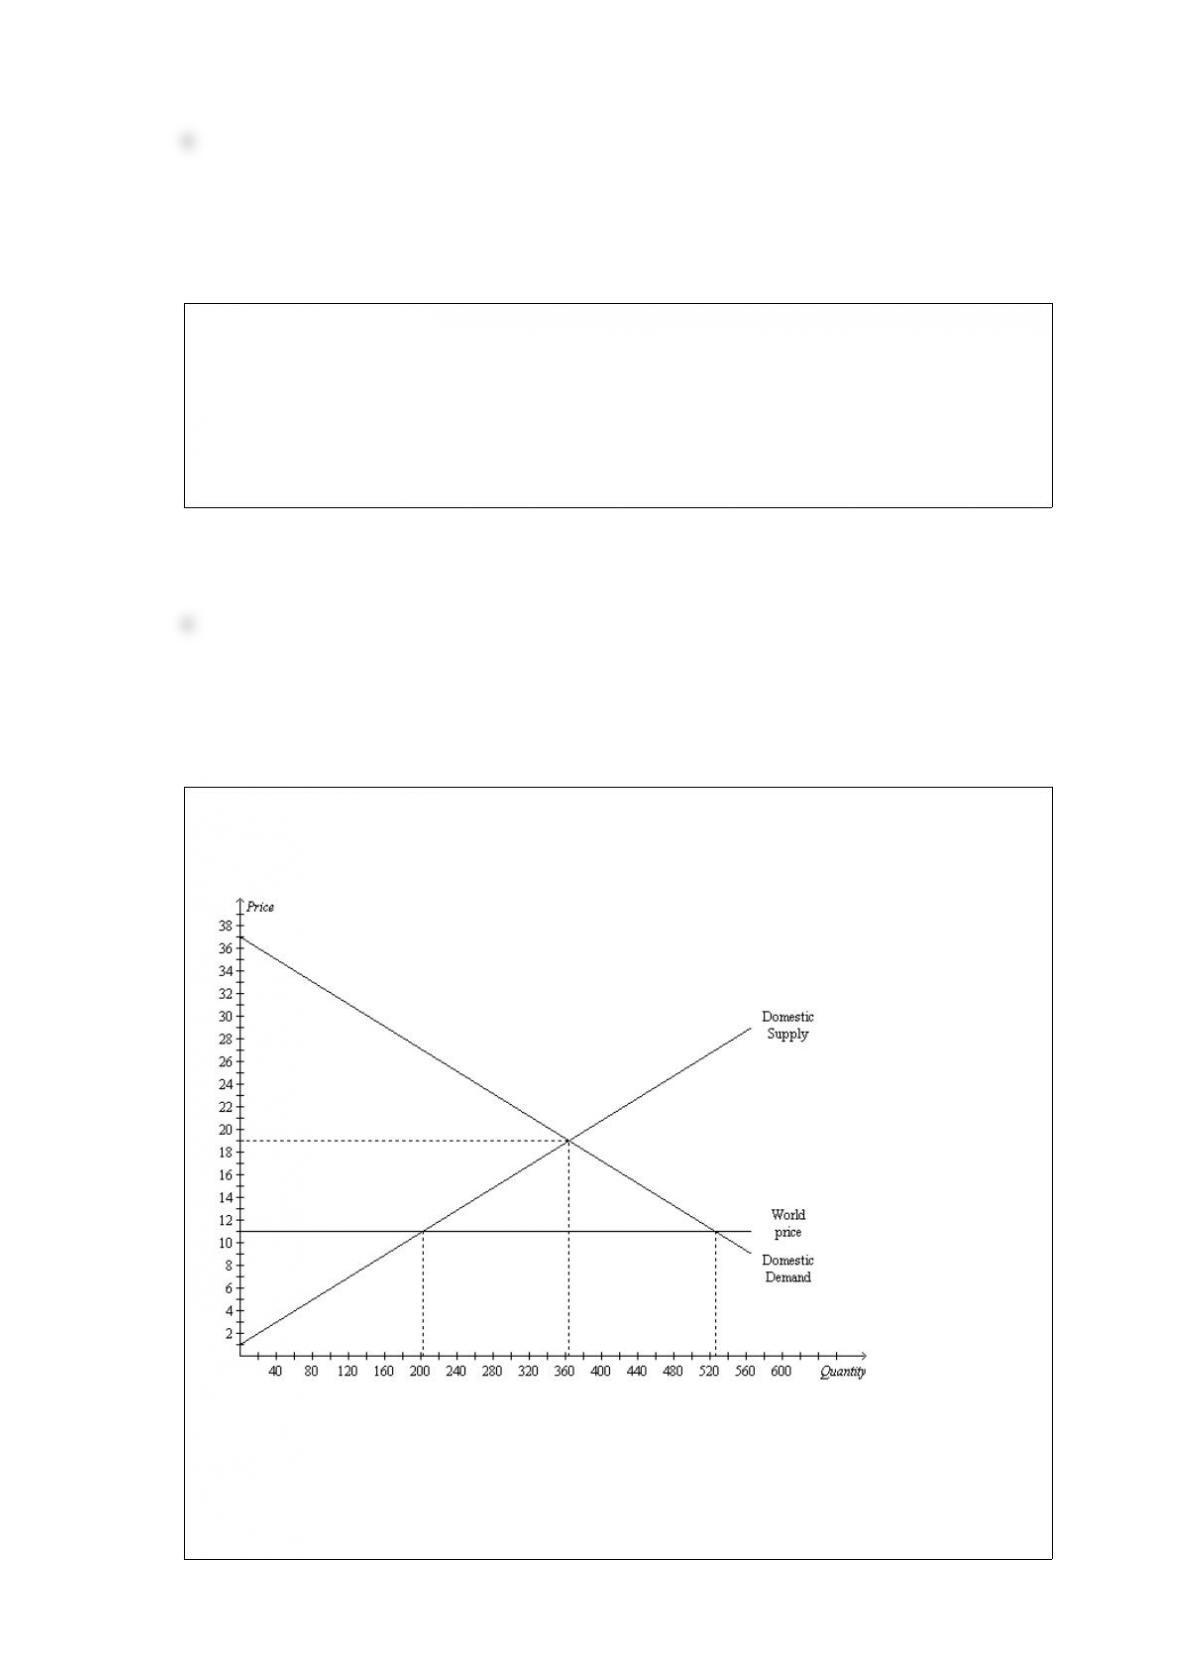
Figure 95
The figure illustrates the market for tricycles in a country.
Refer to Figure 95. Without trade, producer surplus amounts to
a. $810.
b. $1,620.
c. $3,240.
d. $6,480.

Which of the following will cause a decrease in consumer surplus?
a. an increase in the number of sellers of the good
b. a decrease in the production cost of the good
c. sellers expect the price of the good to be lower next month
d. the imposition of a binding price floor in the market
Table 336
Minutes Needed
to Make 1
TowelUmbrella
Antigua1220
Barbuda1510
Refer to Table 336. Assume that Antigua and Barbuda each has 60 minutes available. If
each island spends all its time producing the good in which it has a comparative
advantage, then total production is
a. 4 towels and 3 umbrellas.
b. 5 towels and 6 umbrellas.
c. 8 towels and 10 umbrellas.
d. 9 towels and 9 umbrellas.
The outer loop of the circularflow diagram represents the flows of dollars in the
economy. Which of the following does not appear on the outer loop?
a. wages

b. income
c. capital
d. rent
When her income increased from $10,000 to $20,000, Heather’s consumption of
macaroni decreased from 10 pounds to 5 pounds and her consumption of soyburgers
increased from 2 pounds to 4 pounds. We can conclude that for Heather, macaroni
a. and soyburgers are both normal goods with income elasticities equal to 1.
b. is an inferior good and soyburgers are normal goods; both have income elasticities of
1.
c. is an inferior good with an income elasticity of 1 and soyburgers are normal goods
with an income elasticity of 1.
d. and soyburgers are both inferior goods with income elasticities equal to 1.
Suppose the cost of flying a 100seat plane for an airline is $50,000 and there are 10
empty seats on a flight. The marginal cost of flying a passenger is
a. $50.
b. $500.
c. $50,000.
d. This cannot be determined from the information given.
Figure 89
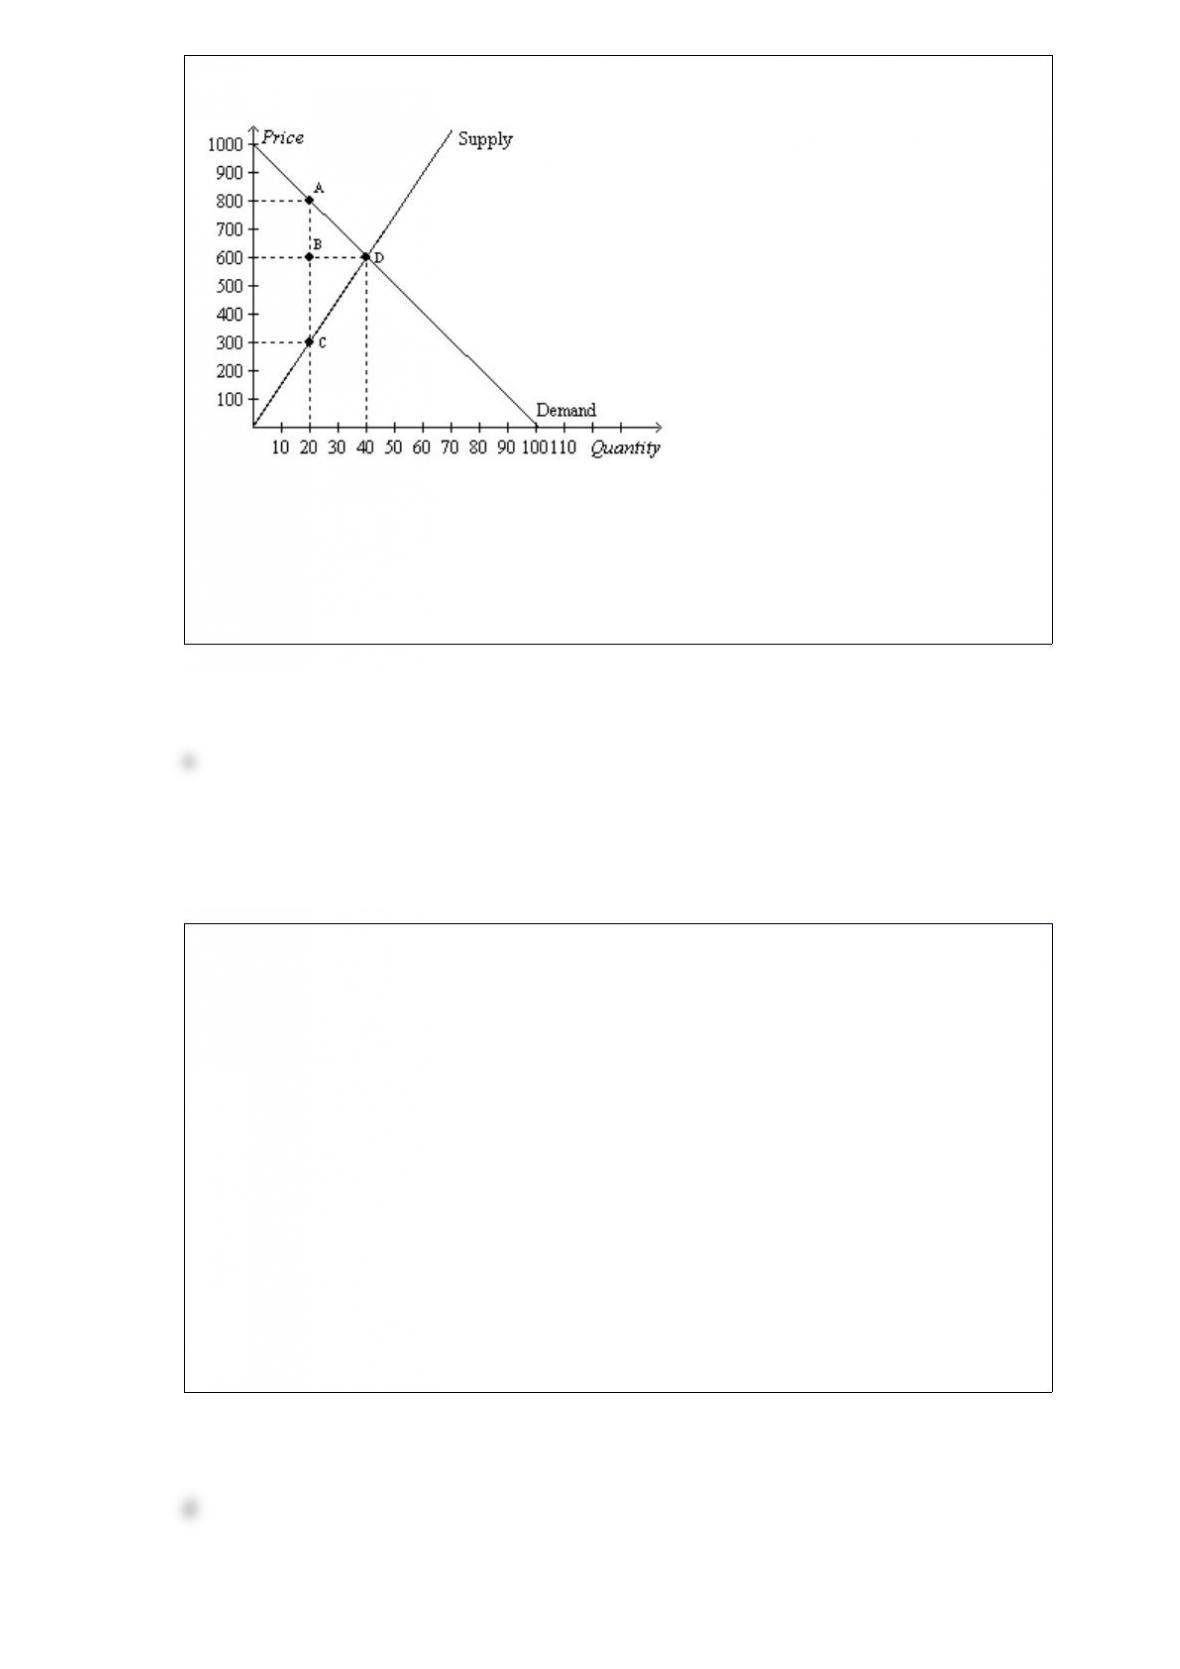
The vertical distance between points A and C represents a tax in the market.
Refer to Figure 89. The consumer surplus with the tax is
a. $2,000.
b. $4,000.
c. $6,000.
d. $8,000.
Table 338
Output produced in one growing season
CornSoybeans
Iowa 3045
Nebraska 4080
Refer to Table 338. Iowa and Nebraska can both produce corn and soybeans, and can
switch between the production of corn and soybeans at a constant rate. The table
illustrates the amount of corn or soybeans each state can produce in one growing
season. Based upon the information in the table, we can determine that
a. Iowa has an absolute advantage in corn and Nebraska has an absolute advantage in
soybeans.
b. Nebraska has an absolute advantage in corn and Iowa has an absolute advantage in
soybeans.
c. Iowa has an absolute advantage in both corn and soybeans.
d. Nebraska has an absolute advantage in both corn and soybeans.
Farm programs that pay farmers not to plant crops on all their land
a. hurt farmers by lowering their total revenue and hurt consumers by causing shortages
of some food items.
b. help farmers by cutting costs, which helps consumers by lowering food prices.
c. help farmers by increasing total revenue in the market but hurt consumers by raising
food prices.
d. help farmers directly since they receive government payments but have no real
effects on consumers.
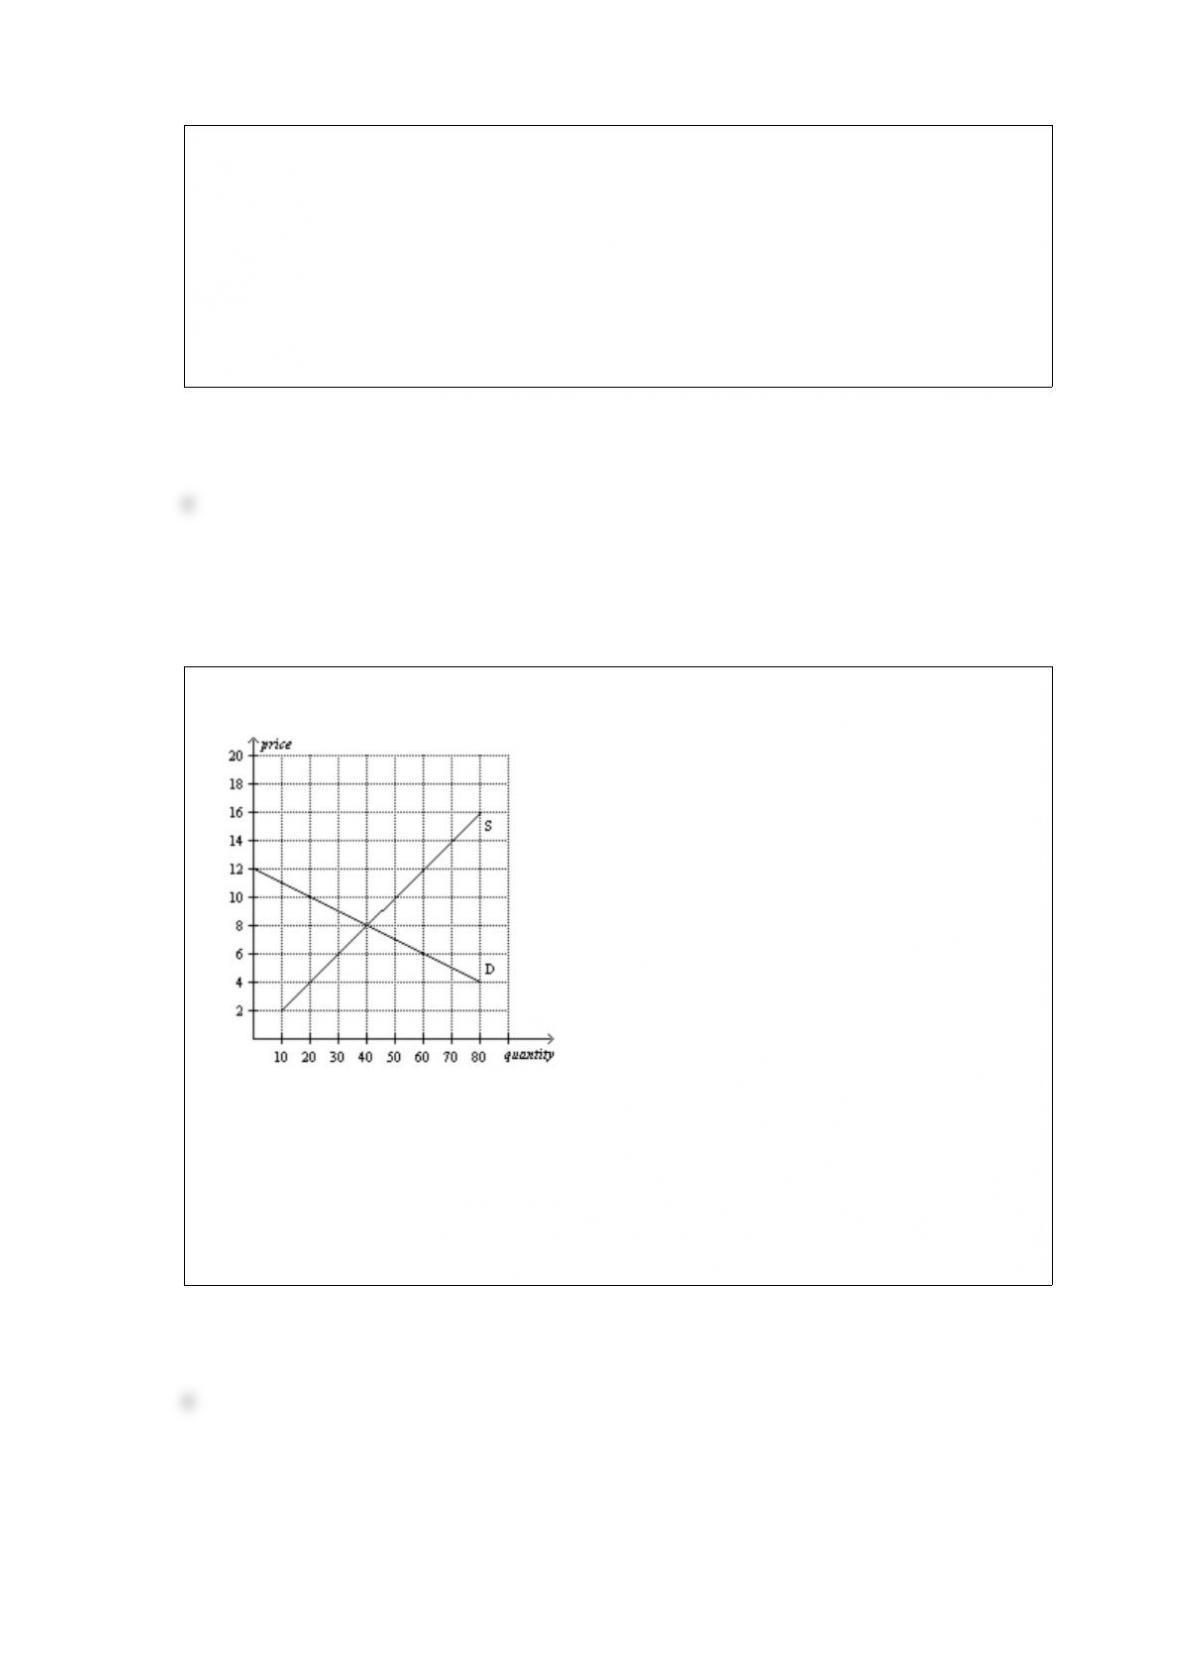
Figure 66
Refer to Figure 66. Which of the following price floors would be binding in this
market?
a. $6
b. $8
c. $10
d. $4
Which of the following ideas is the most plausible?
a. Tax revenue is more likely to increase when a low tax rate is increased than when a
high tax rate is increased.
b. Tax revenue is less likely to increase when a low tax rate is increased than when a
high tax rate is increased.
c. Tax revenue is likely to increase by the same amount when a low tax rate is increased
and when a high tax rate is increased.
d. Decreasing a tax rate can never increase tax revenue.
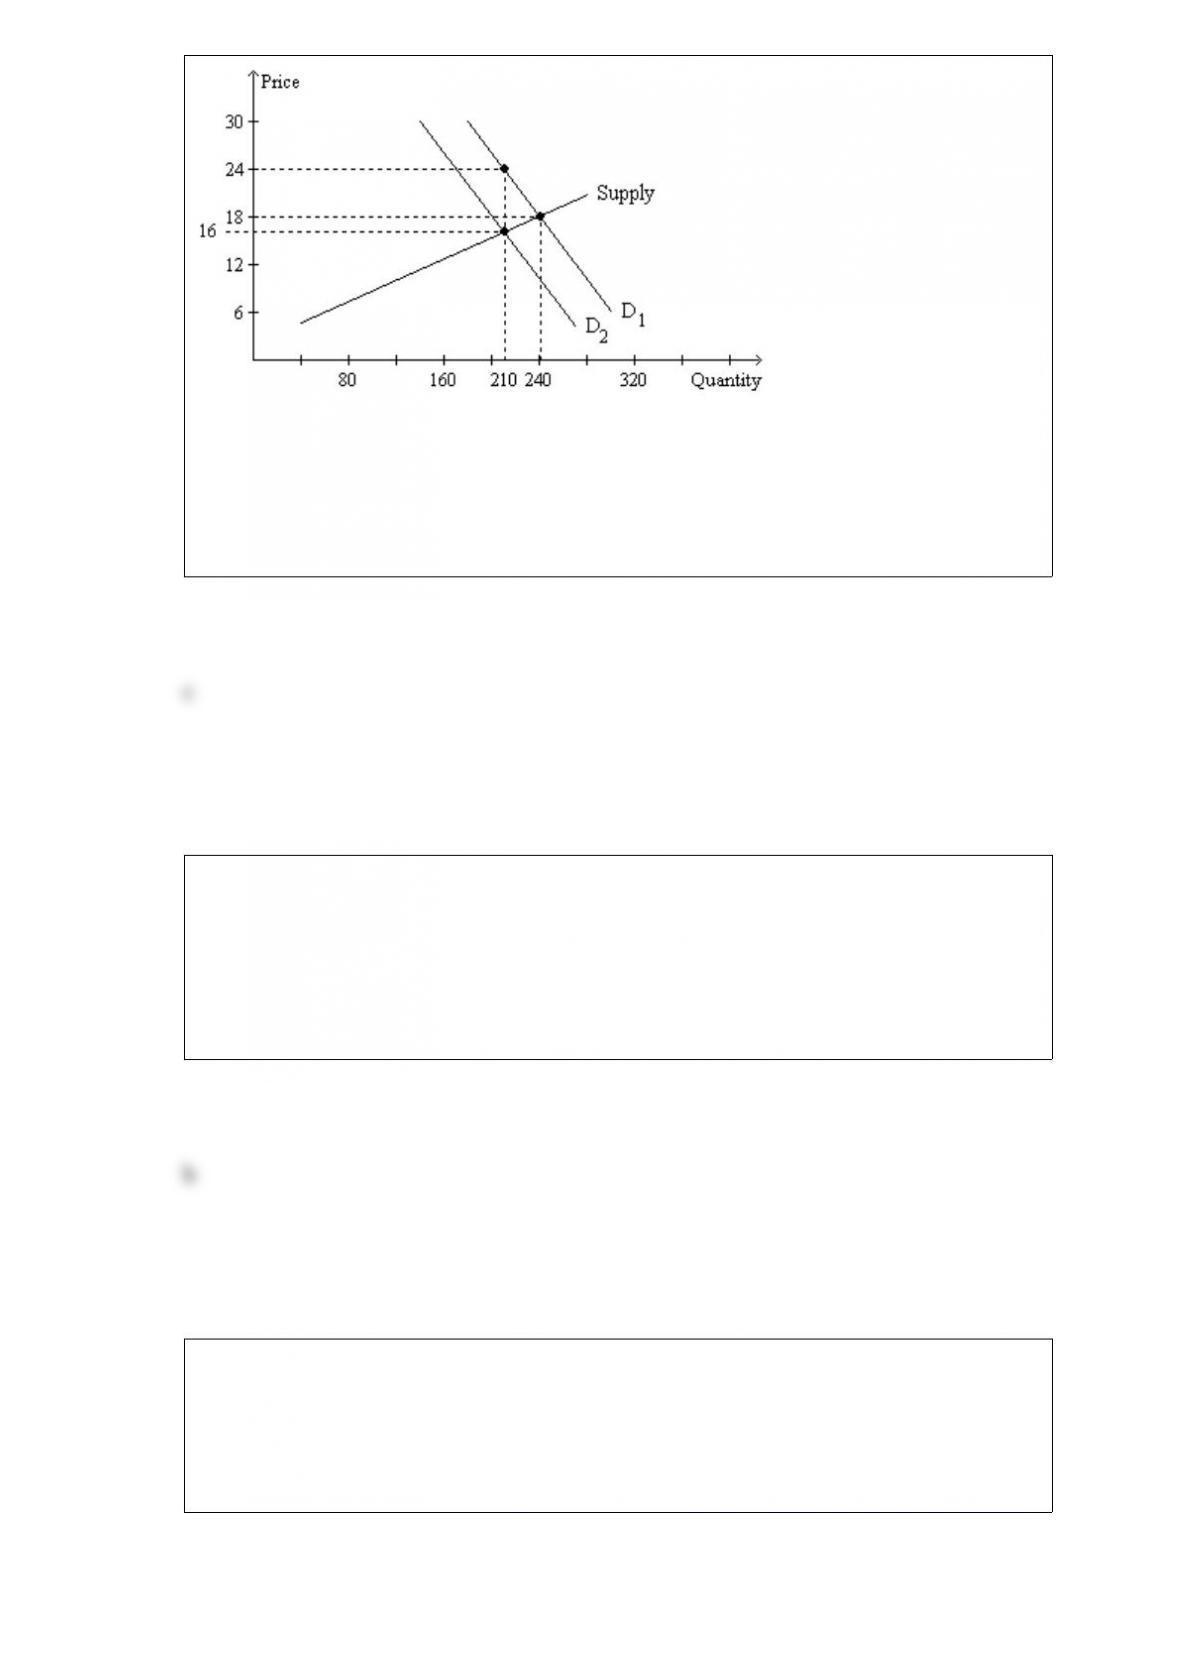
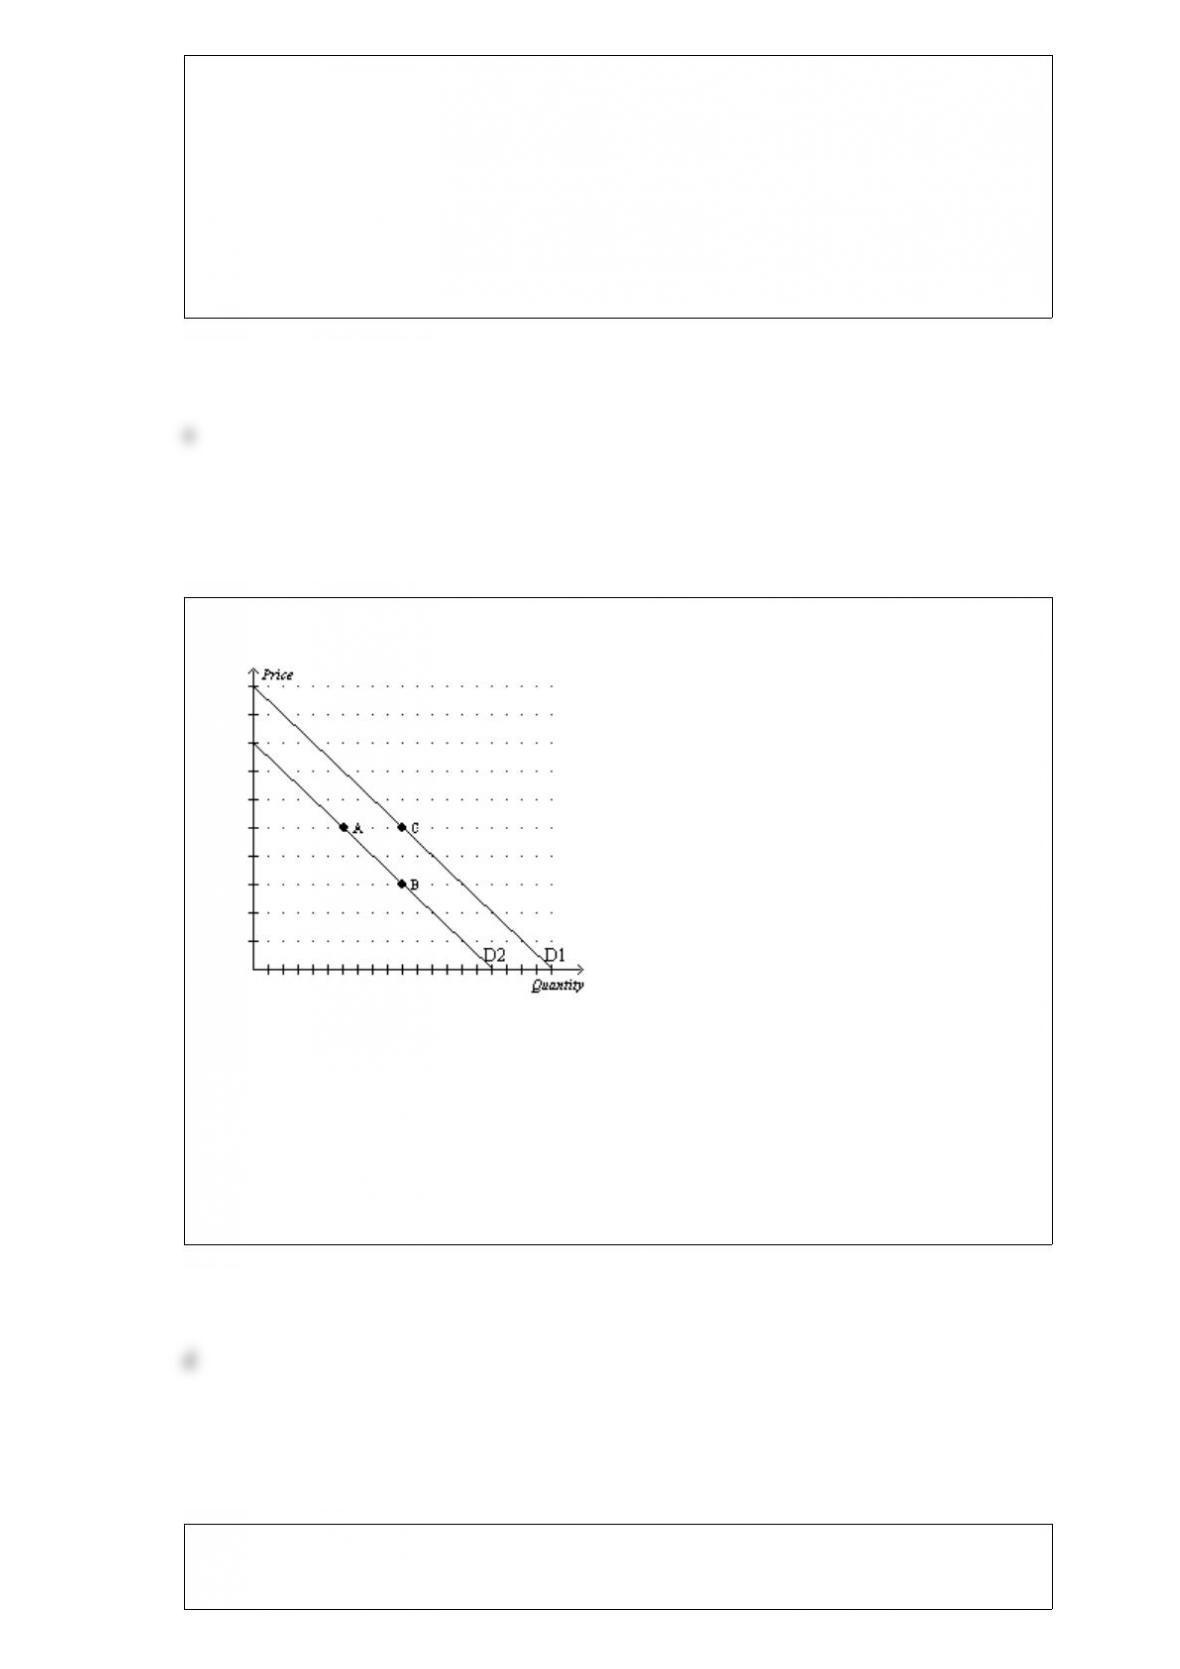
Figure 48
Refer to Figure 48. Suppose the figure shows the market demand for coffee. Suppose
the price of tea, a substitute good, increases. Which of the following changes would
occur?
a. a movement along D2 from point A to point B
b. a movement along D2 from point B to point A
c. a shift from D1 to D2
d. a shift from D2 to D1
Suppose demand is perfectly elastic, and the supply of the good in question decreases.
As a result,

a. the equilibrium quantity decreases, and the equilibrium price is unchanged.
b. the equilibrium price increases, and the equilibrium quantity is unchanged.
c. the equilibrium quantity and the equilibrium price both are unchanged.
d. buyers’ total expenditure on the good is unchanged.
Economists blame the long lines at gasoline stations in the U.S. in the 1970s on
a. U.S. government regulations pertaining to the price of gasoline.
b. the Organization of Petroleum Exporting Countries (OPEC).
c. major oil companies operating in the U.S.
d. consumers who bought gasoline frequently, even when their cars’ gasoline tanks were
nearly full.
In the circularflow diagram, in the markets for
a. goods and services, households and firms are both sellers.
b. goods and services, households are buyers and firms are sellers.
c. the factors of production, households are buyers and firms are sellers.
d. the factors of production, households and firms are both buyers.
The ycoordinate of an ordered pair specifies the
a. diagonal location of the point.
b. vertical location of the point.
c. horizontal location of the point.
d. quadrant location in which the point is located.