
In Bertrand competition with differentiated products and zero marginal costs, Firm
Afaces the demand curve qA= 80 ” 2PA+ 50PB. If Firm Aexpects Firm B to charge a
price of $20, what price should Firm A charge?
A) $14.25
B) $18.00
C) $22.50
D) $24.75
Suppose that Ben and Tim are playing a flag game, a finitely repeated game. The game
starts with 7 flags in the ground and then the players take alternate turns removing the
flags. A player must remove either 1, 2, or 3 flags per turn. The player who takes the
last flag out of the ground, regardless of whether it is by itself or in a group of 2 or 3,
wins the game. Assume that Ben decides first on how many flags to remove. How many
flags should Ben remove on his first turn to guarantee that he will win the game? Use
backward induction to help answer this question.
A) 1
B) 2
C) 3
D) either 1 or 2

Which of the following are examples of moral hazard?
I. An unemployed worker reduced his effort to find a job after he became eligible for
unemployment insurance.
II. Banks make exceptionally risky investments because they expect government
bailouts if their investments fail.
III. After a university made the morning-after pill available on campus, more students
became sexually promiscuous.
A) I, II, and III
B) I only
C) II only
D) I and II
Suppose a firm’s total cost and marginal cost functions are given by TC = 18 + Q + 2Q2
and MC = 1 + 4Q, respectively. What is the output level that minimizes average total
cost?
A) 5
B) 3
C) 4.45
D) 6
In the supply and demand model, it is assumed that:
A) several large sellers can raise prices by restricting output.
B) buyers with bargaining power are able to receive quantity discounts.
C) all the goods in the market sell for the same price.
D) larger firms sell their products at lower prices than smaller firms.
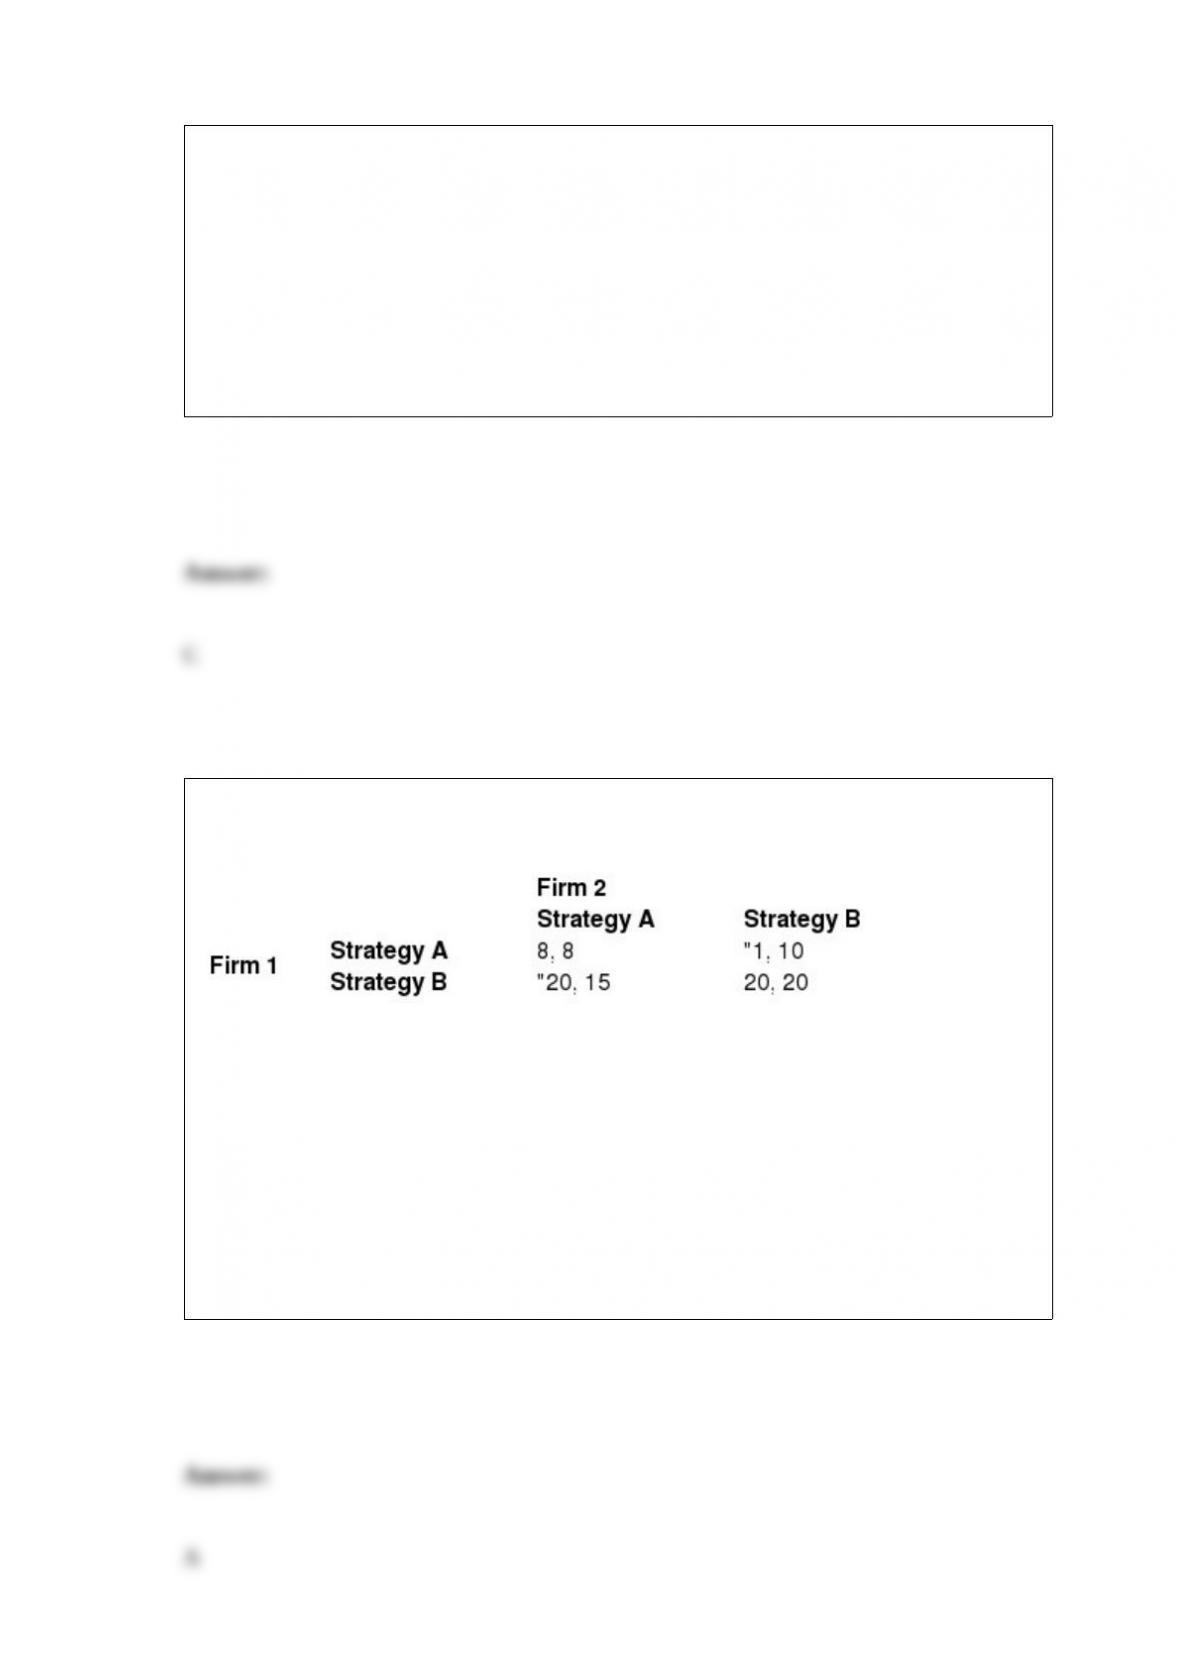
Table 12.12
(Table 12.12) In the table, the payoffs are profits in millions of dollars. The Nash
equilibrium of this game is:
A) (20, 20).
B) (8, 8).
C) (“20, 15).
D) (“1, 10).

Consider the demand curves facing two firms: For demand curve 1, a $4 decrease in
price increases quantity demanded by 2 units. For demand curve 2, a $3 decrease in
price increases quantity demanded by 1 unit. The steeper demand curve is ______, so
an expansion of output drives down marginal revenue more along ______.
A) demand curve 2; demand curve 2 than demand curve 1
B) demand curve 2; demand curve 1 than demand curve 2
C) demand curve 1; demand curve 1 than demand curve 2
D) demand curve 1; demand curve 2 than demand curve 1
Owners of a bowling alley have determined that the price elasticity of demand for
bowling by seniors is “3.0, while the price elasticity of demand for nonseniors is “1.8.
How much more should nonseniors be charged than seniors?
A) 67%
B) 50%
C) 60%
D) 25%
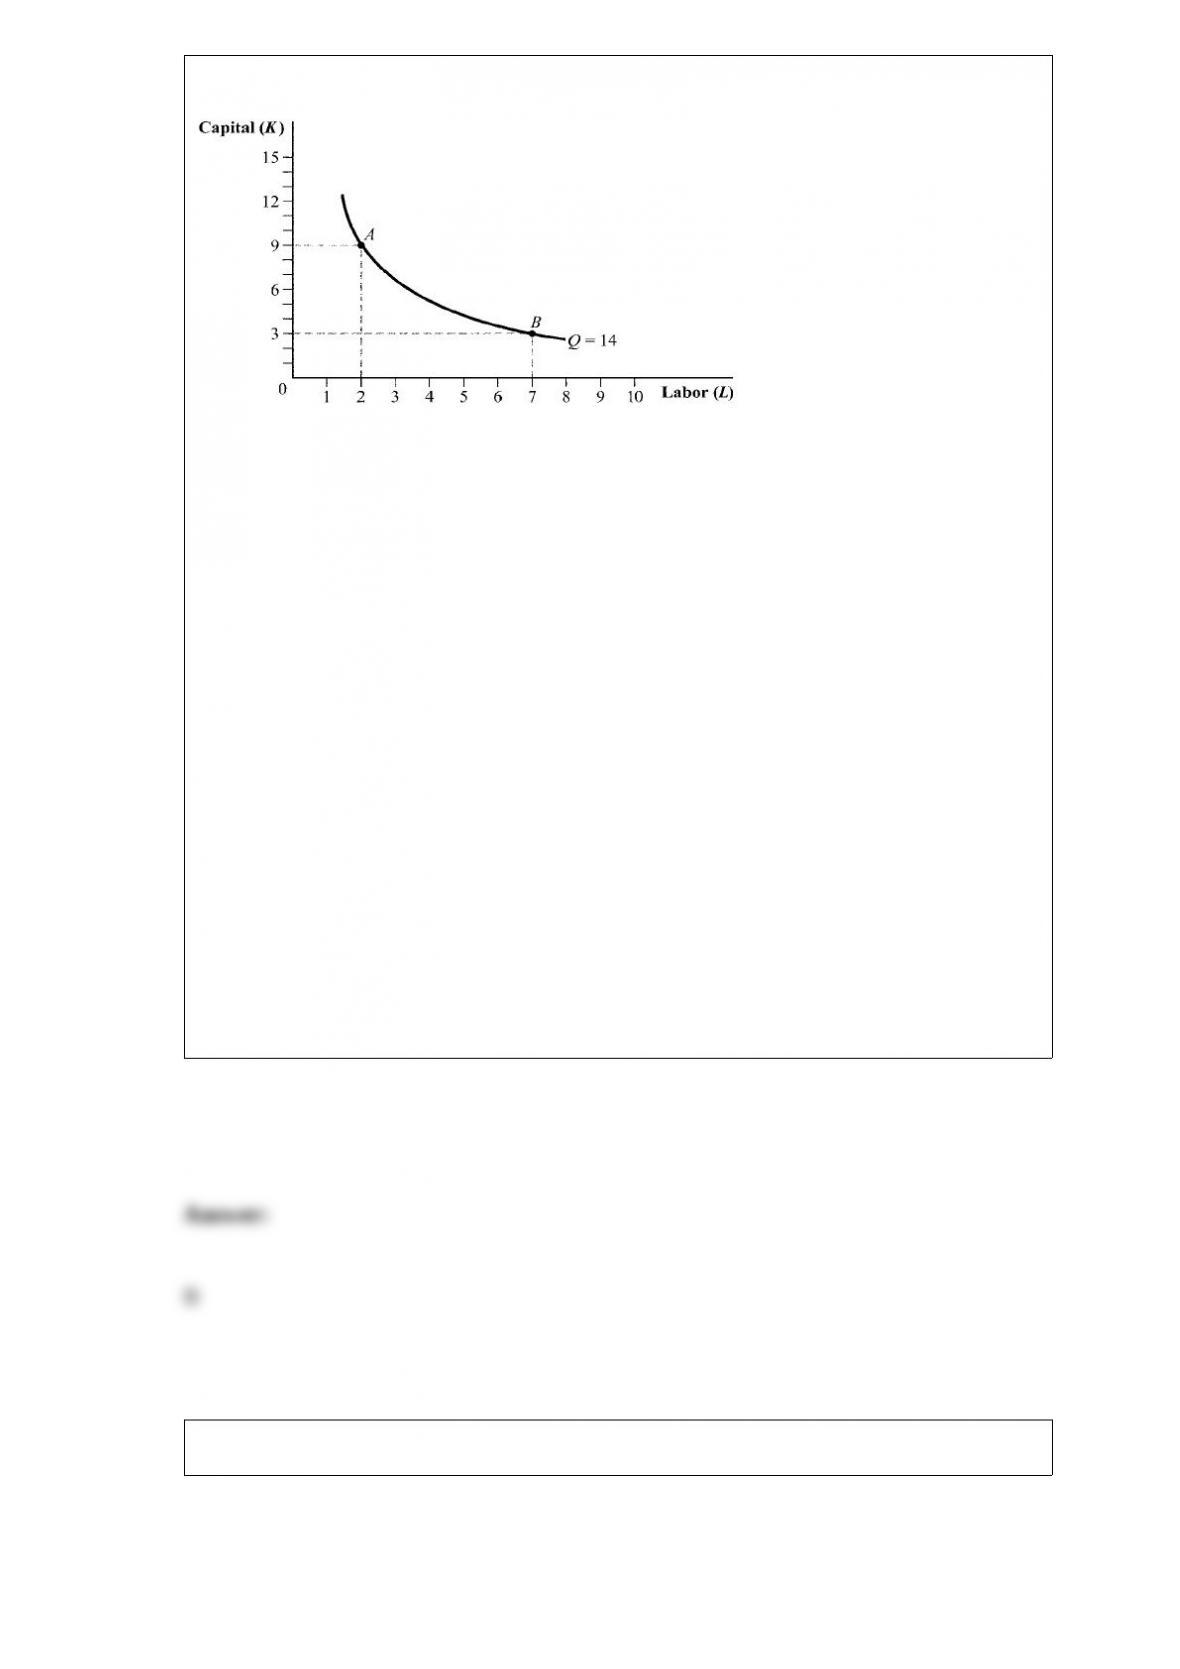
Figure 6.3
(Figure 6.3) Which of the following statements is TRUE?
I. More output is produced at point A than at point B. II. The ratio of the marginal
product of labor to the marginal product of capital is higher at point A than at point B.
III. The MRTSLK is equal at points A and B.
I. More output is produced at point A than at point B.
II. The ratio of the marginal product of labor to the marginal product of capital is higher
at point A than at point B.
III. The MRTSLK is equal at points A and B.
A) I, II, and III
B) II only
C) III only
D) II and III
Figure 8.25
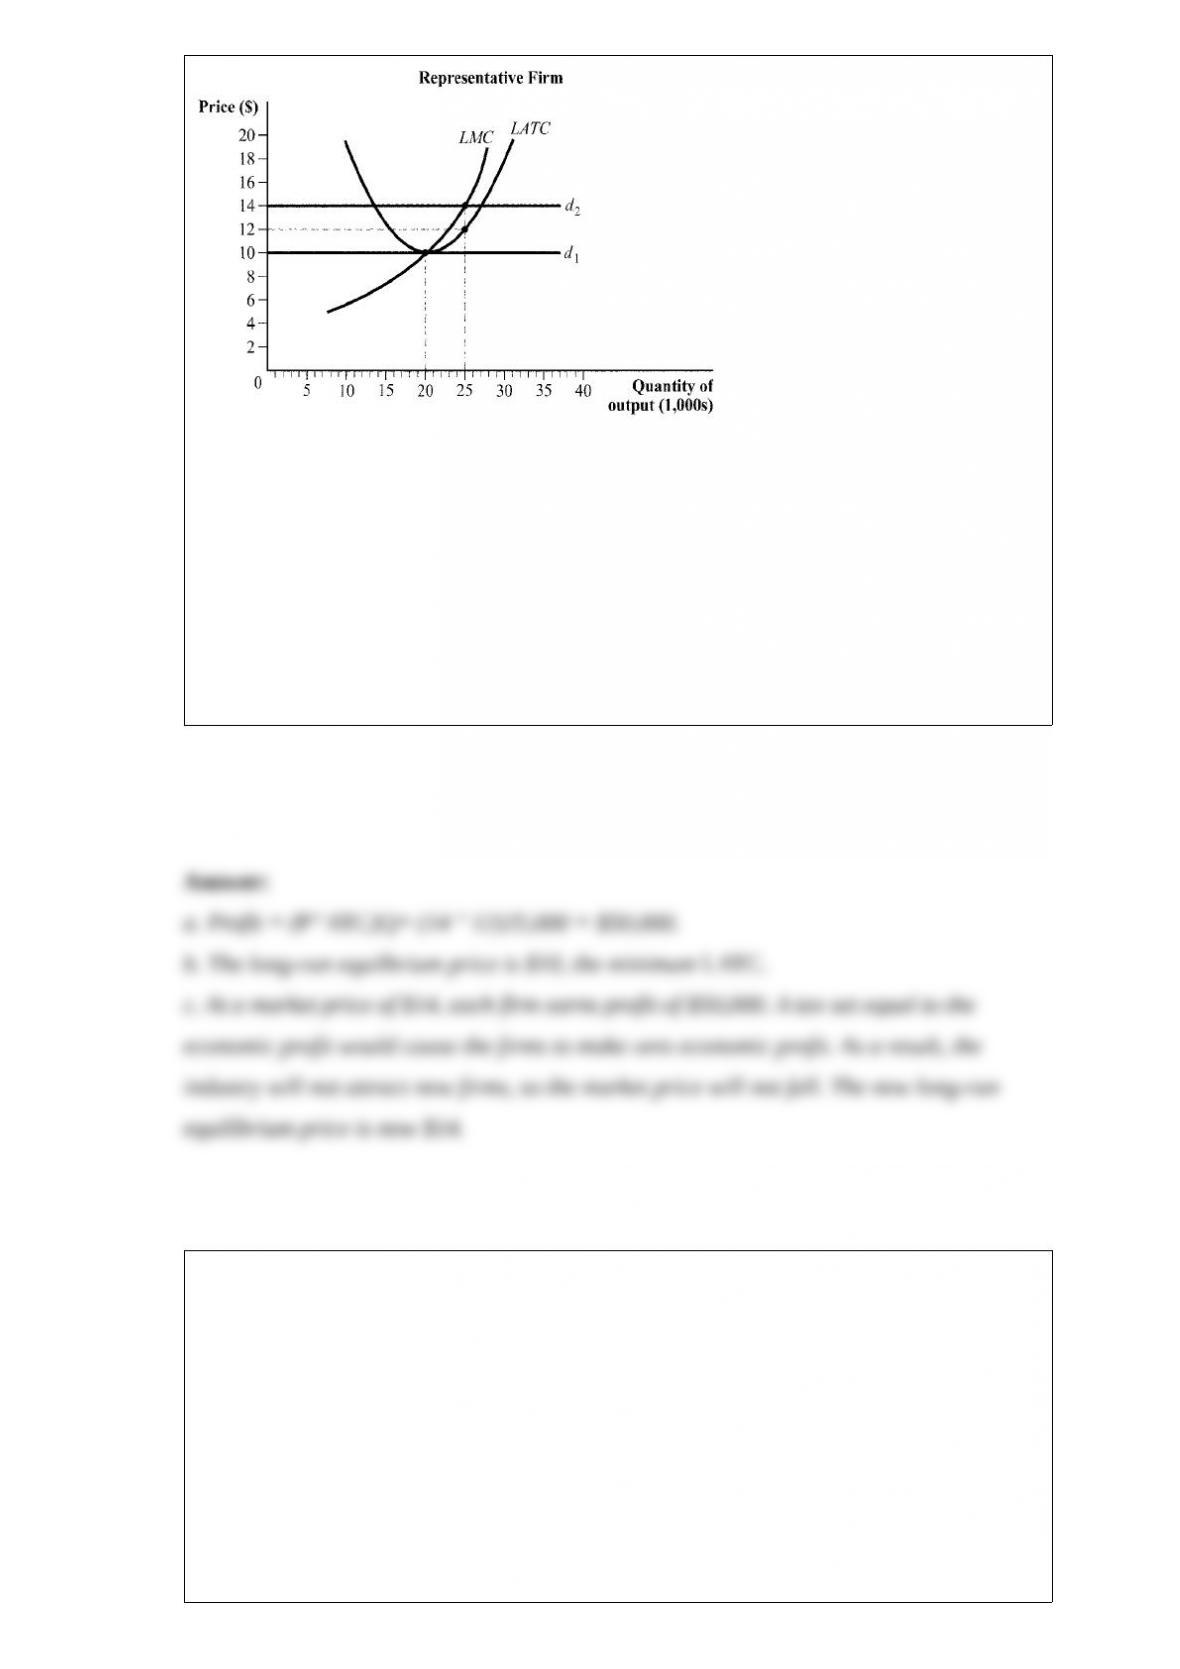
(Figure 8.25) Answer the following questions.
a. Suppose the market price is $14. How much profit is the firm making?
b. What is the long-run equilibrium price in this market?
c. Suppose the market price is $14 and the government places a $50,000 tax on each
firm. What will happen to the long-run equilibrium price? Will the industry expand or
contract?
Researchers examined the effect of hurricanes on Florida counties to examine how
storms affect local labor markets. Because the path and intensity of hurricanes are
random, the researchers are conducting a:
A) compensating differential study.
B) hedonic study.
C) natural experiment.
D) Euclidian experiment.

How has the oral birth control pill affected labor markets?
A) The pill has increased female labor force participation but reduced the number of
years females spend in school.
B) The pill has made it easier for women to pursue careers in business, law, and
medicine, resulting in less-able females choosing teaching careers.
C) The pill has reduced female labor force participation but has no effect on years of
schooling.
D) The availability of the pill has led some women to no longer postpone marriage,
which has caused market wages to rise as females quit work upon marrying.
Figure 9.1
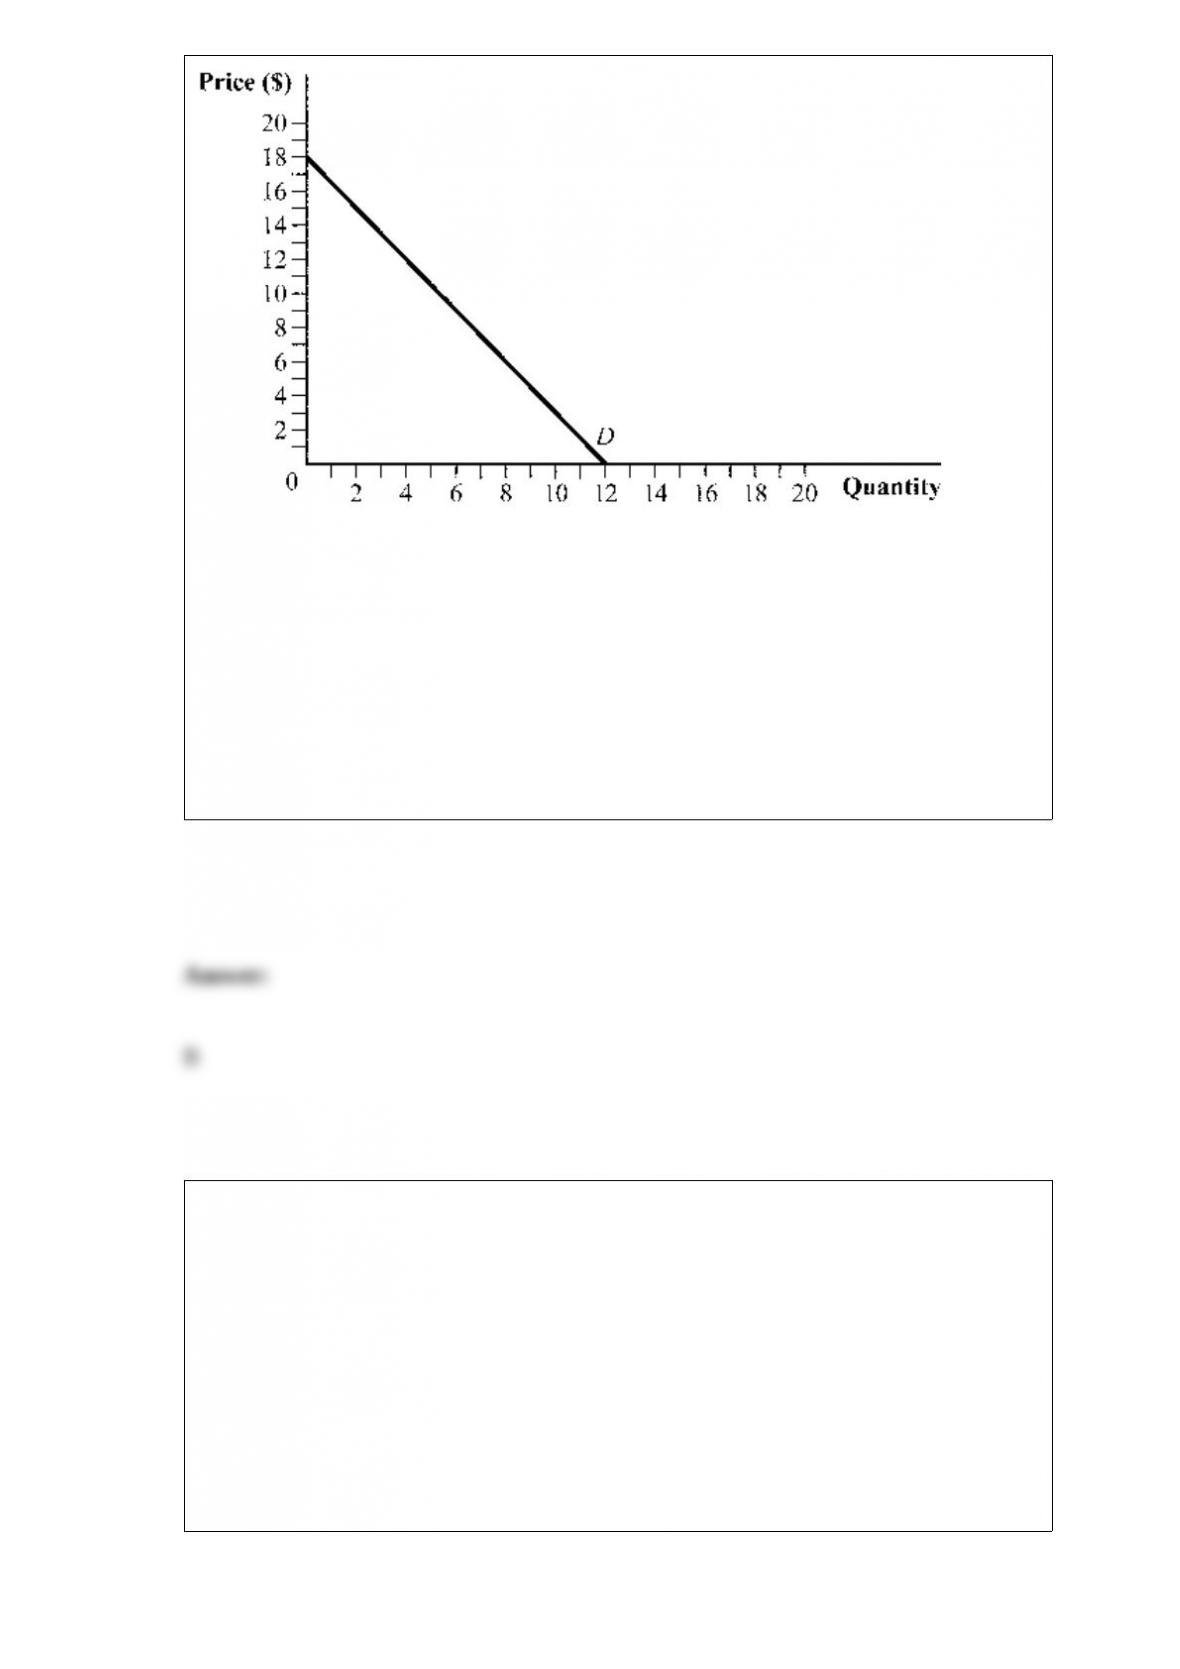
(Figure 9.1) What is this firm’s marginal revenue curve?
A) MR = 6
B) MR = 18 ” 3Q
C) MR = 18 ” 1.5Q
D) MR = 12 ” 0.5Q
Luigi drives two hours to a store to buy a Mikata circular saw. Unfortunately, the store
sold its last Mikata saw just before Luigi arrived. Luigi decides to buy a lesser-quality
saw so that his two-hour trip was not a waste of time. Luigi is committing the:
A) sunk-cost fallacy.
B) marginal comparison fallacy.
C) ceteris paribus fallacy.
D) harmonization conundrum.

What type of government policy aimed at increasing efficiency would create the
smallest efficiency losses?
A) payroll taxes
B) lump-sum transfers
C) corporate taxes
D) capital gains taxes
Consider the breakfast cereal market, where Post and General Mills must
simultaneously decide whether to spend money on advertising their new tuna crunch
cereal. If both companies advertise, each company will earn profits of $6 million. If
neither company advertises, each company will earn profits of $8 million. However, if
one company advertises and the other does not, the company that advertises earns
profits of $12 million and the company that does not earns profits of $3 million.
Explain why the following outcomes are either a Nash equilibrium or not a Nash
equilibrium.
a. General Mills advertises and Post does not advertise.
b. Neither General Mills nor Post advertises.
c. Both General Mills and Post advertise.

Suppose that farmers can use their land to grow and sell soybeans and cotton. How
would farmers respond to rising cotton prices?
A) Farmers would respond by producing less cotton and more soybeans.
B) Farmers would respond by decreasing the supply of soybeans and producing more
cotton.
C) Farmers would respond by increasing the supply of soybeans and cotton.
D) Farmers would decrease the supply of soybeans and cotton.
The firm’s long-run total cost is given by LTC = 5,000Q ” 100Q2 + Q2 and its long-run
marginal cost is given by LMC = 5,000 ” 200Q + 3Q2. At what output level does the
firm experience diseconomies of scale?
A) Q > 30
B) Q > 50

C) Q > 245
D) Q < 245
The purchase price for Stata version 12 (a leading statistical software program used by
many economists) is $895. For users of Stata version 11, the price to upgrade to version
12 is $395. Which of the following statements is TRUE regarding this pricing scheme?
A) Stata is using a two-part tariff strategy.
B) Stata is segmenting its market based on past purchasing behavior.
C) Stata is practicing first-degree price discrimination by charging different groups
different prices.
D) The current users of Stata are less price-sensitive than the noncurrent users.
In monopolistic competition, the long-run equilibrium price ______ marginal cost
because ______.
A) equals; firms earn zero economic profit
B) exceeds; firms face downward-sloping demand curves
C) exceeds; there are significant barriers to entry
D) less than; firms set their production plans simultaneously

Fisher’s utility function for trout (T) and salmon (S) is given by U = ST, where the
MUT= S and MUs= T. Which set of consumption bundles lies on the same indifference
curve?
A) bundles of (S = 2 and T = 4) and (S = 3 and T = 3)
B) bundles of (S = 5 and T = 5) and (S = 25 and T = 1)
C) bundles of (S = 10 and T = 2) and (S = 5 and T = 1)
D) bundles of (S = 8 and T = 6) and (S = 7 and T = 10)
A firm with the ability to affect the price of its product:
A) faces a downward-sloping demand curve.
B) has no demand curve (i.e., the relationship between price and quantity demanded
breaks down).
C) has a perfectly elastic demand curve.
D) can sell whatever quantity it produces without changing its price.
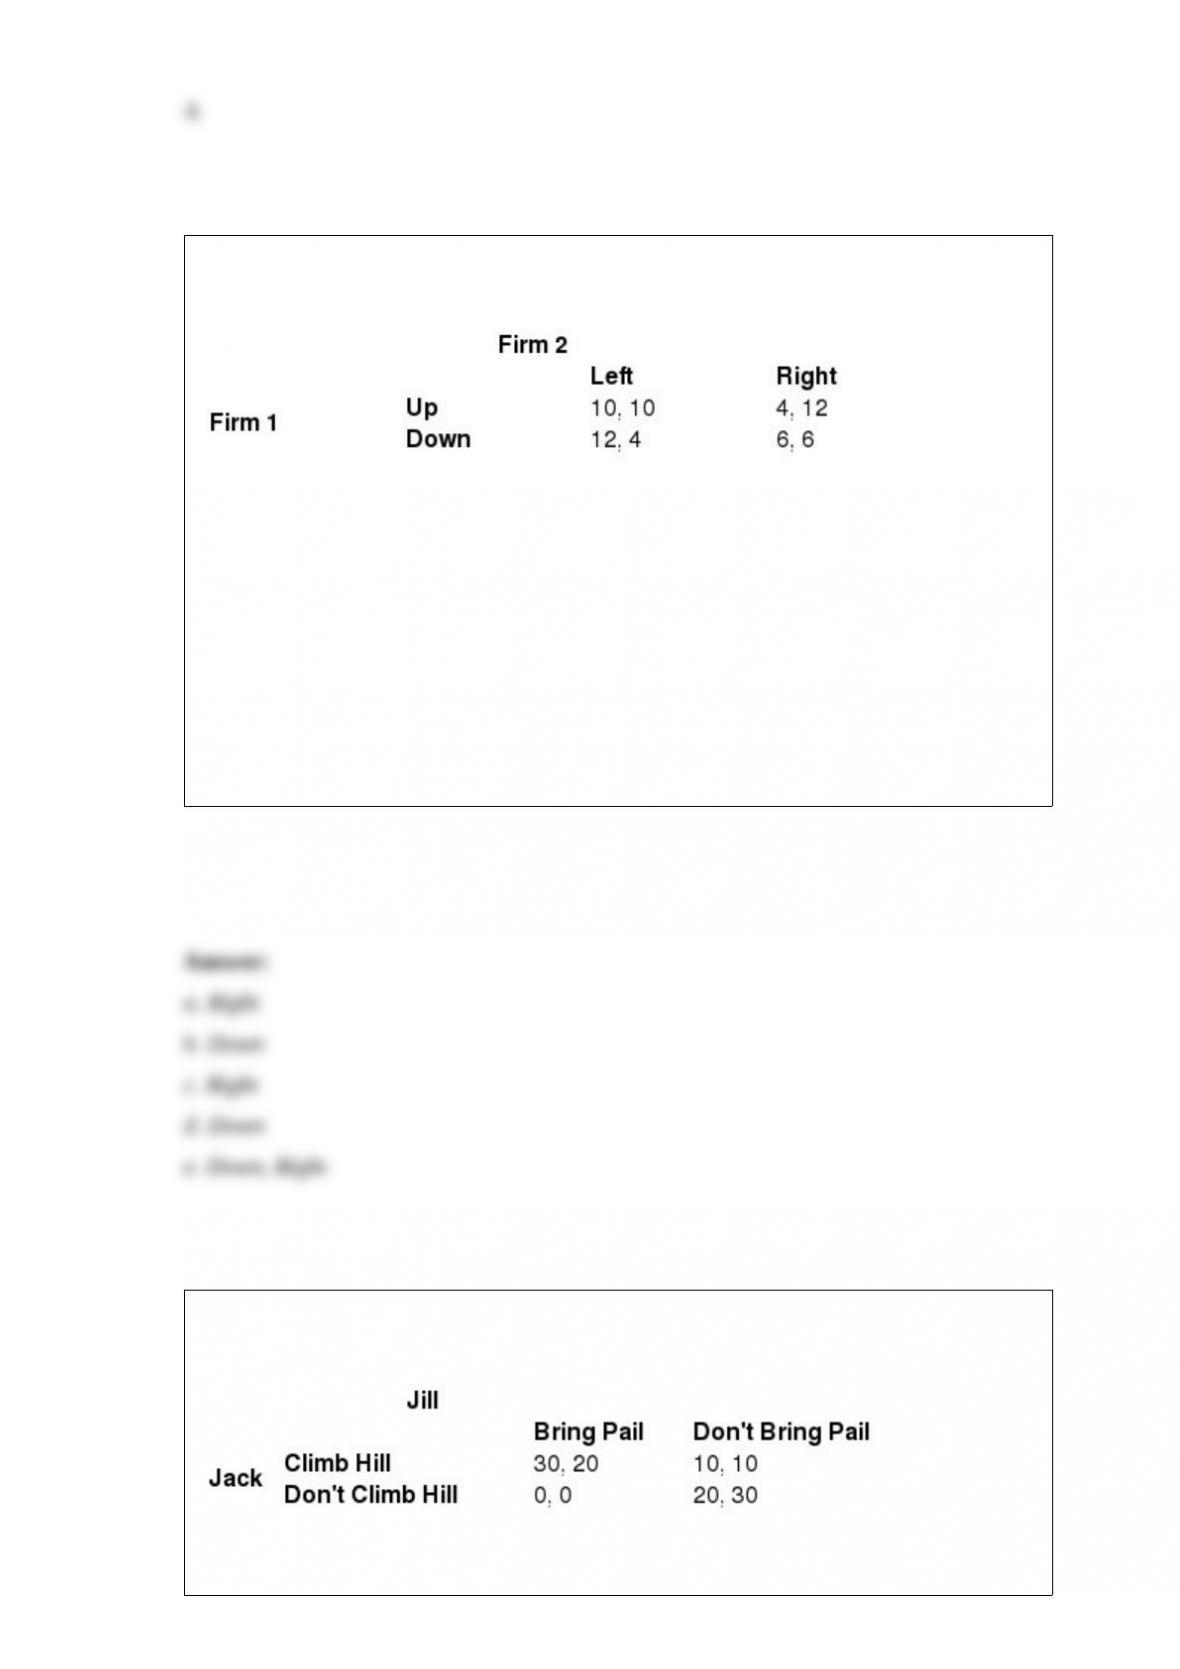
Table 12.25
(Table 12.25) In the table, payoffs represent profits in millions of dollars.
a. If Firm 1 chooses Up, what is the best strategy for Firm 2?
b. If Firm 2 chooses Left, what is the best strategy for Firm 1?
c. If Firm 1 chooses down, what is the best strategy for Firm 2?
d. If Firm 2 chooses Right, what is the best strategy for Firm 1?
e. What is the game’s Nash equilibrium?
Table 12.23
(Table 12.23)
a. What are Jack’s strategies?
b. What are Jill’s strategies?
c. If Jack chooses to climb the hill and Jill doesn’t bring the pail, what are the payoffs to
Jack and Jill?
d. If Jack chooses to not climb the hill and Jill brings the pail, what are the payoffs to
Jack and Jill?
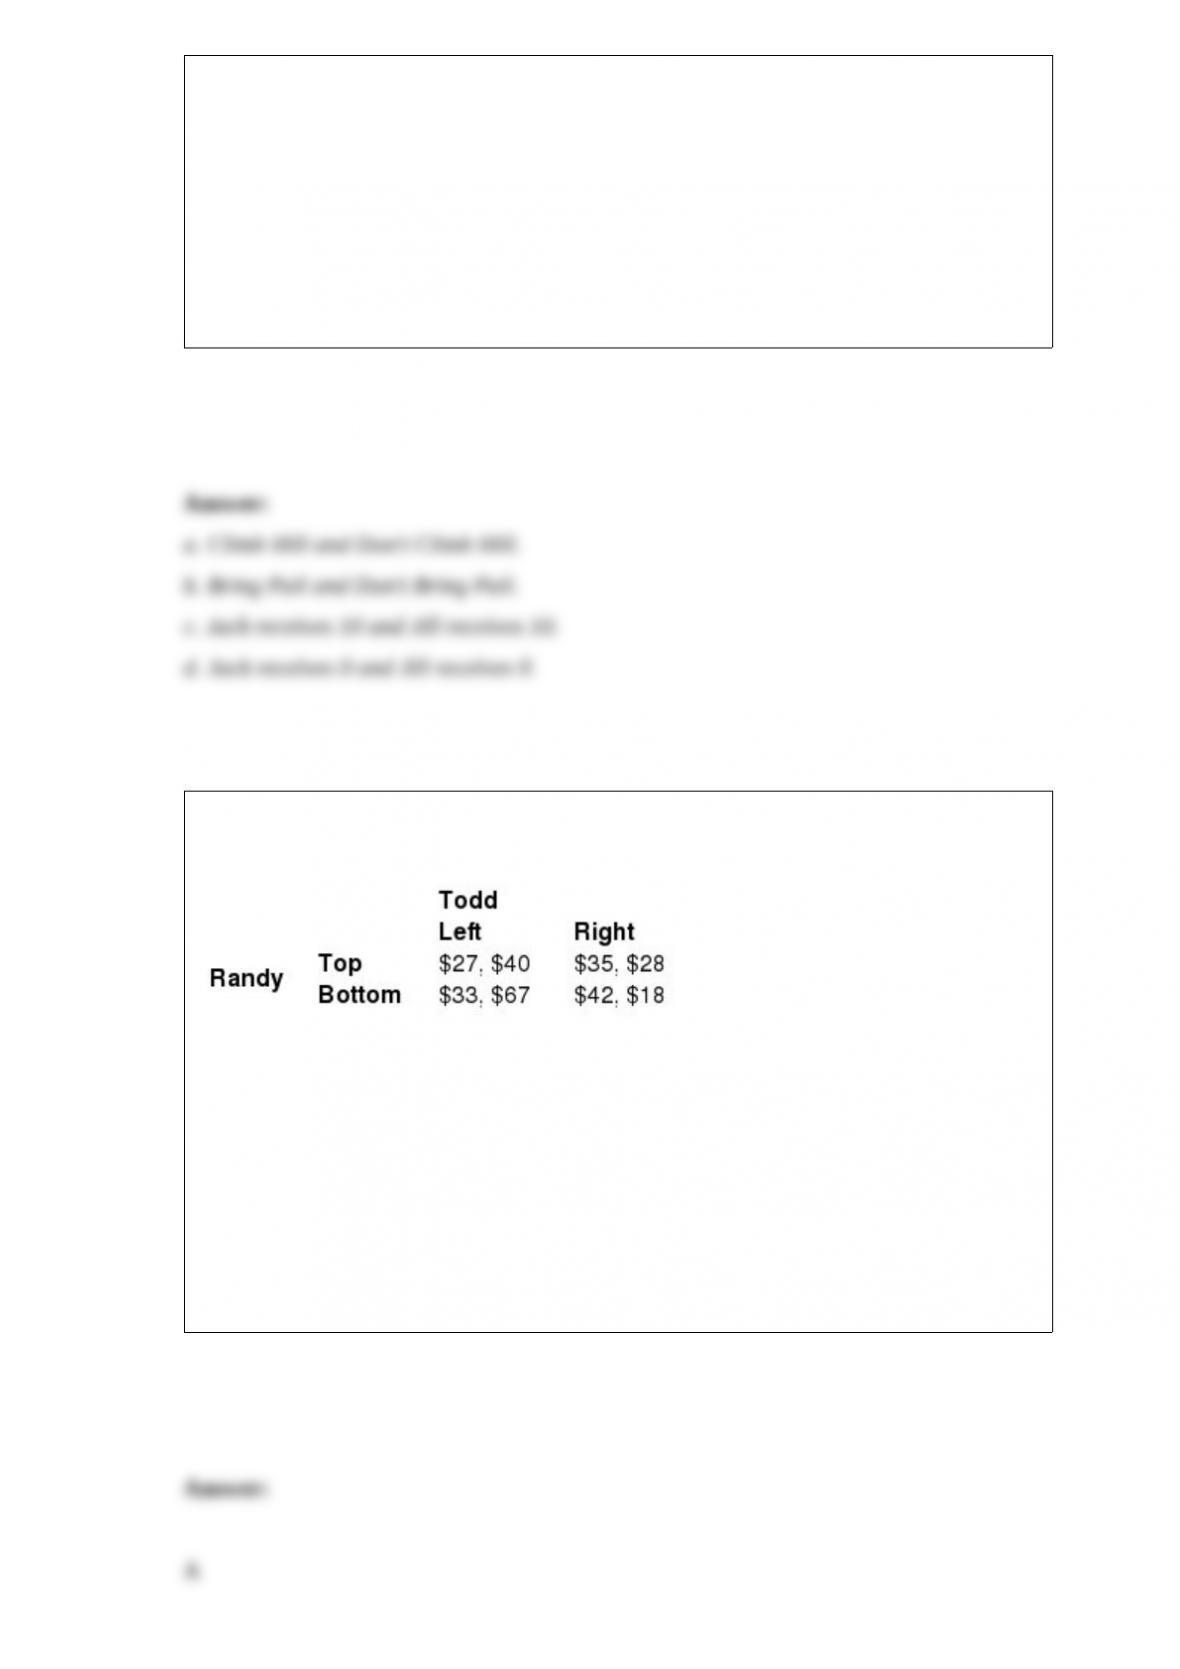
Table 12.1
(Table 12.1) Randy and Todd are playing a simultaneous game. What are Randy’s and
Todd’s dominant strategies?
A) Randy’s dominant strategy is Bottom and Todd’s dominant strategy is Left.
B) Randy’s dominant strategy is Top and Todd’s dominant strategy is Left.
C) Randy’s dominant strategy is Bottom and Todd’s dominant strategy is Right.
D) Randy’s dominant strategy is Top and Todd’s dominant strategy is Right.
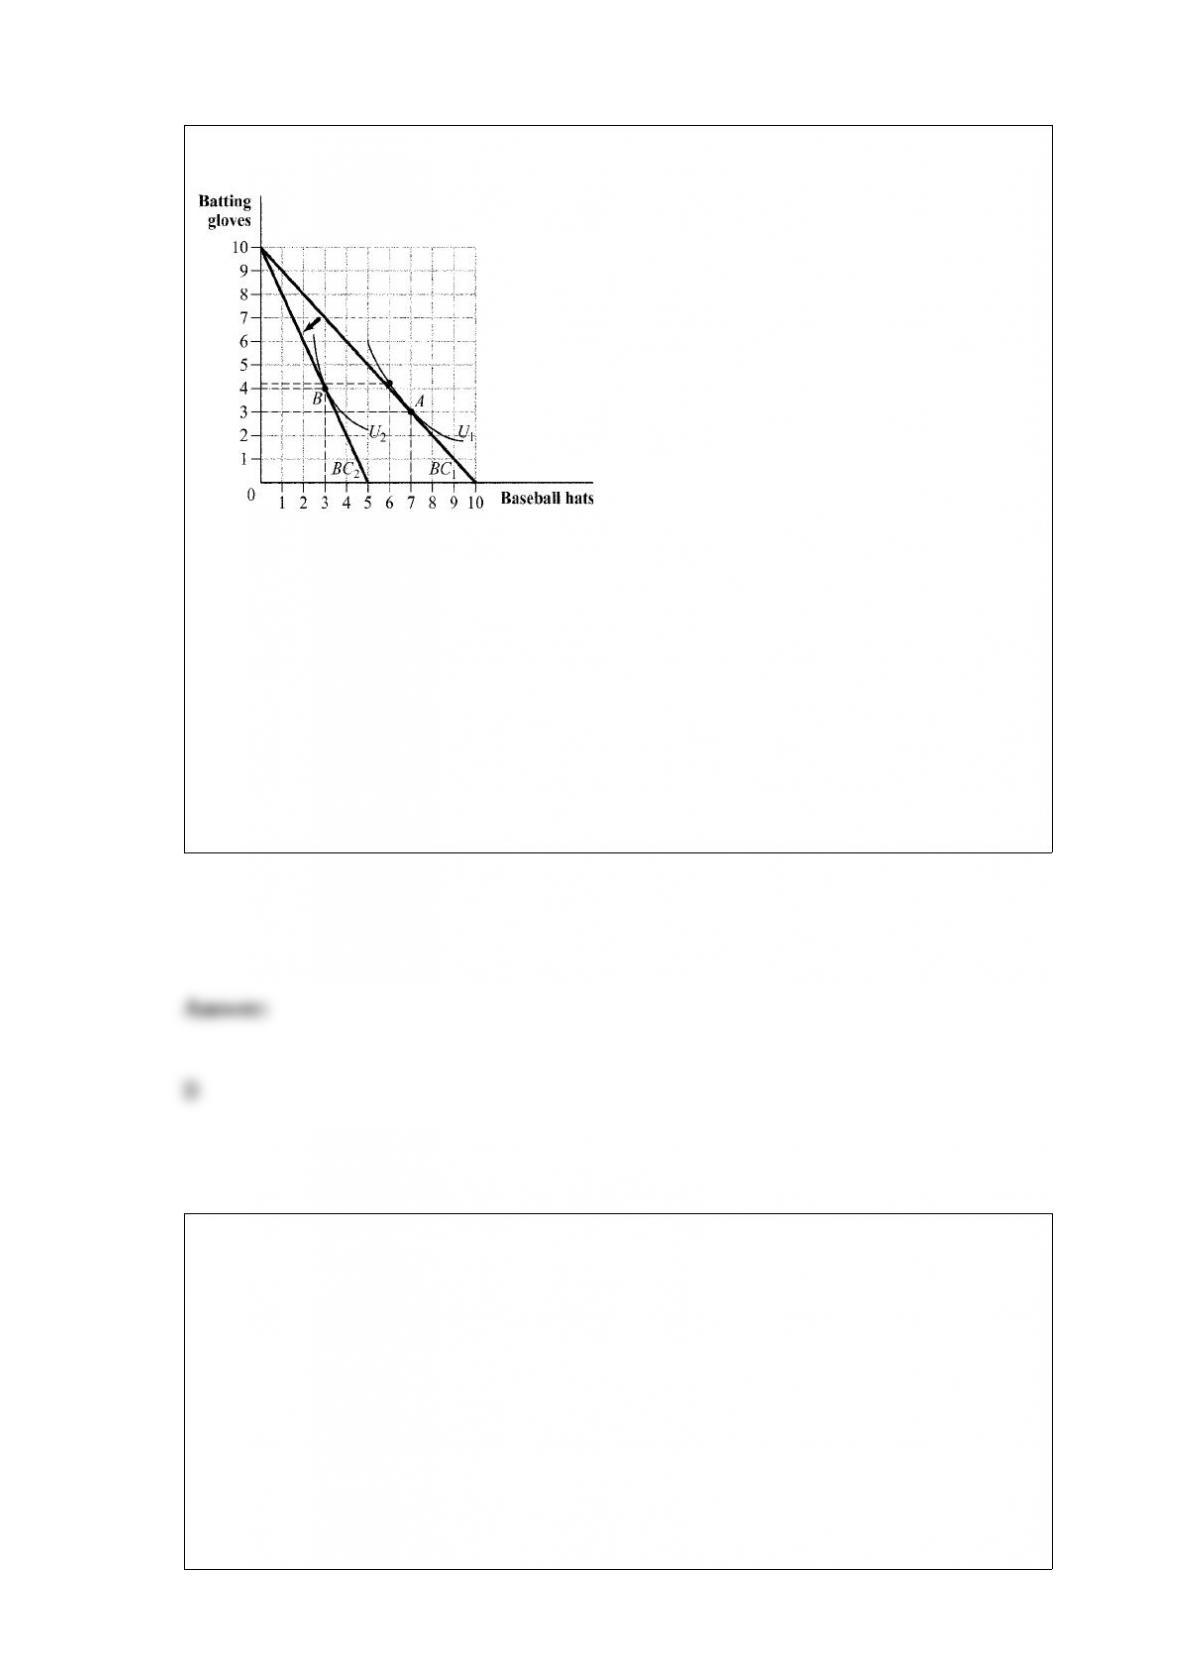
Figure 5.16
(Figure 5.16) The income effect of the price increase causes consumption of baseball
hats to:
A) decrease by 1.
B) decrease by 3.
C) decrease by 4.
D) increase by 1.
The demand and supply curves for Fuji apples are given by QD = 50″ 6P and QS = 4P ”
2, where P is price per bag and Q measures thousands of bags. What is consumer and
producer surplus at the equilibrium price?
A) CS = $450; PS = $375
B) CS = $856,000; PS = $1,126,113
C) CS = $15,006; PS = $7,657
D) CS = $29,422; PS = $44,180
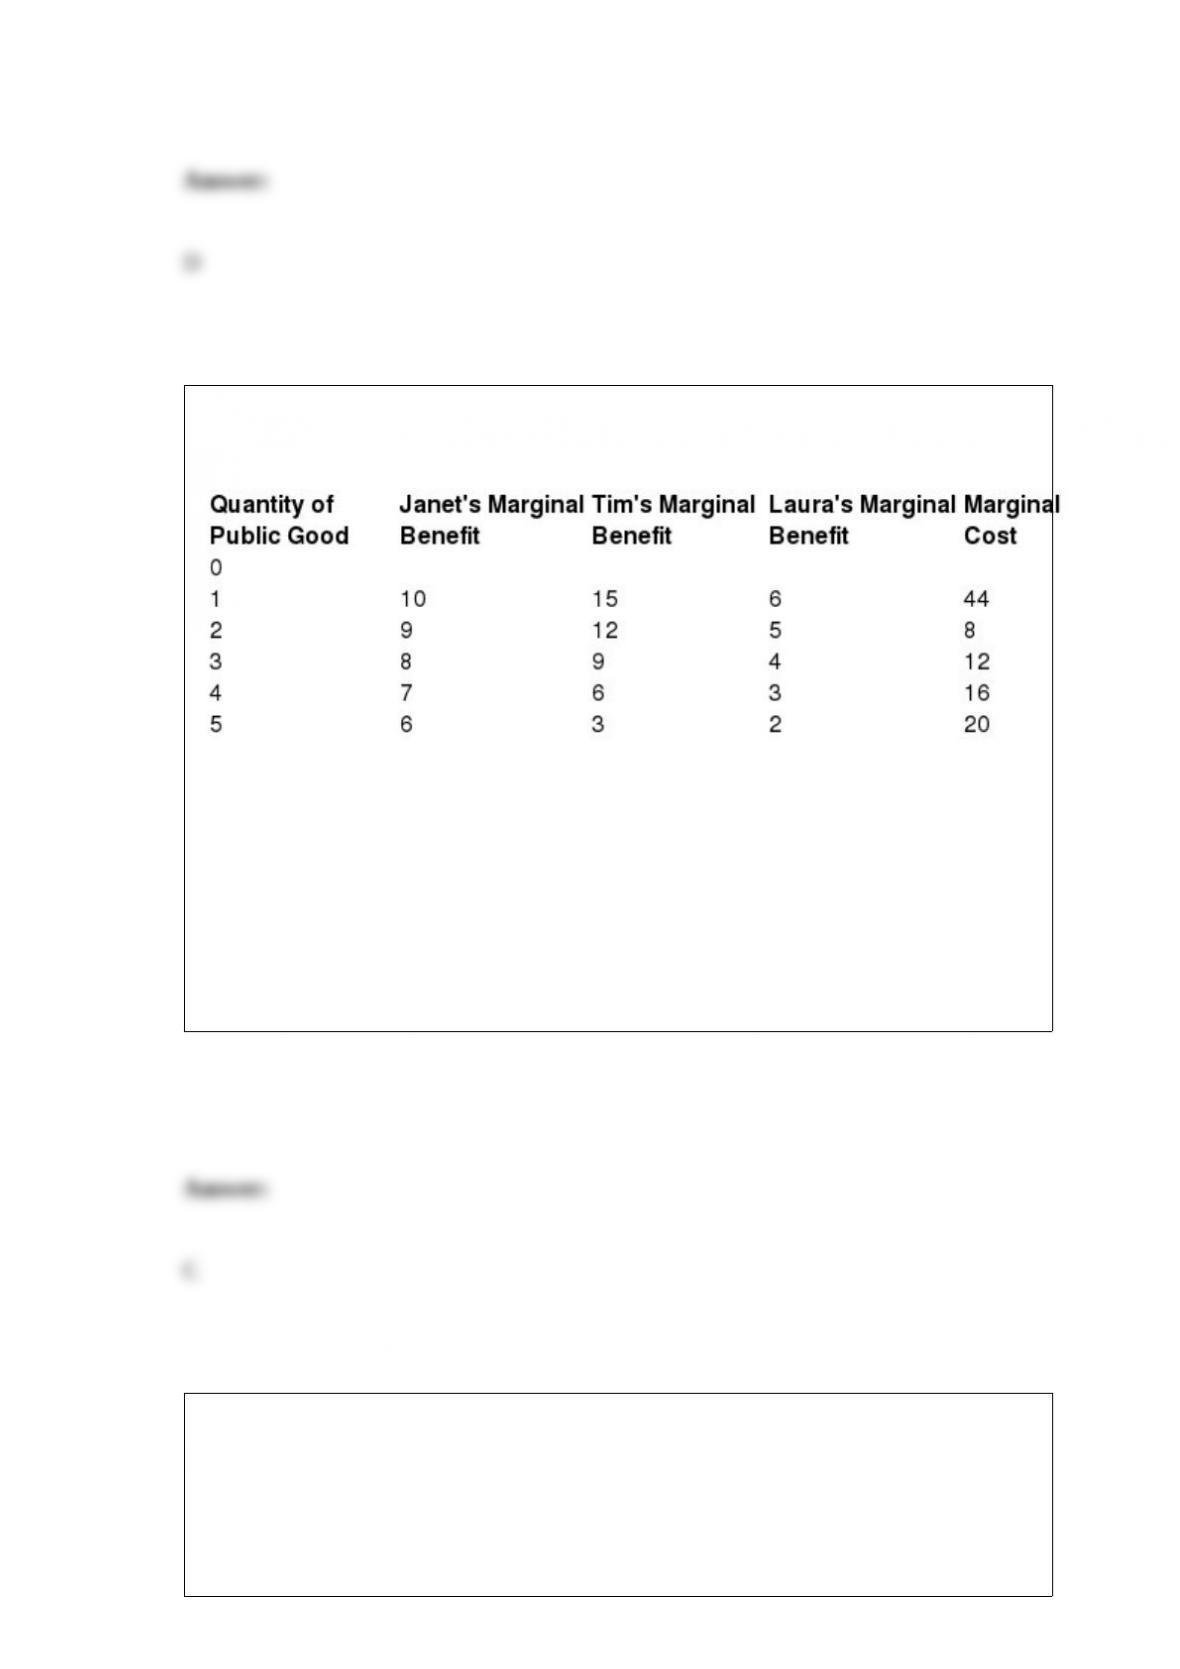
Table 16.3
(Table 16.3) What is the efficient quantity of the public good?
A) 8 units
B) 3 units
C) 4 units
D) 5 units
Which of the following statements is TRUE?
I. The outcomes of experiments are not affected by culture, a major strength of
experiments.
II. Because American and European cultures are similar, experimental findings

conducted in both locations are similar.
III. There are large differences in experimental findings between Western and
non-Western cultures.
A) I only
B) II only
C) III only
D) II and III
Suppose there are four boats available at an auction. The sellers know the quality of
their boats but the prospective buyers don’t. The buyers know that two of the boats are
high-quality and two of the boats are low-quality. Buyers value high-quality boats at
$100,000 and low-quality boats at $60,000. Sellers value high-quality boats at $80,000
and low-quality boats at $40,000. If the auctioneer sets a price per boat at $50,000, how
many boats and of which type will sellers make available?
A) all four boats
B) two high-quality boats
C) two low-quality boats
D) one high-quality and one low-quality boat
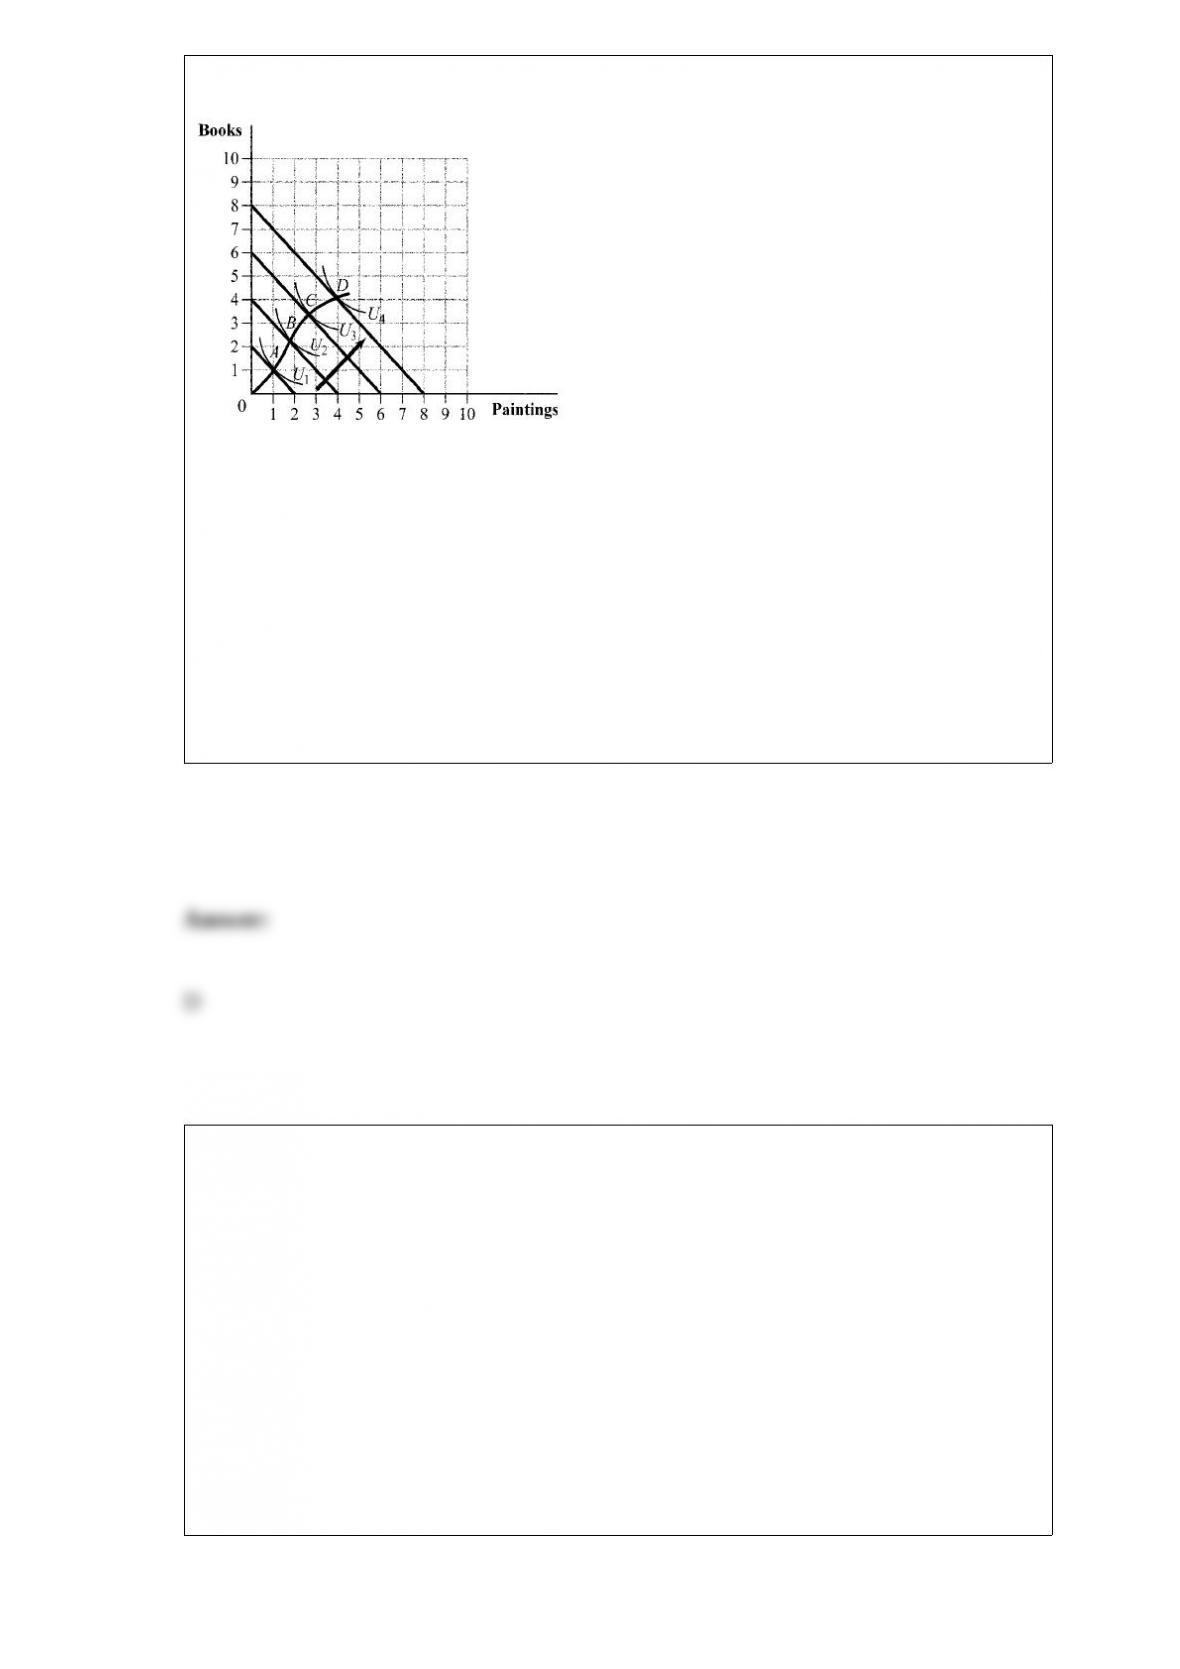
Figure 5.3
(Figure 5.3) In Figure 5.3, the curve that goes through the points A, B, C, and D is
called the:
A) income elasticity curve.
B) optimal consumption path.
C) Engel curve.
D) income expansion path.
Mr. Leghorn lives next door to Mr. Fudd. During hunting season, Mr. Fudd likes to
shoot rabbits in his backyard, which he values at $900. The noise from the shooting
disturbs Mr. Leghorn and prevents him from taking afternoon naps, which he values at
$500. If Mr. Leghorn has the legal right to stop Mr. Fudd from hunting, the socially
optimal outcome is for:
A) Mr. Fudd to stop hunting.
B) Mr. Fudd to pay Mr. Leghorn between $500 and $900 to continue hunting.
C) Mr. Leghorn to pay $500 or less to get Mr. Fudd to stop hunting.
D) Mr. Fudd to pay Mr. Leghorn less than $500 to continue hunting.