
Marginal utility is best computed as the ratio of:
a. total utility to change in quantity consumed.
b. the change in total utility to total quantity consumed.
c. total quantity consumed to total utility.
d. the change in total utility to change in quantity consumed.
The price of a good will fall when:
a. there is a shortage of the good. c. demand for the good increases.
b. there is a surplus of the good. d. the supply of the good decreases.
In Exhibit 11-6, when the marginal revenue product is $20.00, firms should ____
workers.
a. continue hiring
b. stop hiring
c. start firing
d. pay a wage above $15.00 to its workers
If it costs the DuPont Chemical Company more to make the chemical flaxinate in the
United States than it does to make it in Formosa, the Formosans must have:
a. lower demand for flaxinate.
b. tariffs on flaxinate.
c. inefficient markets.
d. a more favorable political environment.
e. an absolute advantage in flaxinate production.
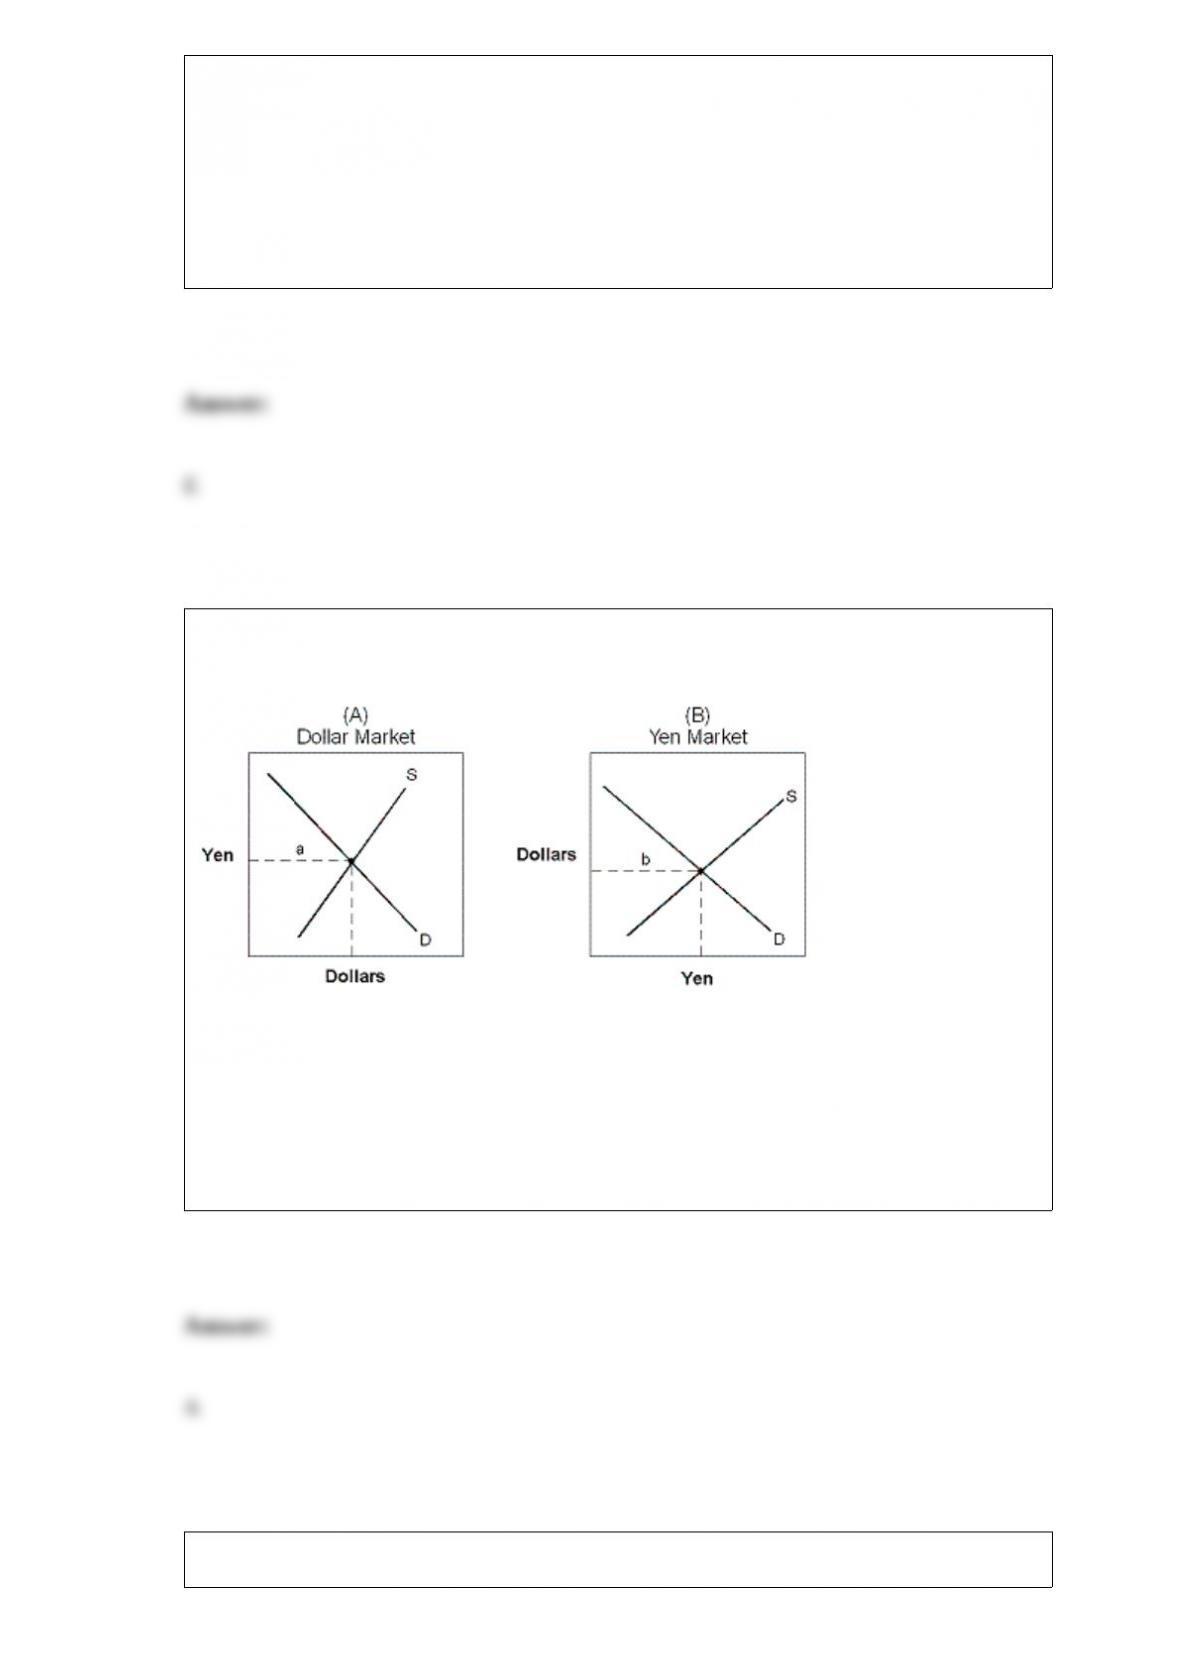
Exhibit 15-5 International currency markets
Exhibit 15-5 displays the international currency market for yen in terms of dollars and
dollars in terms of yen. The supply curve in graph 15-5(A) is determined by:
a. U.S. citizens attempting to purchase Japanese-made goods.
b. Japanese attempting to purchase U.S.-made goods.
c. U.S. businesses attempting to sell to the Japanese.
d. Japanese businesses attempting to sell to the U.S.
e. the U.S. government attempting to unload dollars to the international market.
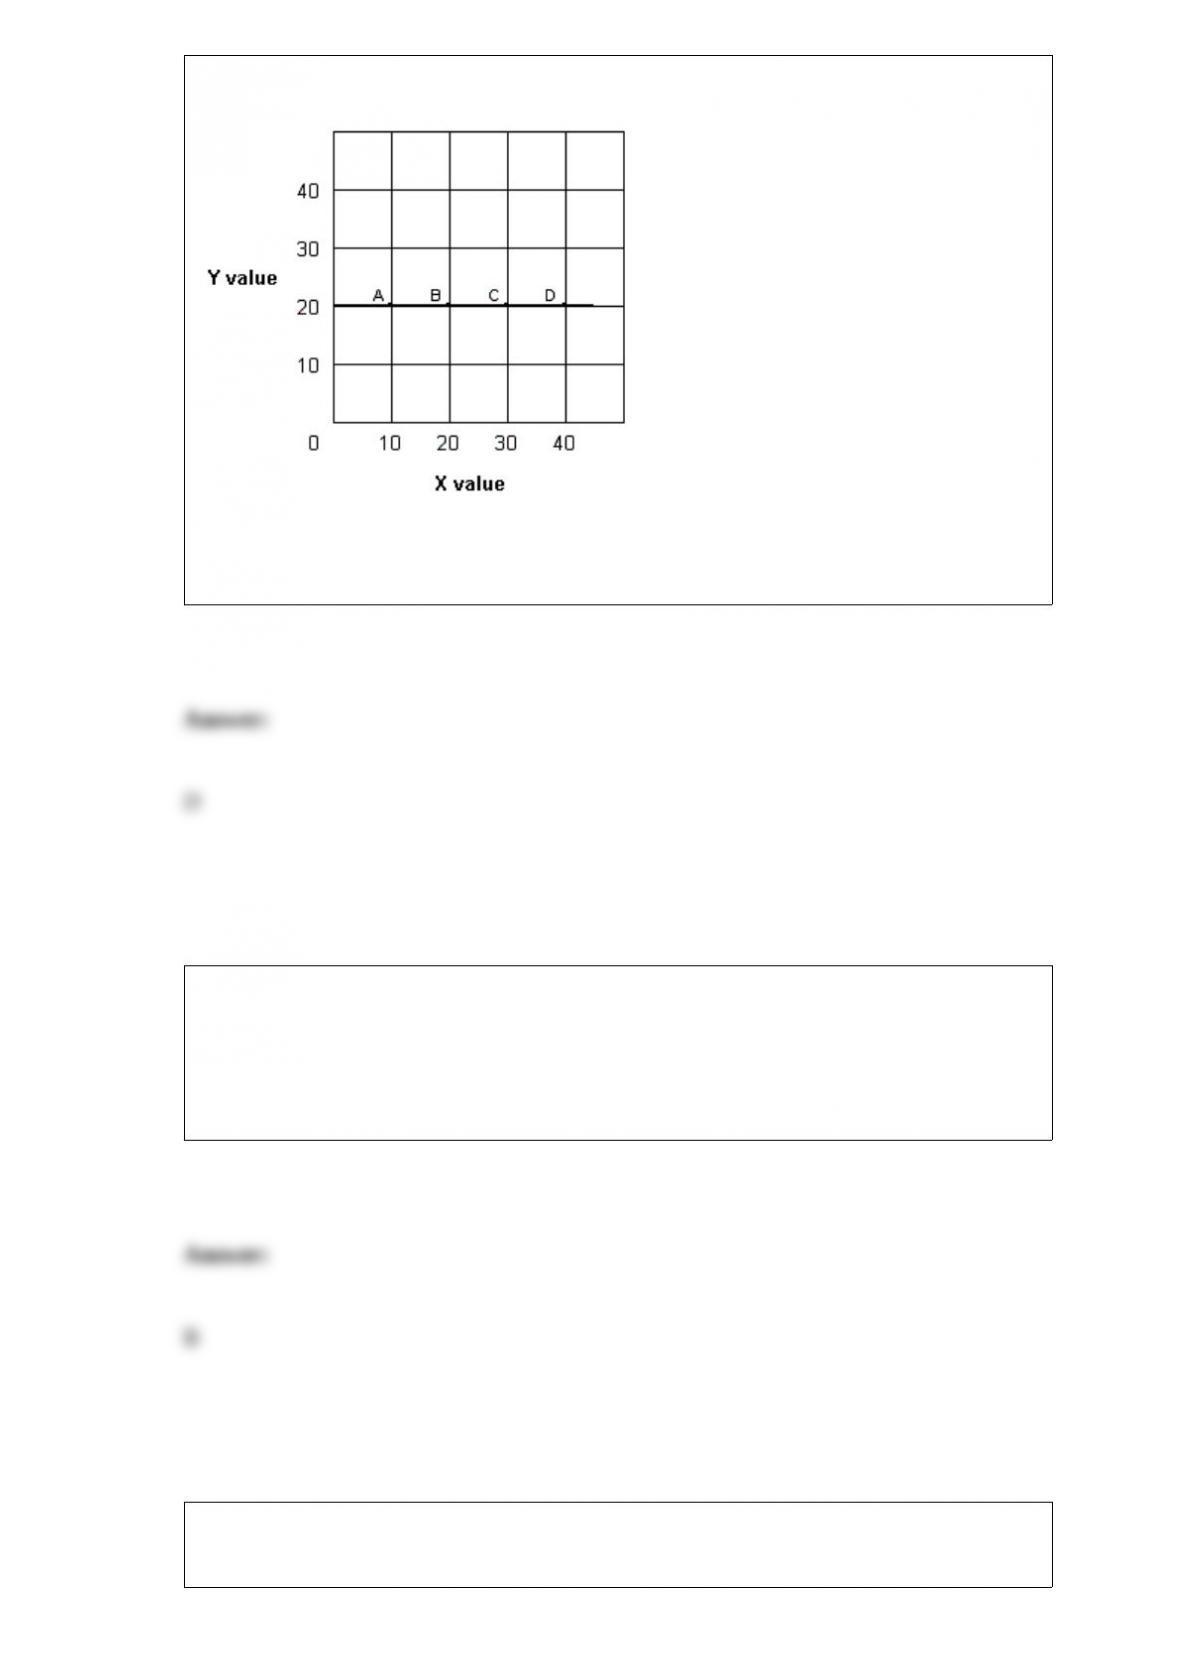
Exhibit 1A-6 Straight line
In Exhibit 1A-6, the slope of straight line A-D is:
a. greater than 1. c. less than 1.
b. equal to 1. d. zero.
When total revenue minus total cost is equal to zero, the firm is:
a. earning above-average economic profit.
b. earning a normal profit.
c. losing too much money to stay in business.
d. earning abnormally low profits.
Exhibit 3A-1 Comparison of Market Efficiency and Deadweight Loss
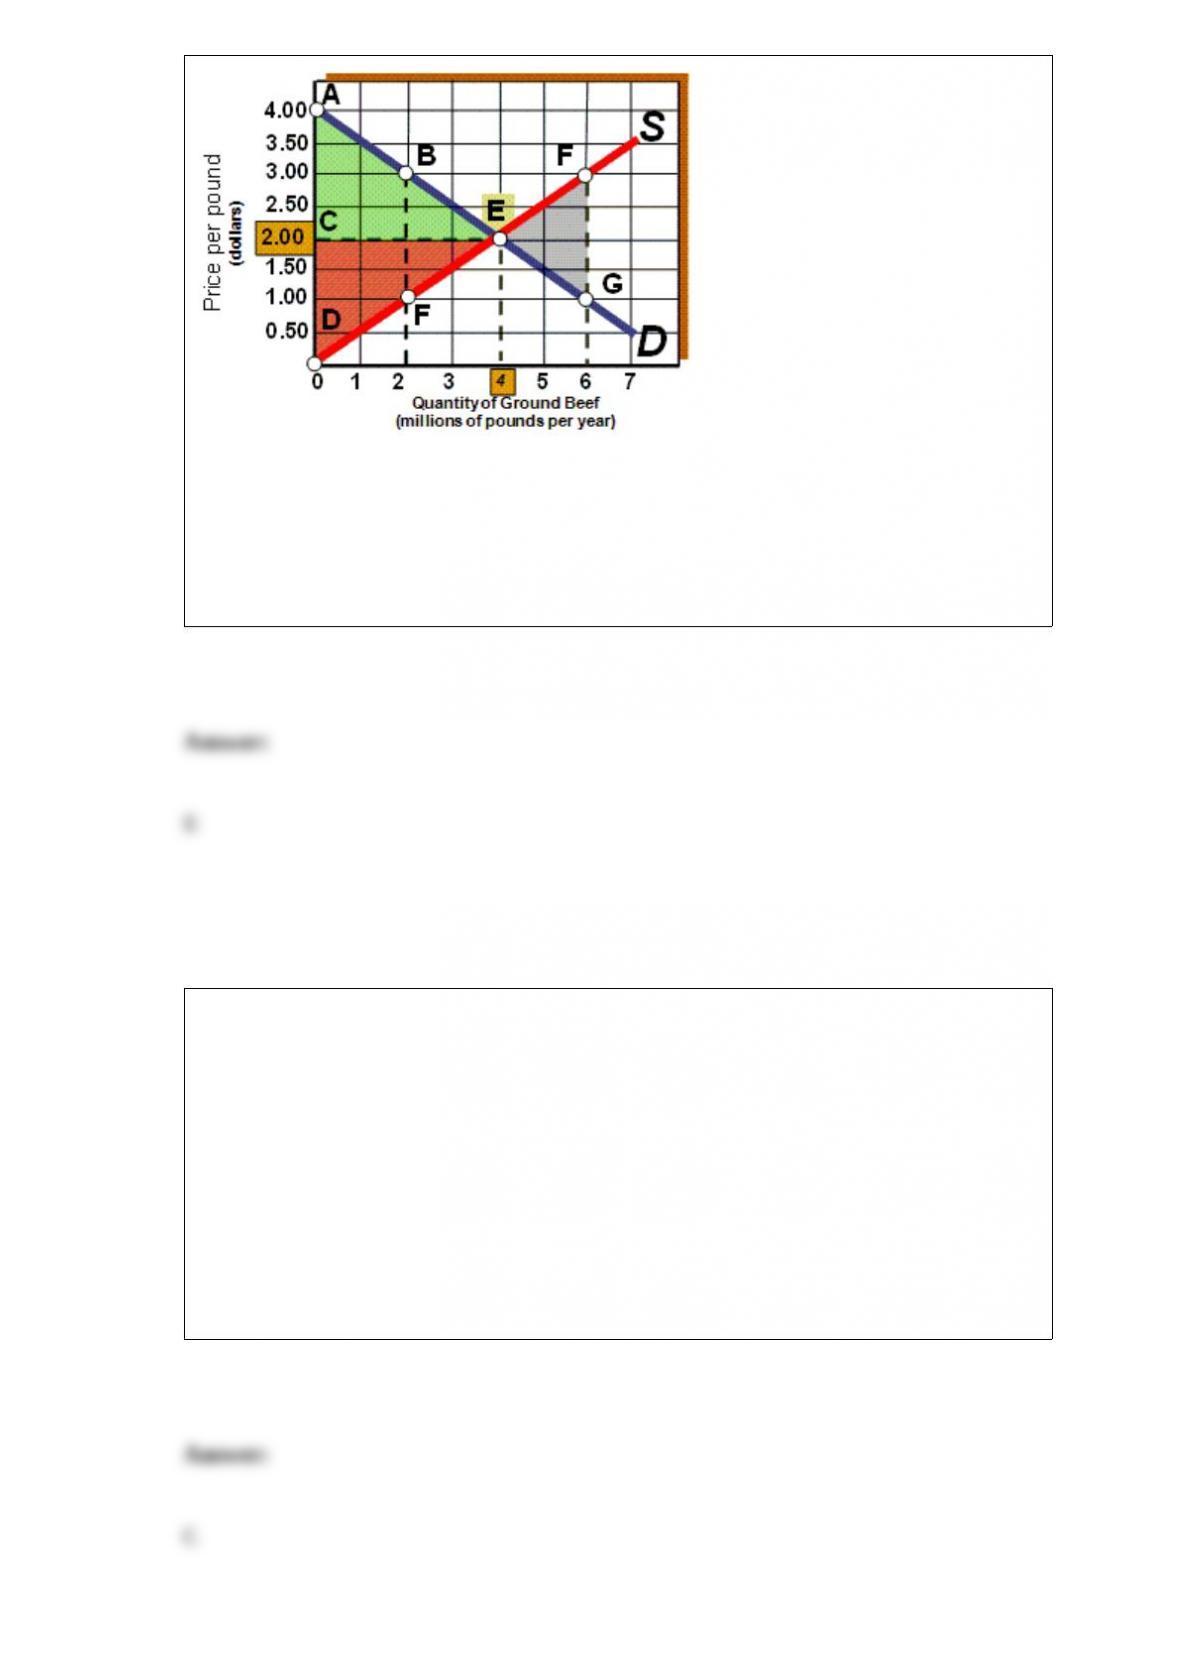
As shown in Exhibit 3A-1, if the market price falls from $2.00 to $1.00, then:
a. consumer surplus increases.
b. producer surplus increases.
c. deadweight loss is eliminated.
d. all of the above are true.
e. none of the above are true.
Third-party beneficiaries are called:
a. polluters.
b. property owners.
c. free riders.
d. efficient market.
e. losers.
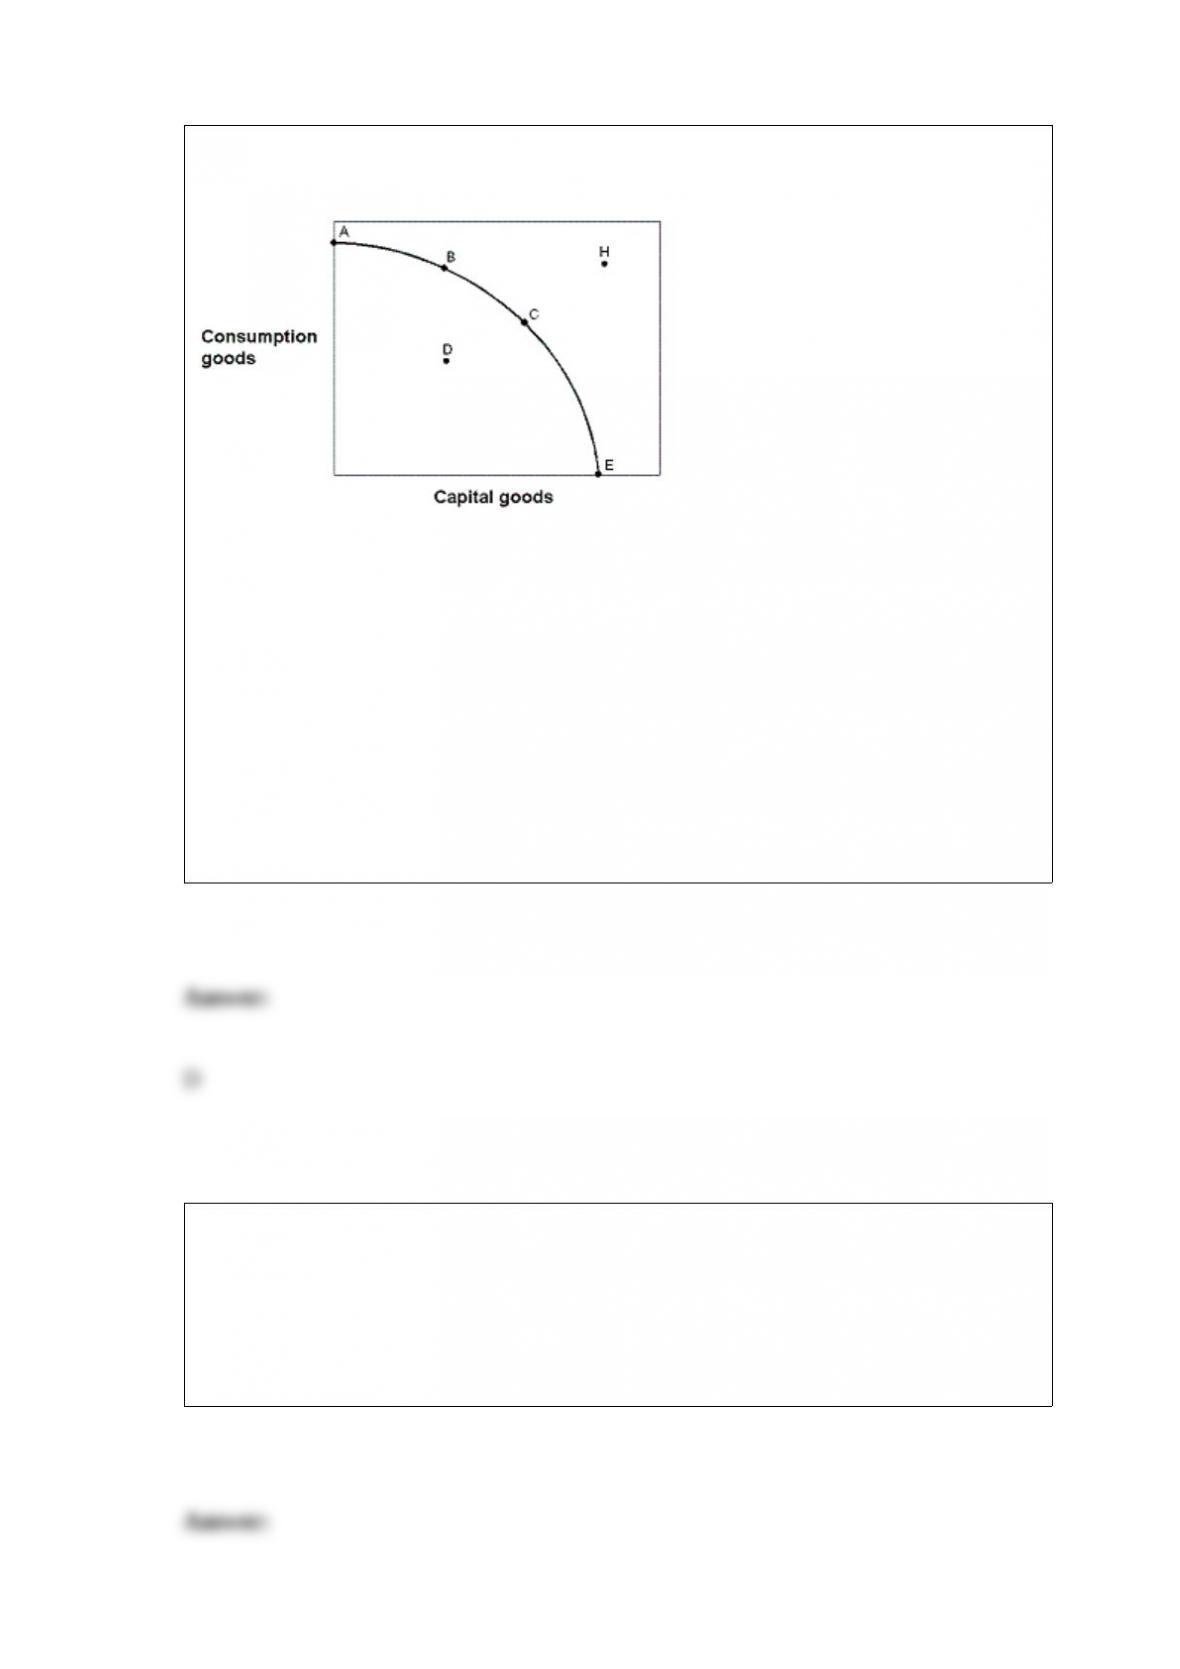
Exhibit 2-13 Production possibilities curve
In Exhibit 2-13, point D:
a. is preferred to point A.
b. is a point of maximum production for this economy this year.
c. is not achievable this year because of limited resources.
d. could result from some degree of unemployment of inefficiency.
e. is preferred to point H.
Protective tariffs help a nation reach which of the following goals?
a. Decreased domestic consumer prices.
b. Increased domestic employment.
c. Increased amount of goods for consumers to purchase.
d. Increased competition among domestic and foreign producers.
e. None of these.

The Lorenz curve measures the:
a. distribution of income.
b. effectiveness of government transfer payments.
c. extent to which family incomes are affected by welfare.
d. all of these.
Which of the following would decrease the supply of airline travel?
a. Reduced number of airline travelers.
b. New airline companies beginning operations.
c. Higher fuel costs.
d. Lower prices for airline tickets.
Assume an indifference curve yields a consumer 1,000 utils of total utility. If the
consumer’s budget increases by 50 percent, then the indifference curve:
a. shifts rightward.
b. shifts leftward.
c. becomes more linear.
d. is unchanged.
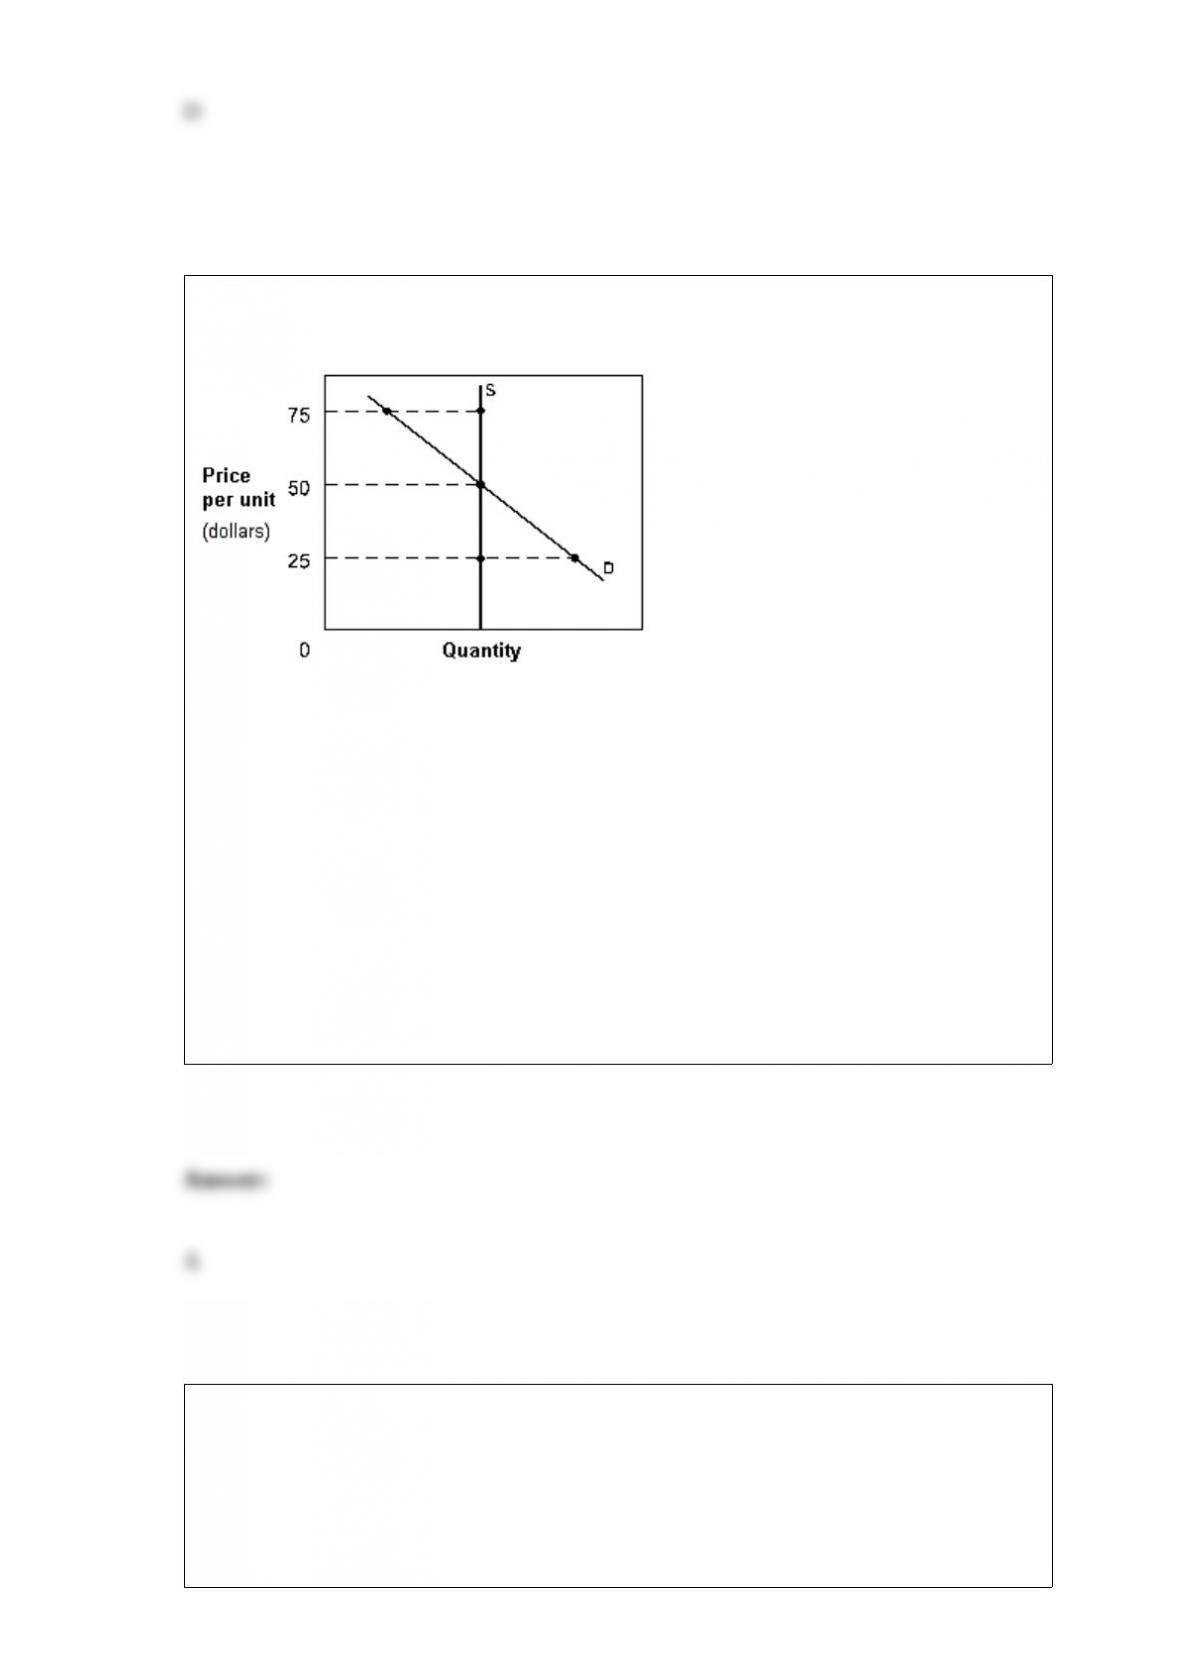
Exhibit 3-7 Demand and supply curves
In Exhibit 3-7, if price happened to currently be $25 in this market, a ____ would result,
causing a(n) ____ in price.
a. shortage; increase
b. shortage; decrease
c. surplus; increase
d. surplus; decrease
e. scarcity; stabilization
Which would be least likely to cause the production possibilities curve to shift to the
right?
a. An increase in the labor force.
b. Improved methods of production.
c. An increase in the education and training of the labor force.
d. A decrease in unemployment.
A firm is currently operating where the MC of the last unit produced = $84, and the MR
of this unit = $70. What would you advise this firm to do?
a. Shut down.
b. Increase output.
c. Stay at its current output.
d. Decrease output.
e. Decrease price.
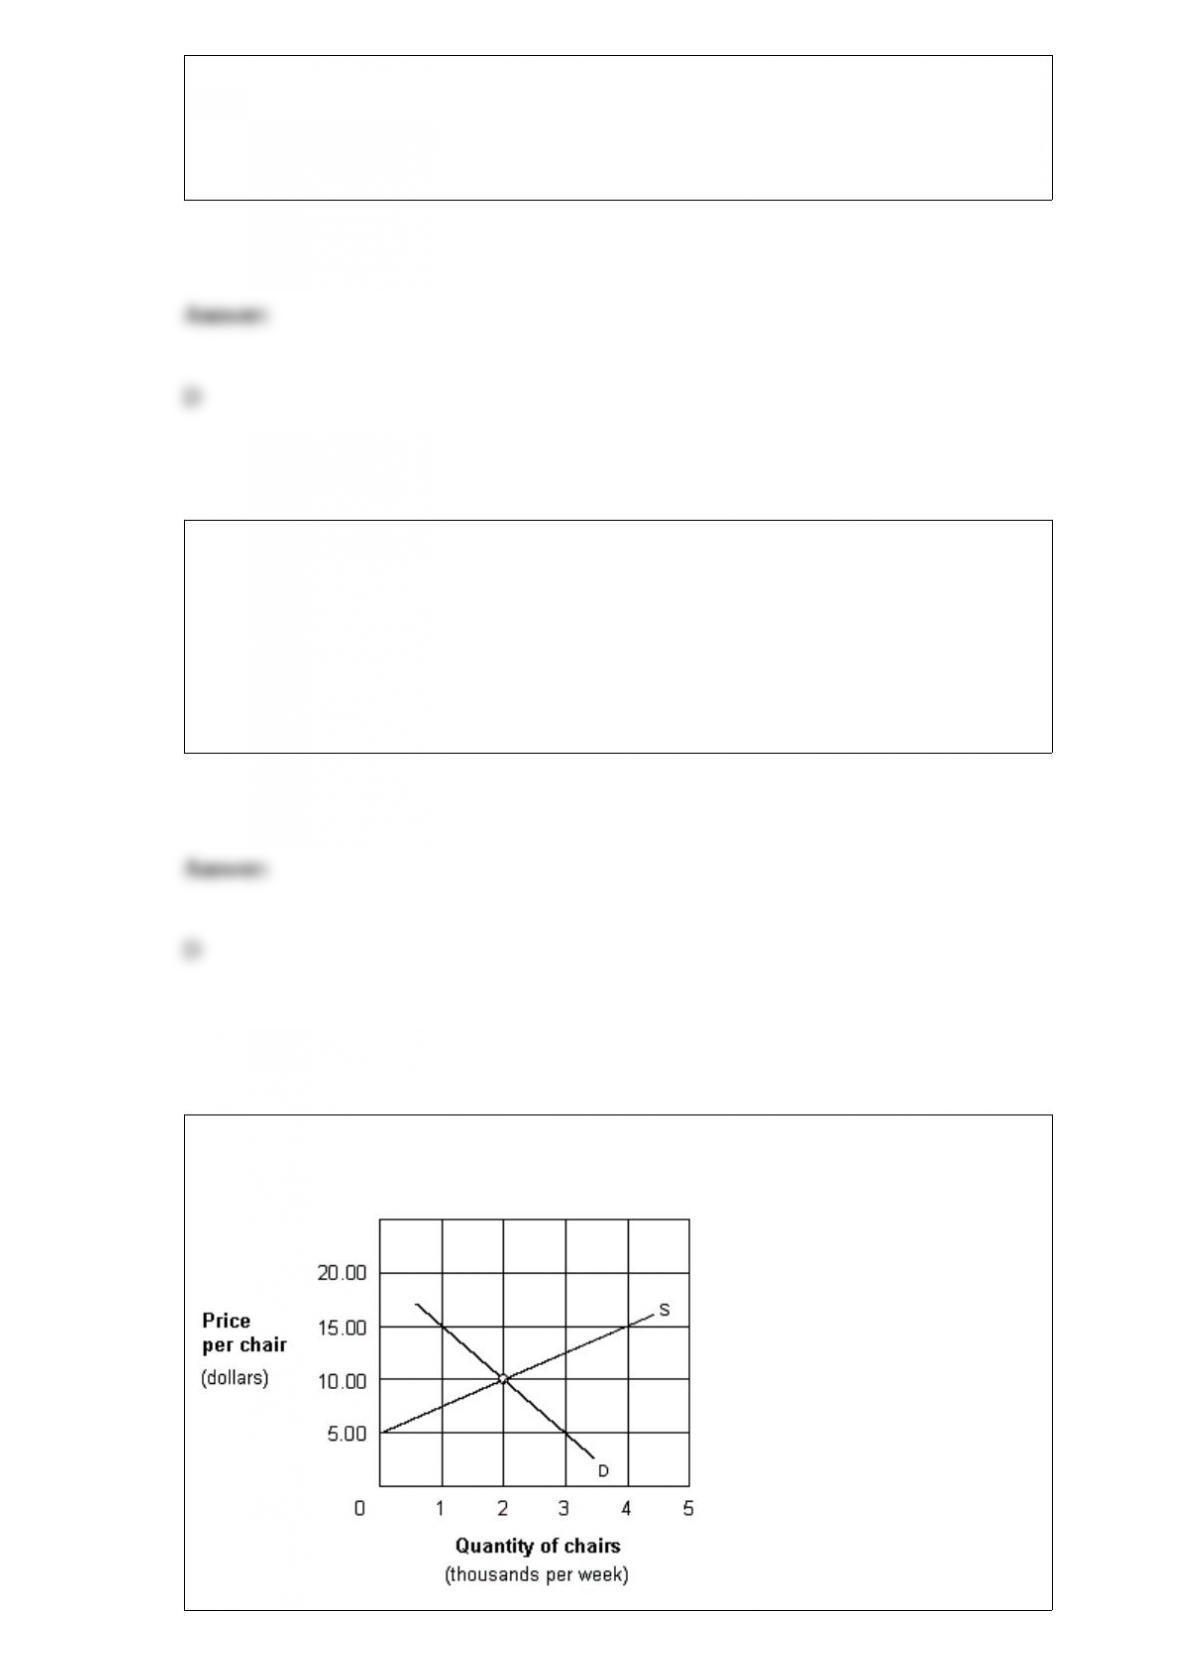
Exhibit 3-16 Supply and demand curves for chairs

In Exhibit 3-16, assume that the market price of chairs is $15 each. This price is:
a. an equilibrium price.
b. not an equilibrium price, since there is an excess demand at a price of $10.
c. an equilibrium price, since suppliers can store inventories in their warehouses.
d. not an equilibrium price, since the rate at which chairs are being supplied is greater
than the rate at which they are being demanded.