1) Since World War II, GATT has been responsible for reducing the average tariff
among member countries from about
a.40 percent to about 5 percent.
b.40 percent to about 20 percent.
c.80 percent to about 20 percent.
d.20 percent to about 10 percent.
2) Two CEOs from different firms in the same market collude to fix the price in the
market. This action violates the
a.Clayton Act of 1914.
b.Sherman Antitrust Act of 1890.
c.Crandall-Putnam ruling of 1983.
d.Jackson-Microsoft ruling of 2000.
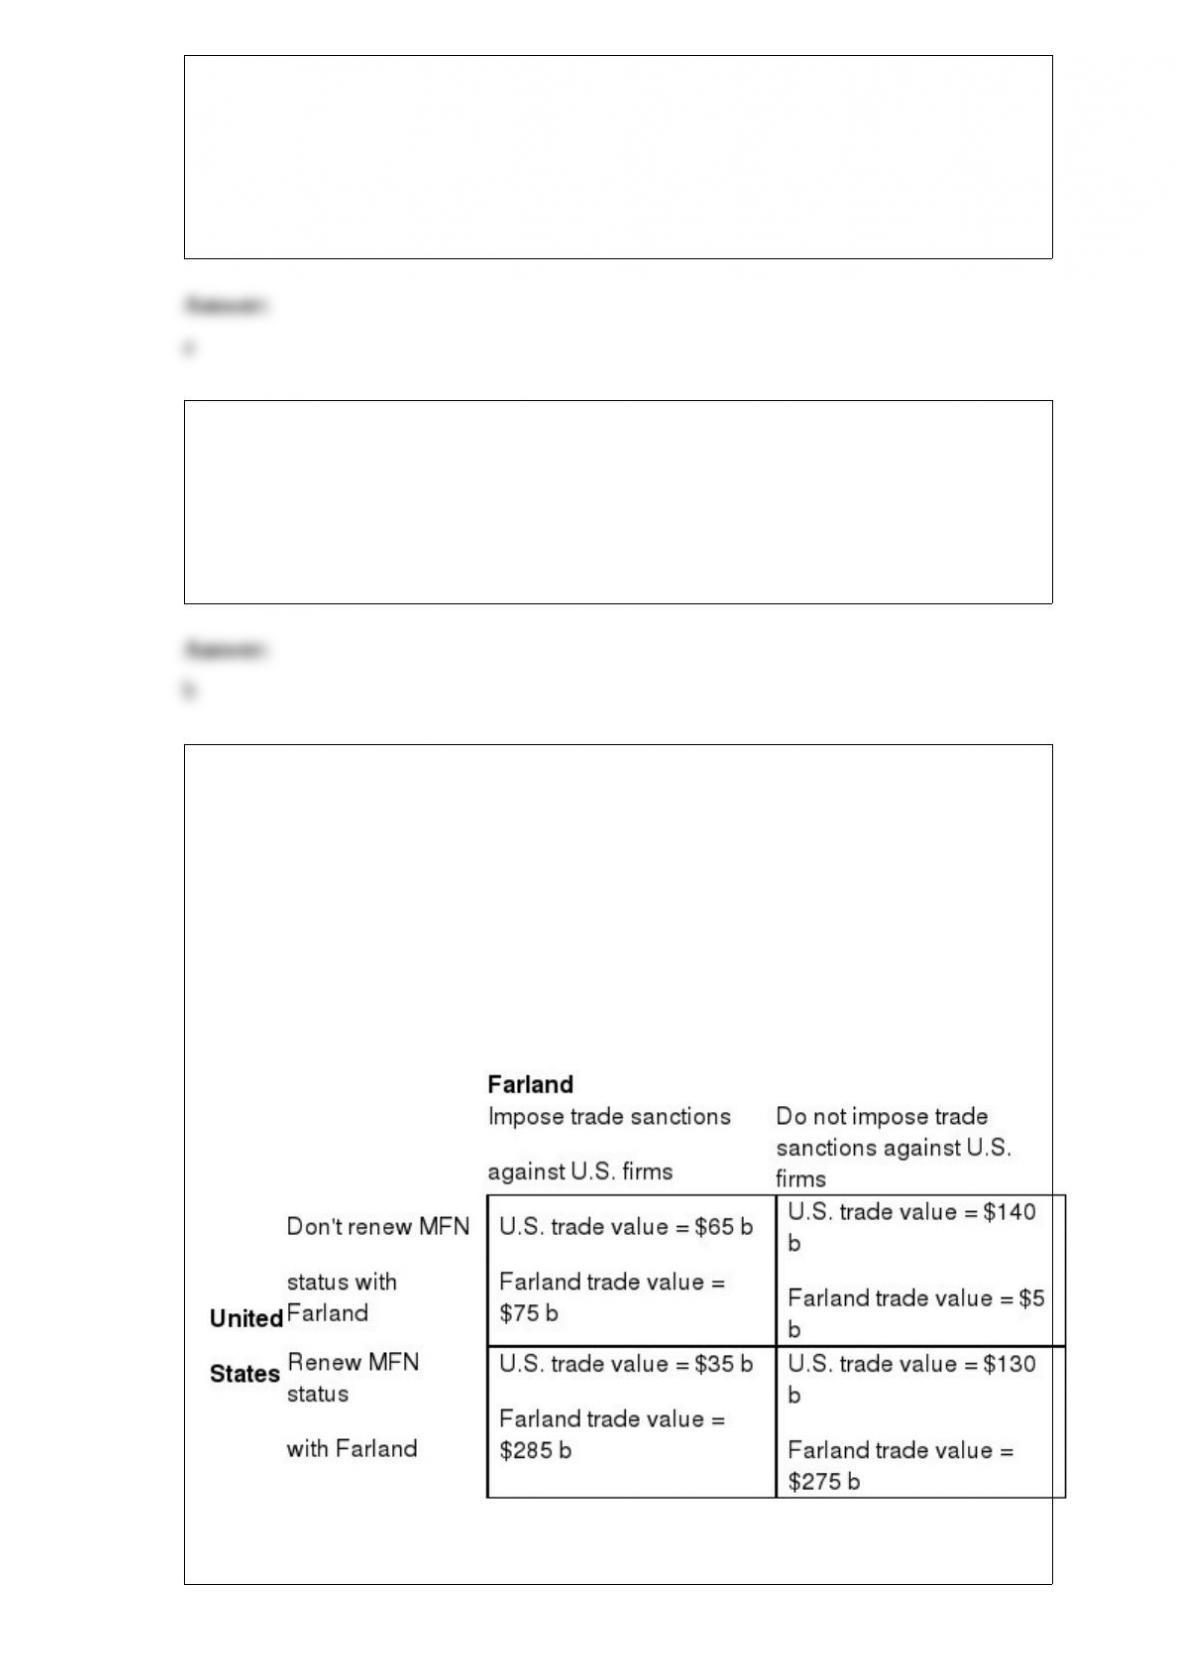
3) Table 17-27
Each year the United States considers renewal of Most Favored Nation (MFN) trading
status with Farland (a mythical nation). Historically, legislators have made threats of
not renewing MFN status because of human rights abuses in Farland. The non-renewal
of MFN trading status is likely to involve some retaliatory measures by Farland. The
payoff table below shows the potential economic gains associated with a game in which
Farland may impose trade sanctions against U.S. firms and the United States may not
renew MFN status with Farland. The table contains the dollar value of all trade-flow
benefits to the United States and Farland.
Refer to Table 17-27. Assume that trade negotiators meet to discuss trade policy
between the United States and Farland. If neither party to the negotiation is able to trust
the other party, then
a.each should assume that the other will choose a strategy that optimizes total value of
the trade relationship.
b.the Nash equilibrium will provide the largest possible gains to each party.
c.Farland negotiators should assume that United States negotiators will implement a
policy that is in the mutual best interest of both countries.
d.each should follow its dominant strategy.
4) A monopoly firm is a price
a.taker and has no supply curve.
b.maker and has no supply curve
c.taker and has an upward-sloping supply curve.
d.maker and has an upward-sloping supply curve.
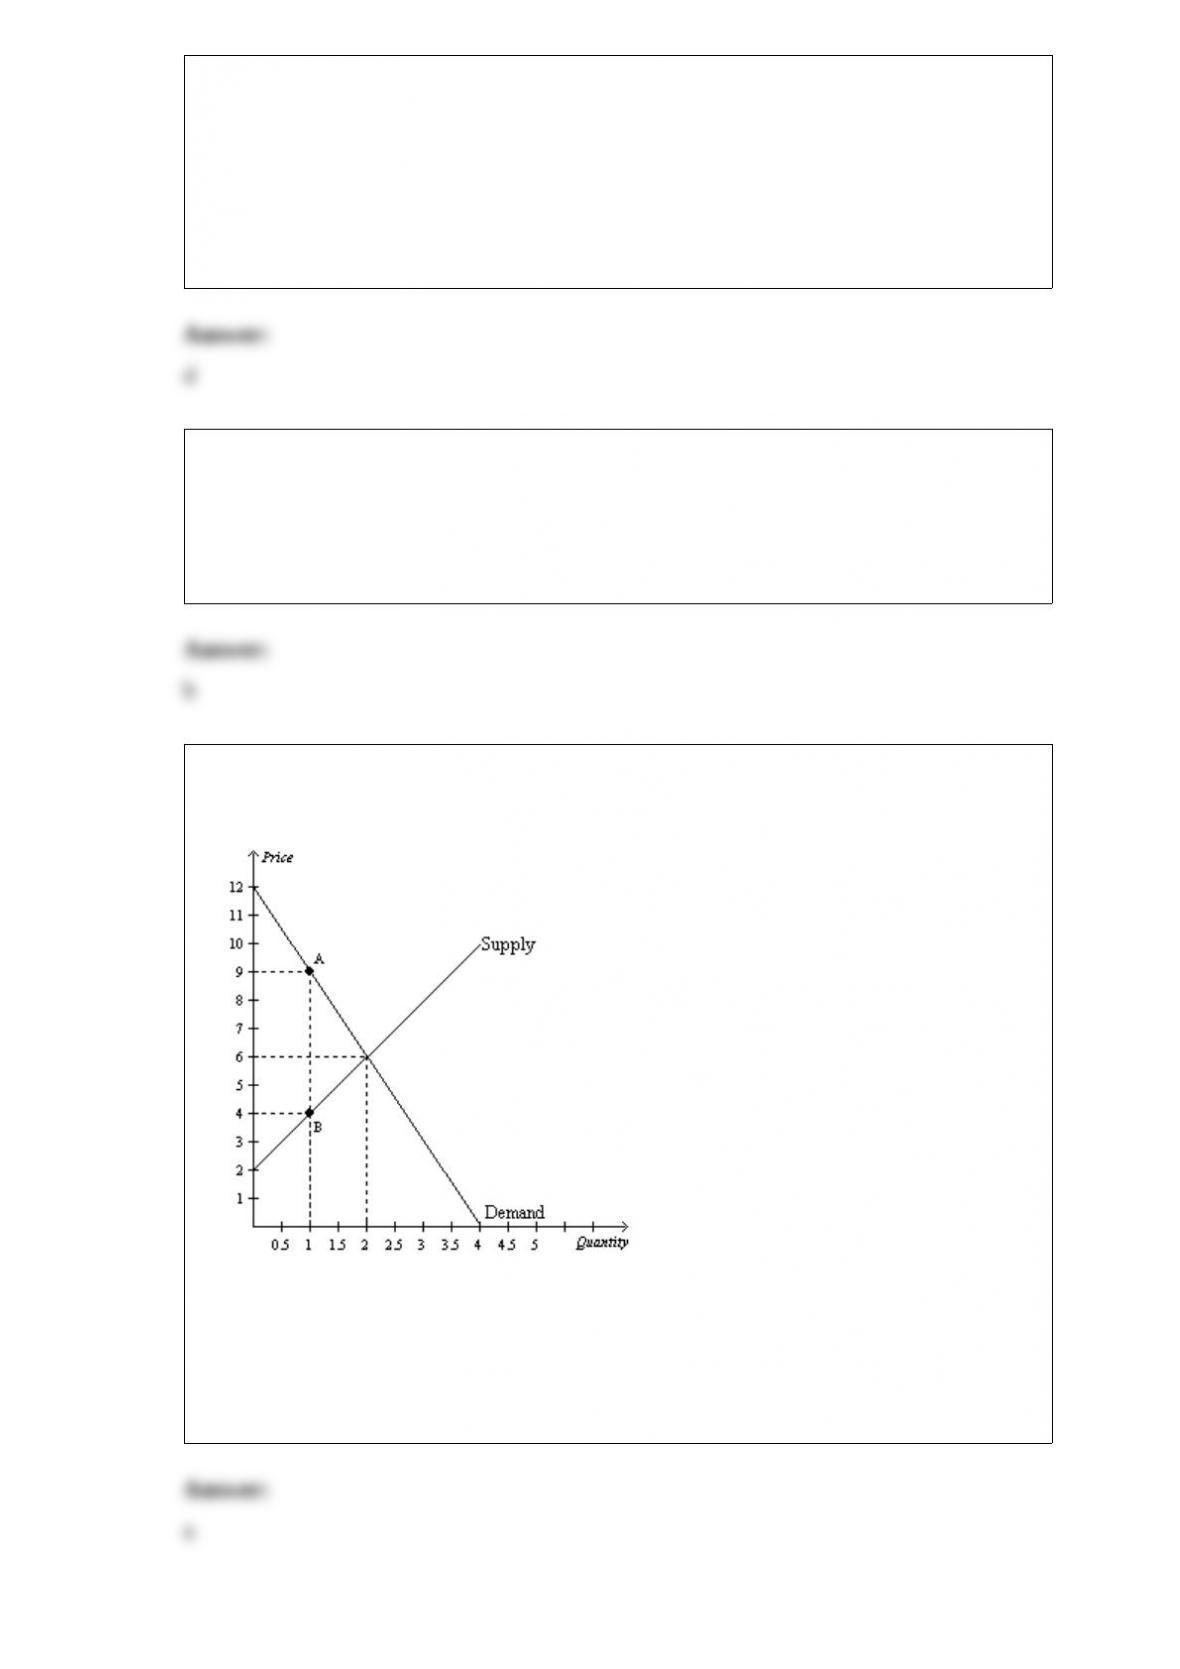
5) Figure 8-2
The vertical distance between points A and B represents a tax in the market.
Producer surplus without the tax is
a.$4, and producer surplus with the tax is $1.
b.$4, and producer surplus with the tax is $3.
c.$10, and producer surplus with the tax is $1.
d.$10, and producer surplus with the tax is $3.
6) If wages for accountants rose, then accountants’ leisure time would have a lower
opportunity cost.
a.True
b.False
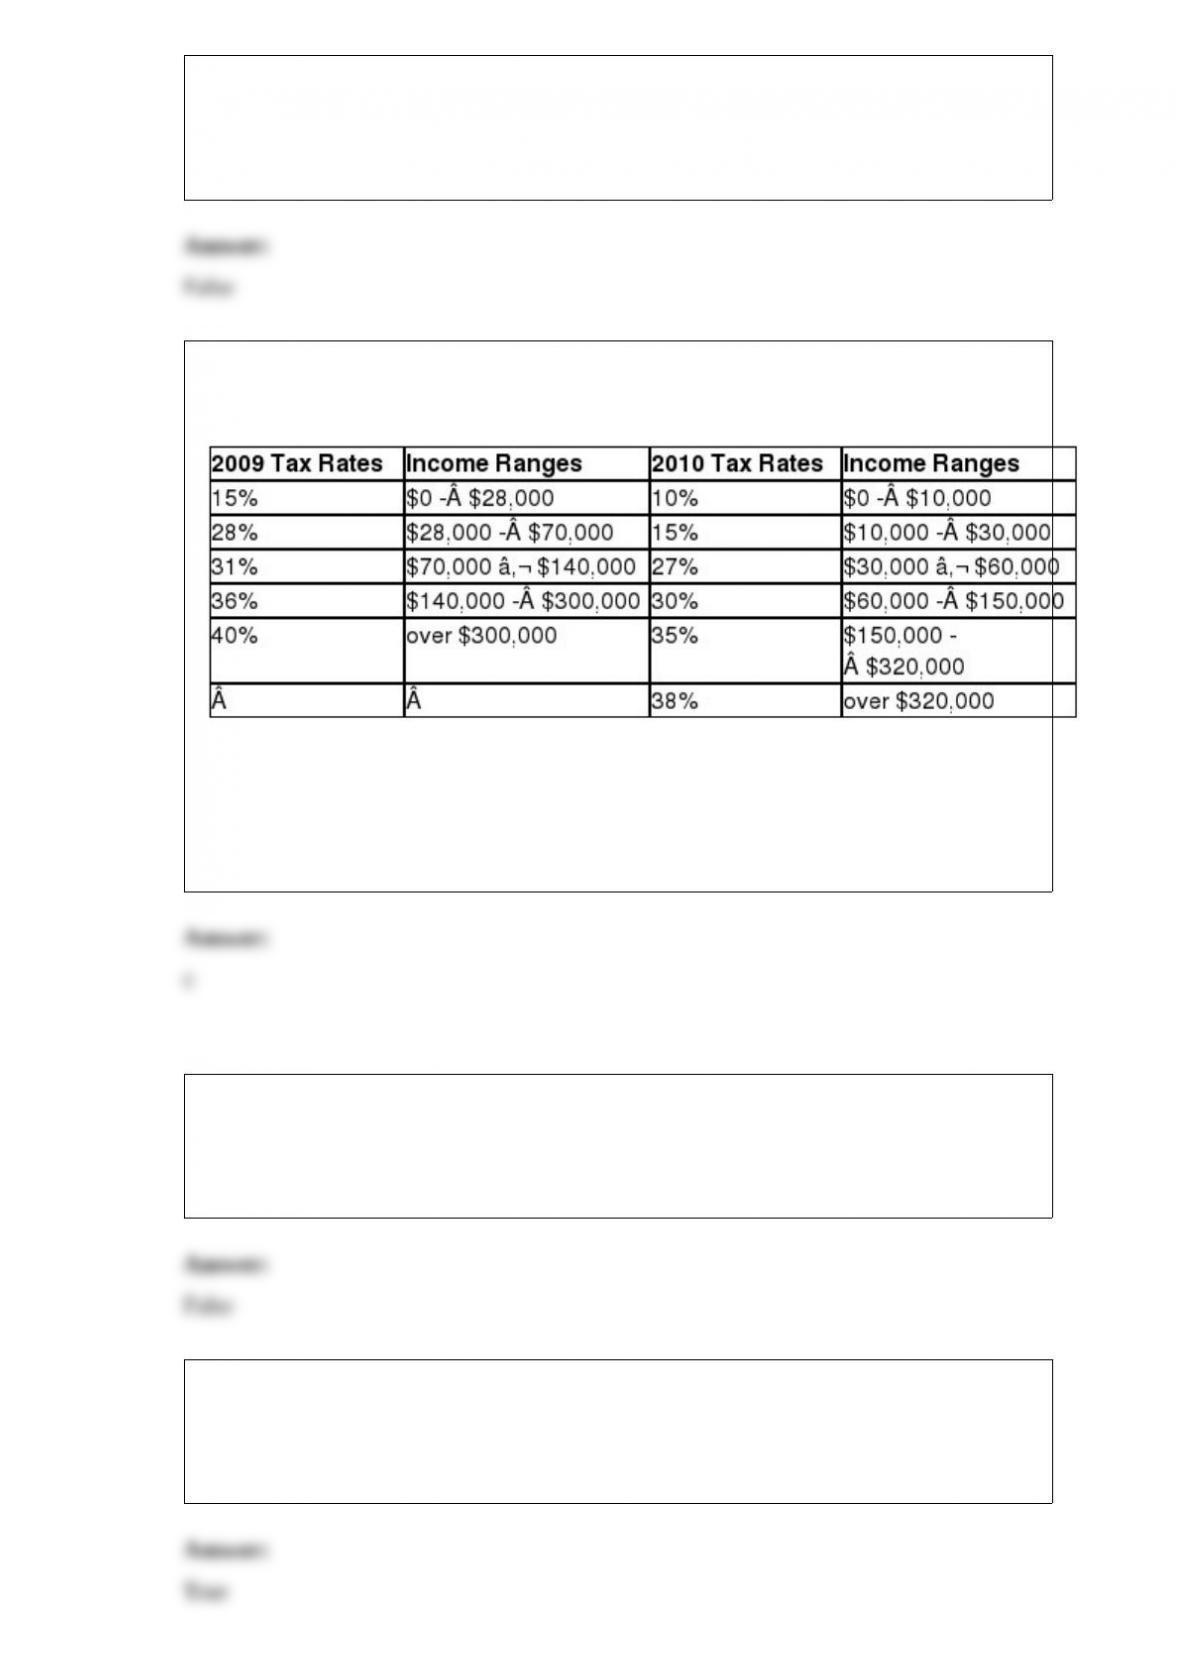
7) Table 12-18
United States Income Tax Rates for a Single Individual, 2009 and 2010.
What type of tax structure did the United States have in 2009 for single individuals?
a.a proportional tax structure
b.a regressive tax structure
c.a progressive tax structure
d.a lump-sum tax structure
8) Since economists cannot use natural experiments offered by history, they must use
carefully constructed laboratory experiments instead.
a.True
b.False
9) The law of supply states that, other things equal, when the price of a good falls, the
quantity supplied falls as well.
a.True
b.False
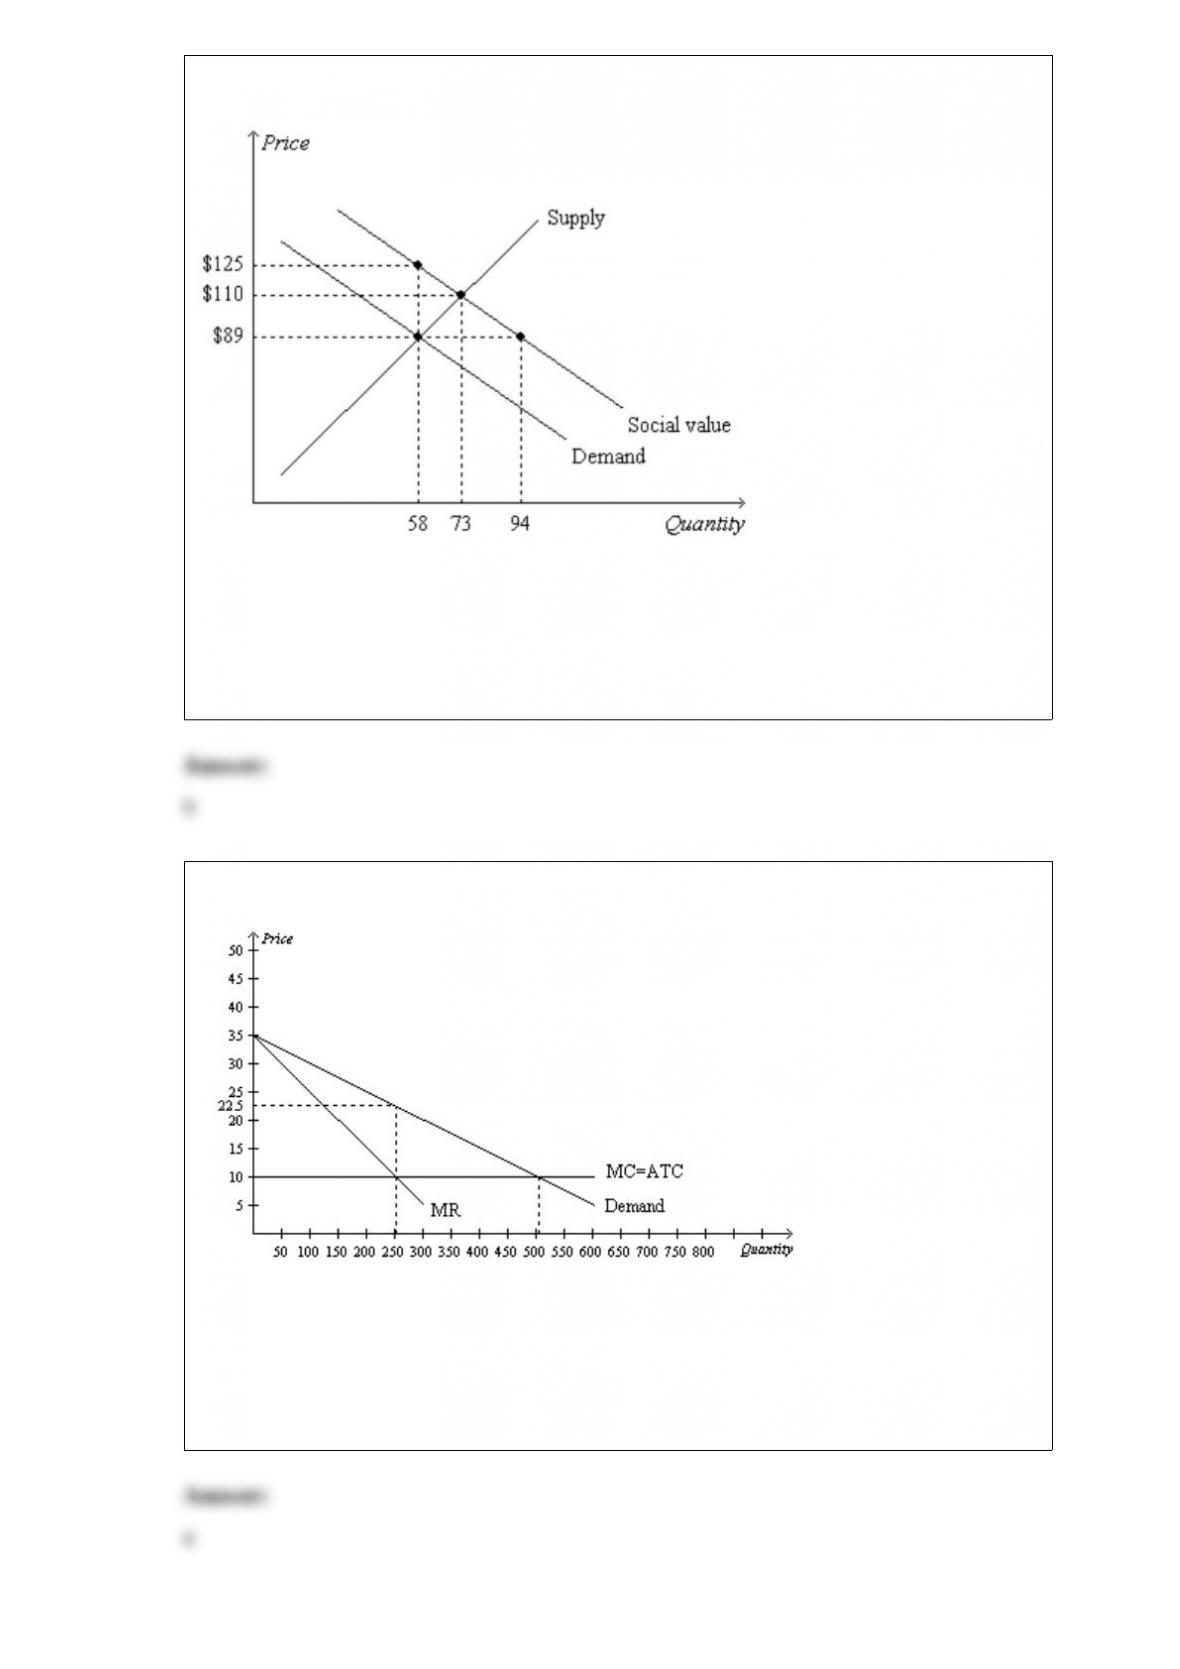
10) Figure 10-19
The socially optimal quantity of output is
a.58 units.
b.73 units.
c.between 73 and 94 units.
d.94 units.
11) Figure 15-19
If the monopoly firm perfectly price discriminates, then consumer surplus amounts to
a. $0.
b. $1,562.50.
c. $3,125.
d. $6,250.
12) One reason for the projected increase, over the next several decades, in government
spending as a percentage of GDP is the projected increase in the size of the elderly
population.
a.True
b.False
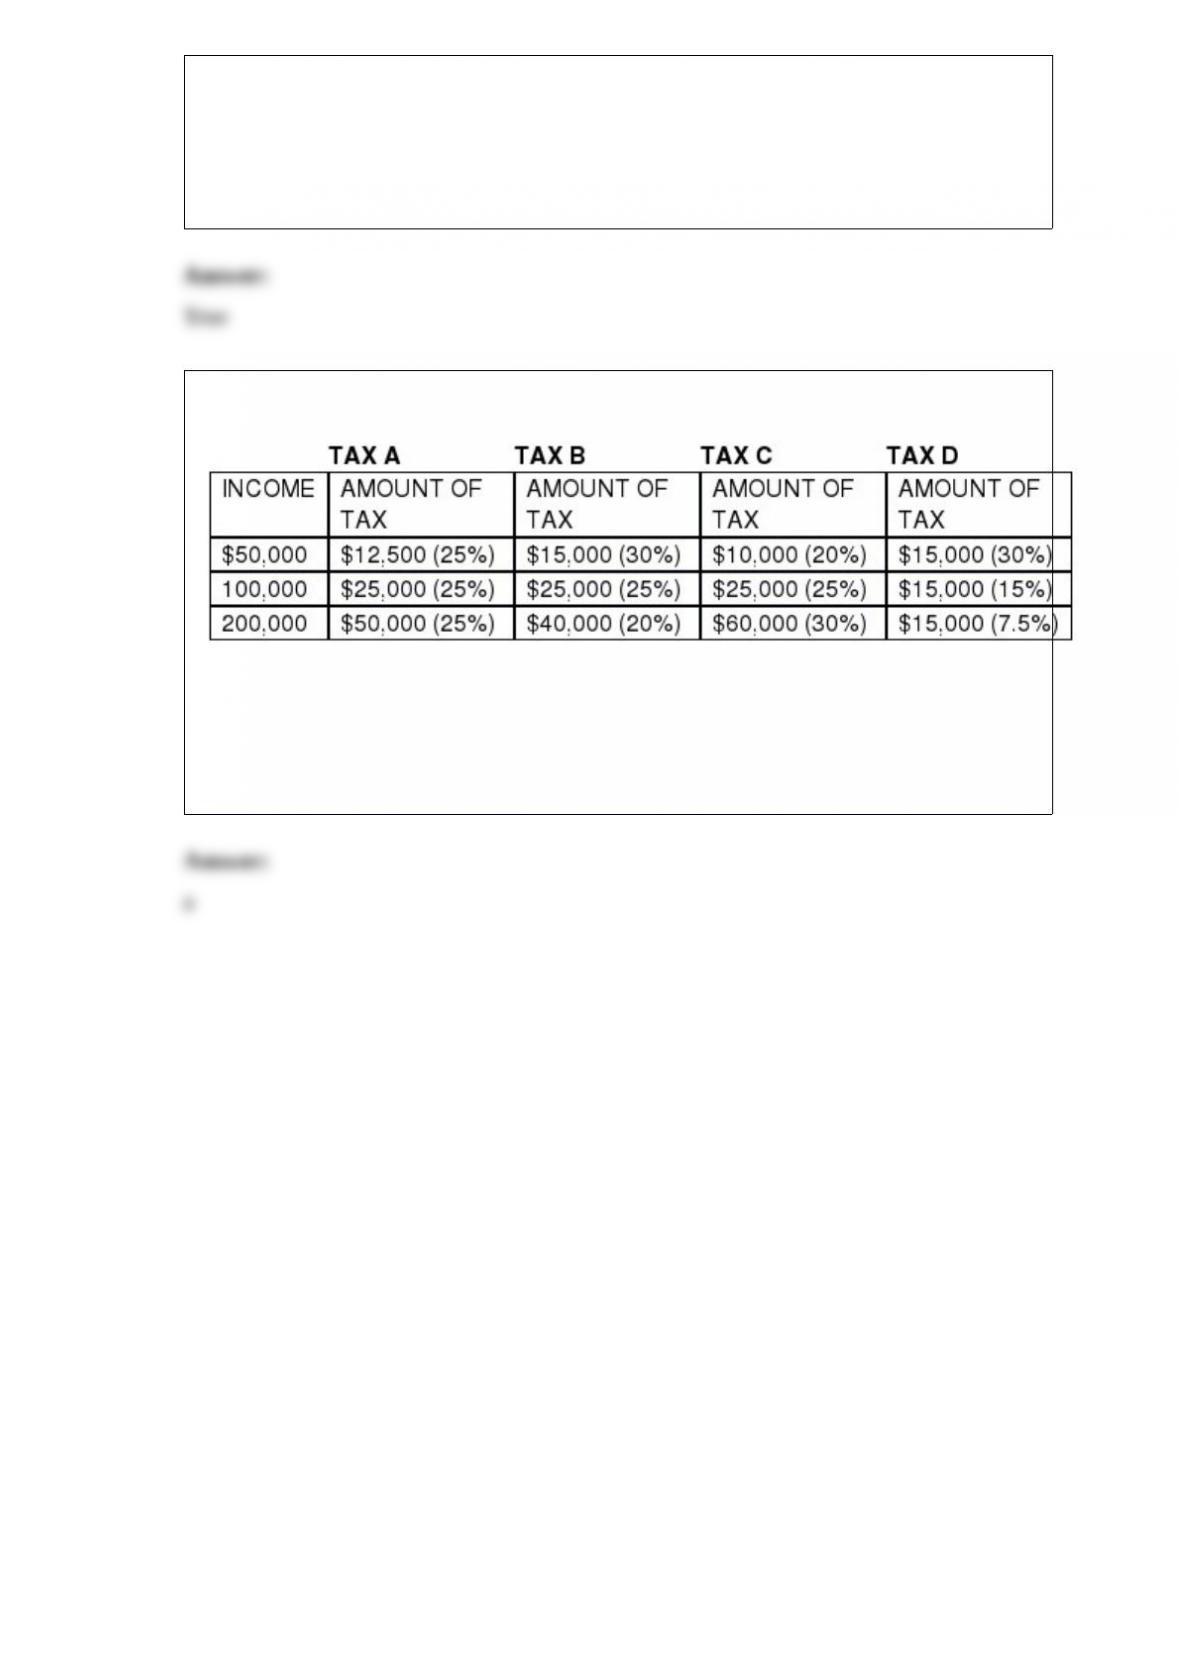
13) Table 12-22
A proportional tax is illustrated by tax
a.A.
b.B.
c.C.
d.D.