
Table 41
PriceQuantity Demanded
by MichelleQuantity Demanded
by LauraQuantity Demanded
by Hillary
$55411
$46613
$37815
$281017
$191219
$0101421
Refer to Table 41. If the market consists of Laura and Hillary only and the price falls
by $1, the quantity demanded in the market increases by
a. 2 units.
b. 3 units.
c. 4 units.
d. 5 units.
Table 34
Assume that Andrea and Paul can switch between producing wheat and producing beef
at a constant rate.
Minutes Needed to Make 1
Bushel of WheatPound of Beef
Andrea3015
Paul155
Refer to Table 34. Which of the following combinations of wheat and beef could Paul
not produce in one 8hour day?
a. 13 bushels of wheat and 60 pounds of beef
b. 20 bushels of wheat and 30 pounds of beef
c. 20 bushels of wheat and 20 pounds of beef
d. 25 bushels of wheat and 15 pounds of beef
A result of welfare economics is that the equilibrium price of a product is considered to
be the best price because it
a. maximizes both the total revenue for firms and the quantity supplied of the product.
b. maximizes the combined welfare of buyers and sellers.
c. minimizes costs and maximizes output.
d. minimizes the level of welfare payments.
An economic outcome is said to be efficient if the economy is
a. using all of the scarce resources it has available.
b. conserving on resources, rather than using all available resources.
c. getting all it can get from the scarce resources it has available.
d. able to produce more than what is currently being produced without additional
resources.
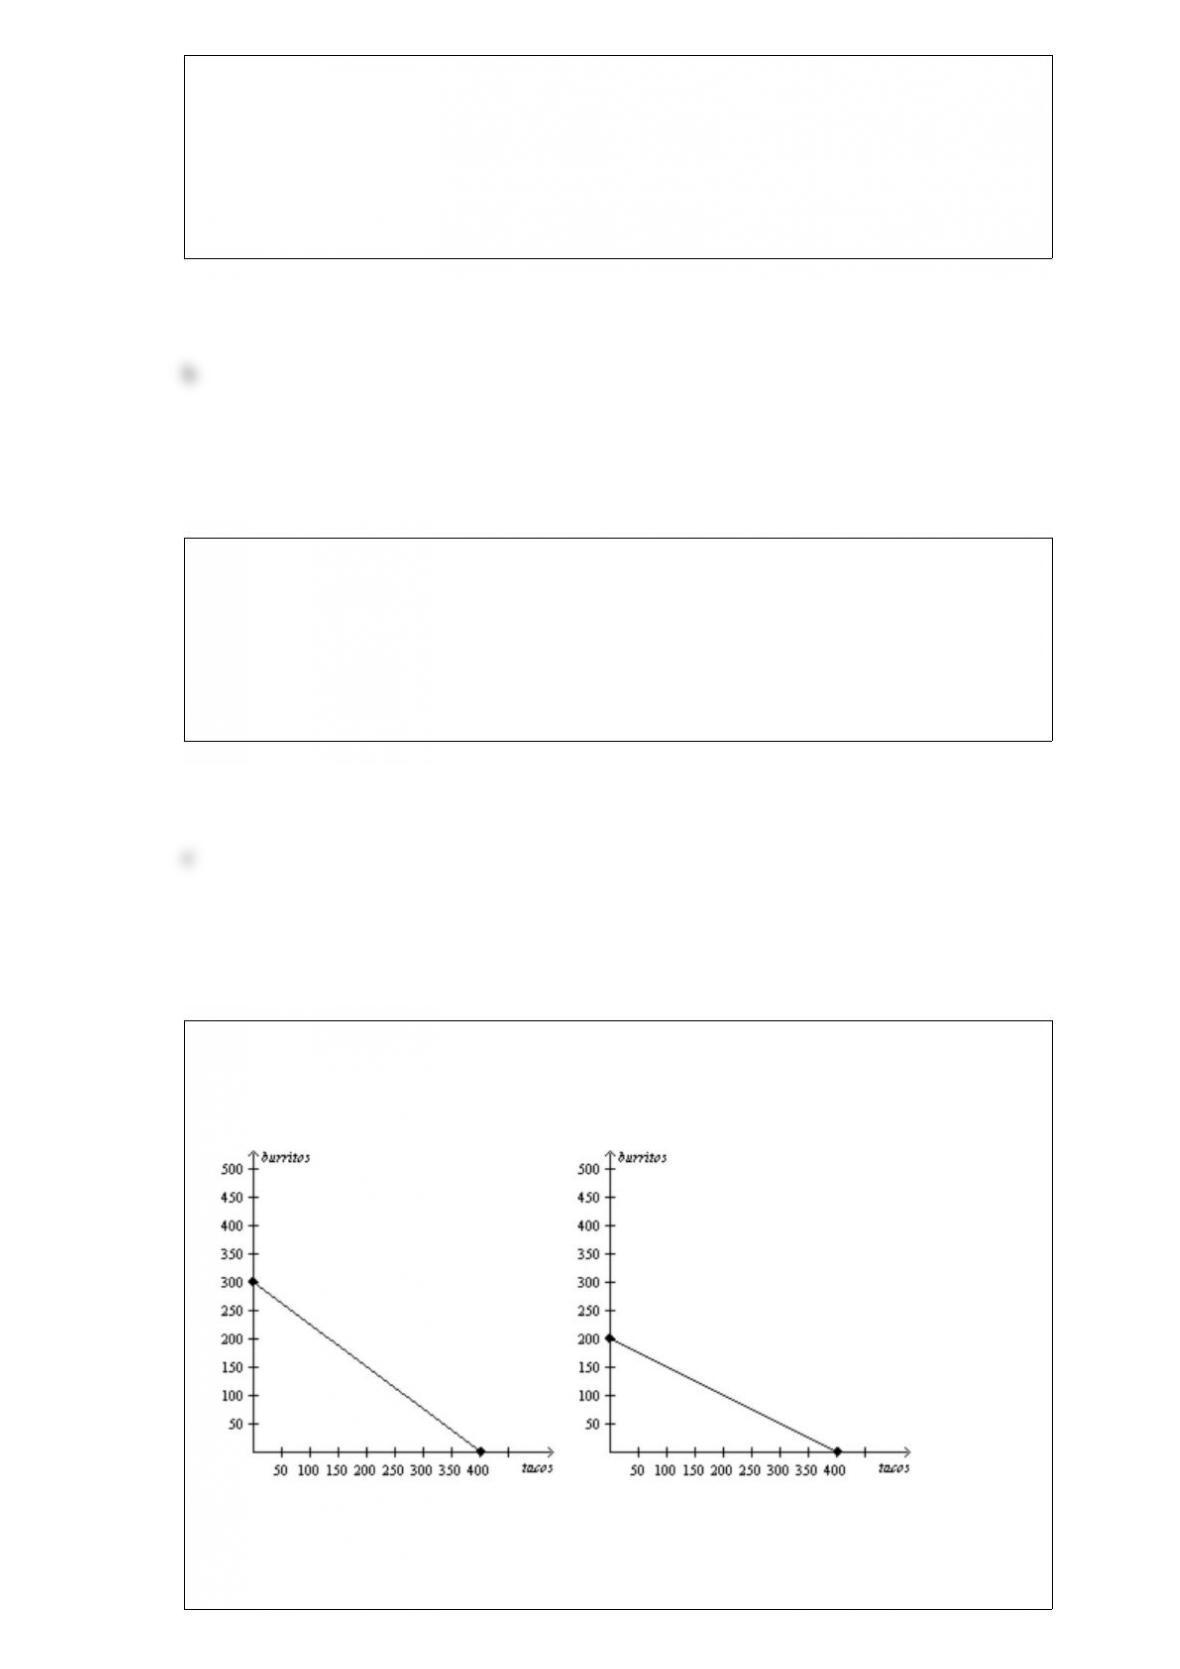
Figure 33
Arturo’s Production Possibilities FrontierDina’s Production Possibilities Frontier
Refer to Figure 33. If Dina must work 0.25 hour to produce each taco, then her
production possibilities frontier is based on how many hours of work?
a. 40 hours
b. 100 hours
c. 400 hours
d. 1600 hours
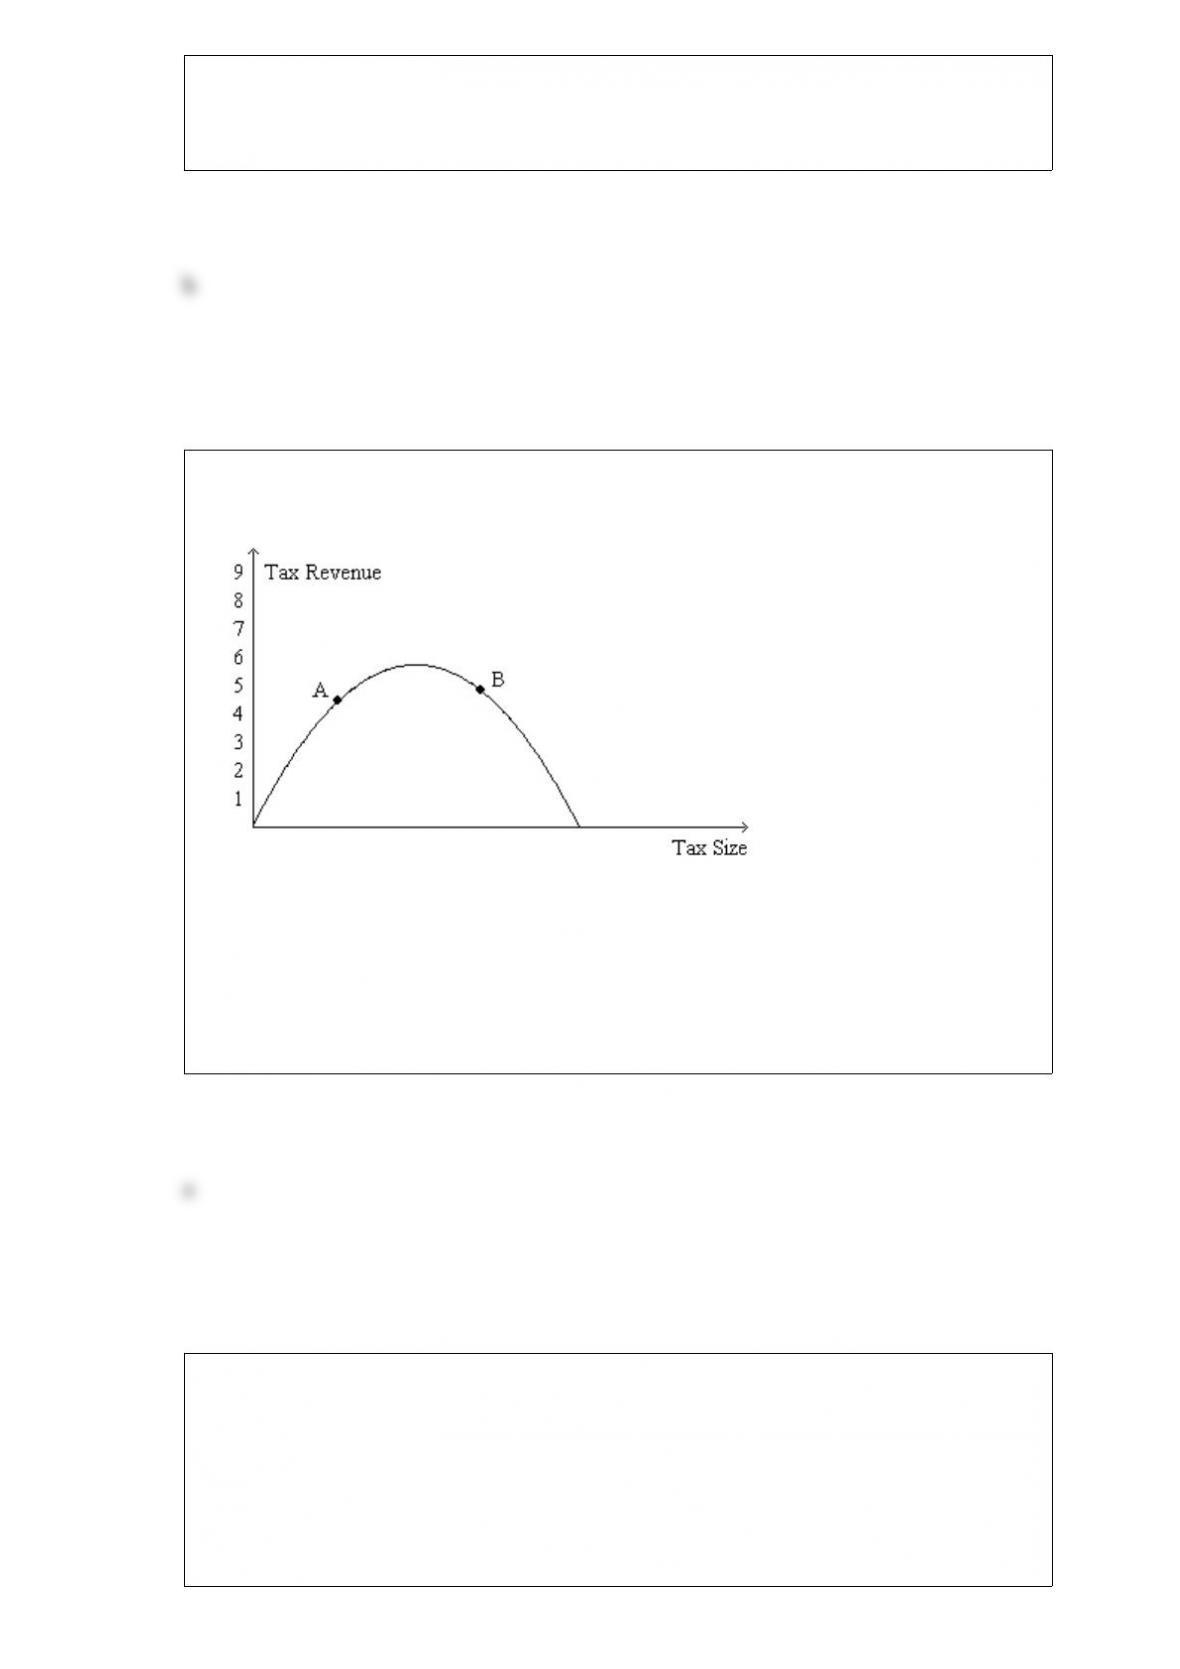
Figure 823. The figure represents the relationship between the size of a tax and the tax
revenue raised by that tax.
Refer to Figure 823. If the economy is at point A on the curve, then a small increase in
the tax rate will
a. increase the deadweight loss of the tax and increase tax revenue.
b. increase the deadweight loss of the tax and decrease tax revenue.
c. decrease the deadweight loss of the tax and increase tax revenue.
d. decrease the deadweight loss of the tax and decrease tax revenue.
The basic principles of economics suggest that
a. markets are seldom, if ever, a good way to organize economic activity.
b. government should become involved in markets when trade between countries is
involved.
c. government should become involved in markets when those markets fail to produce
efficient or fair outcomes.
d. All of the above are correct.

A rational decision maker takes an action if and only if
a. the average benefit of the action exceeds the average cost.
b. the average cost of the action exceeds the average benefit.
c. the marginal benefit of the action exceeds the marginal cost.
d. the marginal cost of the action exceeds the marginal benefit.
A tax affects
a. buyers only.
b. sellers only.
c. buyers and sellers only.
d. buyers, sellers, and the government.
When demand is inelastic, a decrease in price will cause
a. an increase in total revenue.
b. a decrease in total revenue.
c. no change in total revenue but an increase in quantity demanded.
d. no change in total revenue but a decrease in quantity demanded.

All else equal, what happens to consumer surplus if the price of a good increases?
a. Consumer surplus increases.
b. Consumer surplus decreases.
c. Consumer surplus is unchanged.
d. Consumer surplus may increase, decrease, or remain unchanged.
Suppose sellers of liquor are required to send $5.00 to the government for every bottle
of liquor they sell. Further, suppose this tax causes the price paid by buyers of liquor to
rise by $3.00 per bottle. Which of the following statements is correct?
a. This tax causes the supply curve for liquor to shift upward by $5.00 at each quantity
of liquor.
b. The effective price received by sellers is $5.00 per bottle less than it was before the
tax.
c. Forty percent of the burden of the tax falls on buyers.
d. All of the above are correct.
When the price of peaches changes, the demand curve for peaches
a. shifts because the price of peaches is measured on the vertical axis of the graph.
b. shifts because the quantity demanded of peaches is measured on the horizontal axis
of the graph.
c. does not shift because the price of peaches is measured on the vertical axis of the
graph.
d. does not shift because the price of peaches is measured on the horizontal axis of the
graph.
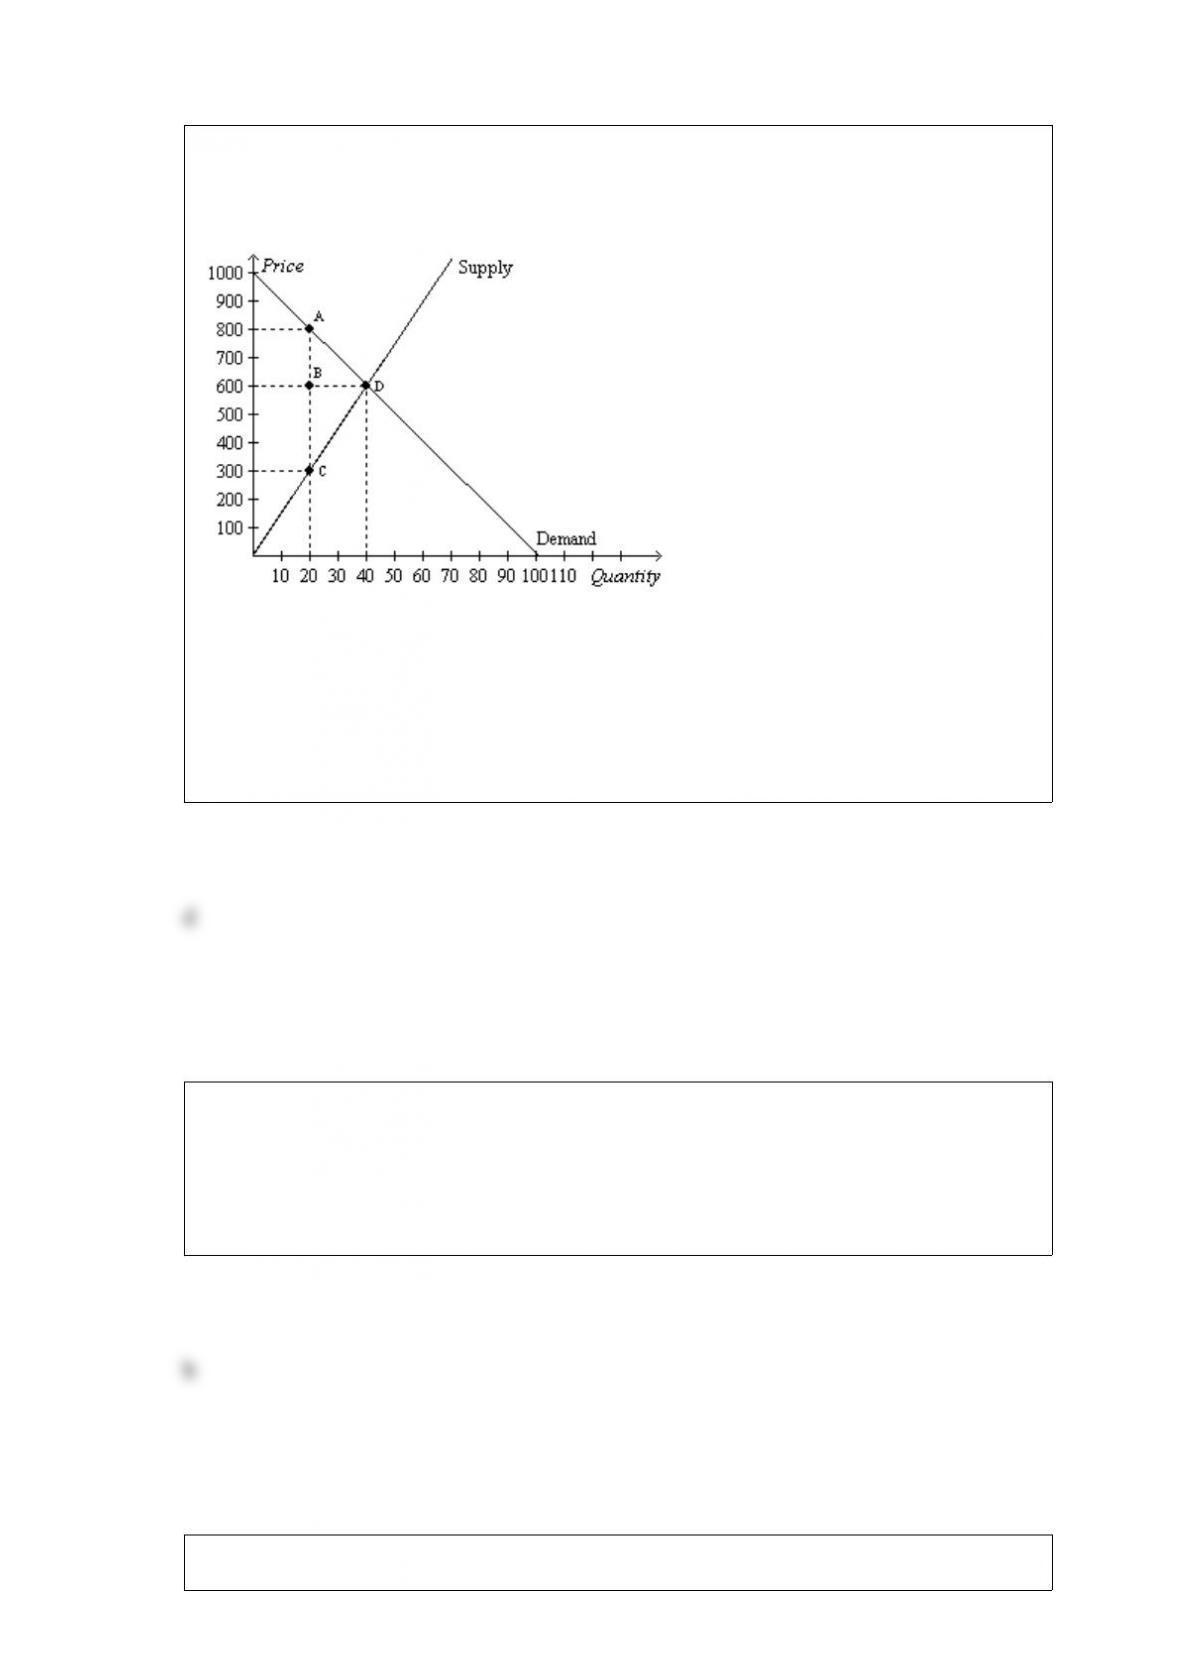
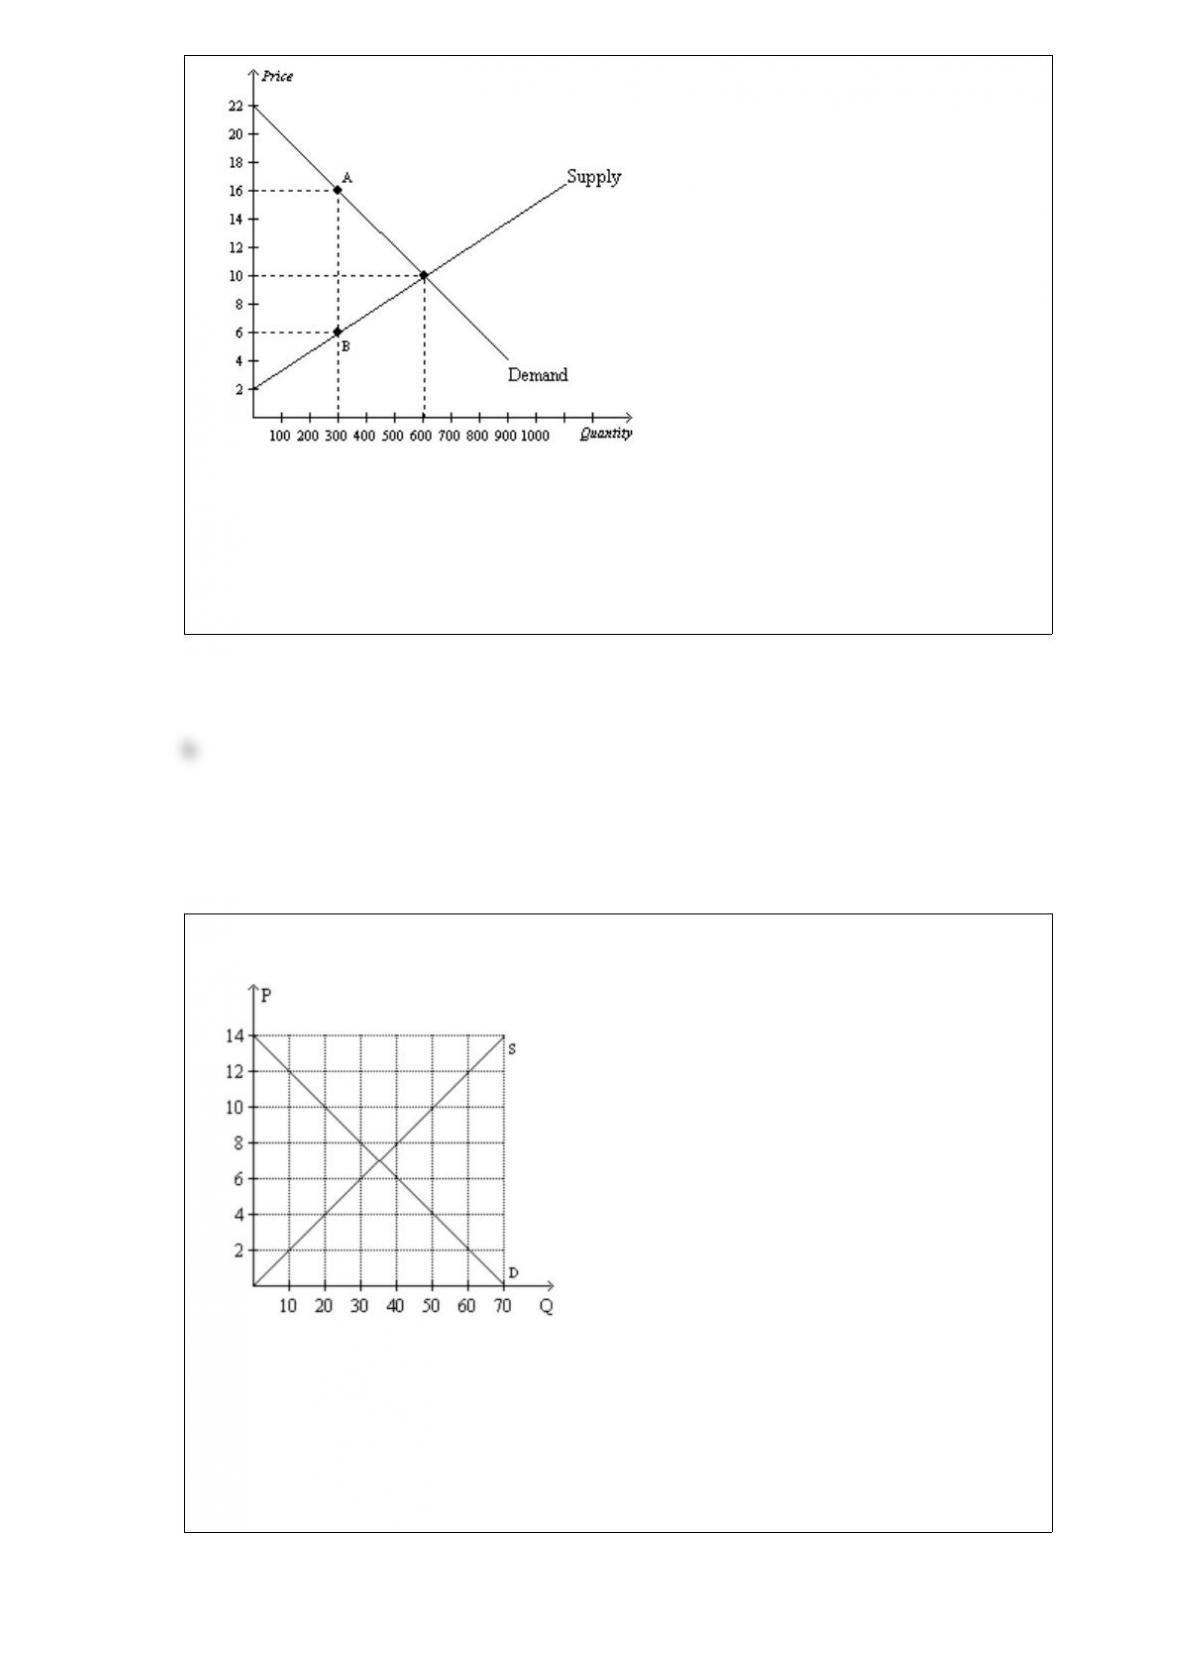
Figure 89
The vertical distance between points A and C represents a tax in the market.
Refer to Figure 89. The equilibrium price and quantity before the imposition of the tax
is
a. P=$800 and Q=20.
b. P=$600 and Q=20.
c. P=$300 and Q=20.
d. P=$600 and Q=40.
A market supply curve shows how the total quantity supplied of a good varies as
a. production technology varies.
b. price varies.
c. input prices vary.
d. demand varies.
Figure 424
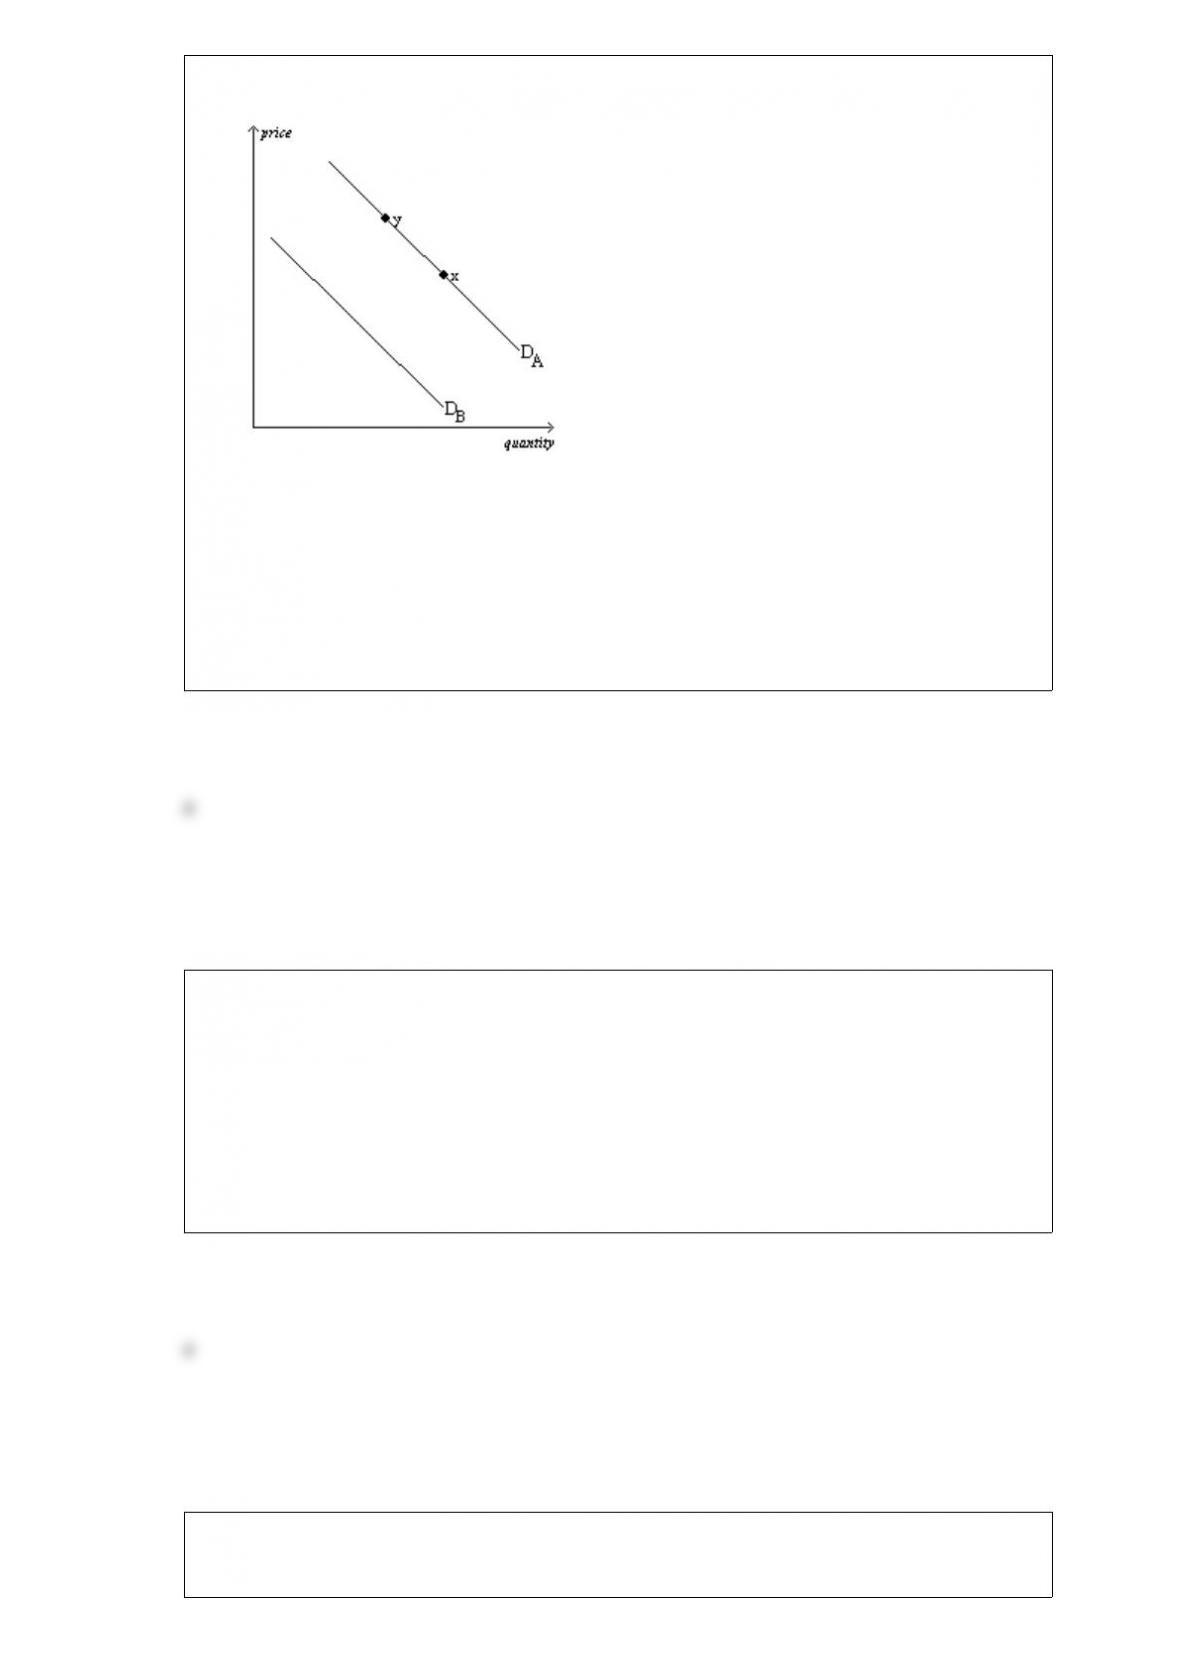
The diagram below pertains to the demand for turkey in the United States.
Refer to Figure 424. All else equal, an increase in the income of buyers who consider
turkey to be an inferior good would cause a move from
a. DA to DB.
b. DB to DA.
c. x to y.
d. y to x.
Consider luxury weekend hotel packages in Las Vegas. When the price is $250, the
quantity demanded is 2,000 packages per week. When the price is $280, the quantity
demanded is 1,700 packages per week. Using the midpoint method, the price elasticity
of demand is about
a. 1.43, and an increase in the price will cause hotels’ total revenue to decrease.
b. 1.43, and an increase in the price will cause hotels’ total revenue to increase.
c. 0.70, and an increase in the price will cause hotels’ total revenue to decrease.
d. 0.70, and an increase in the price will cause hotels’ total revenue to increase.
Figure 86
The vertical distance between points A and B represents a tax in the market.
Refer to Figure 86. When the tax is imposed in this market, consumer surplus is
a. $600.
b. $900.
c. $1,500.
d. $3,000.
Figure 628
Refer to Figure 628. Suppose a tax of $6 per unit is imposed on this market. What will
be the new equilibrium quantity in this market?
a. less than 20 units
b. 20 units
c. between 20 units and 35 units
d. greater than 35 units
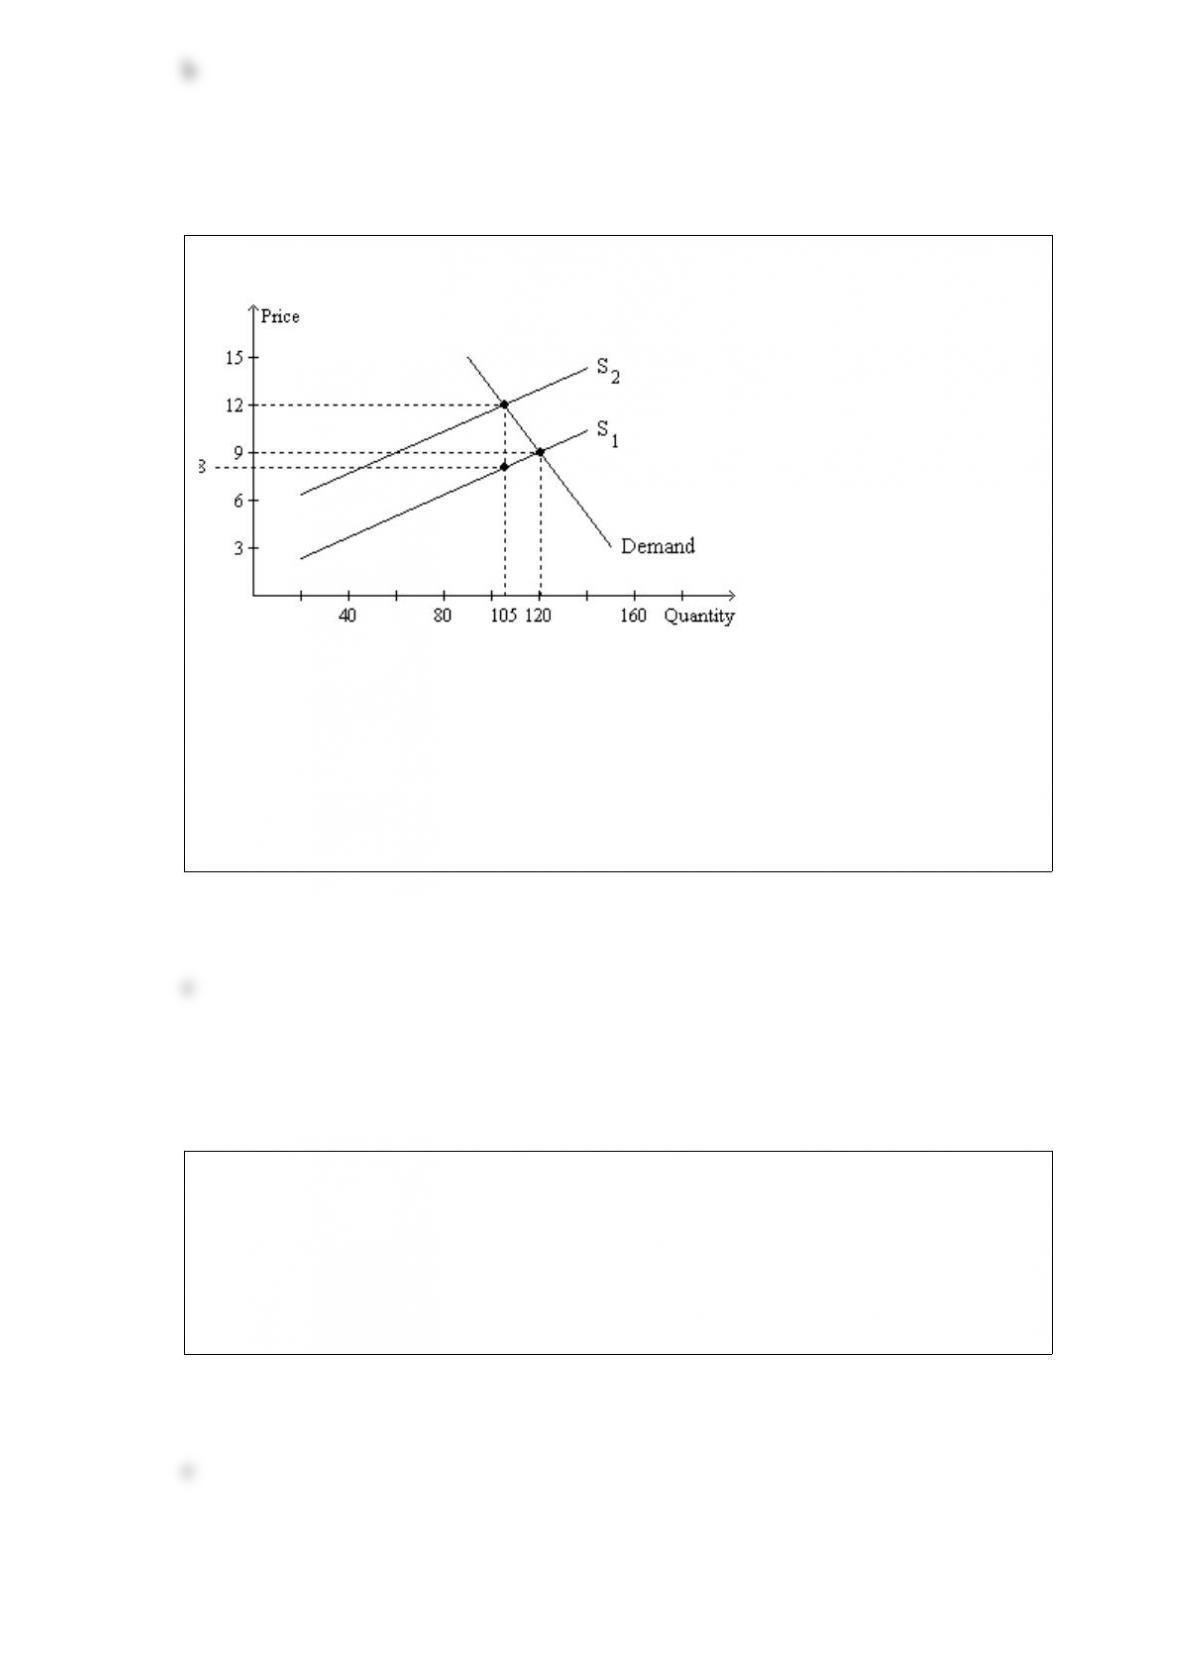
Figure 621
Refer to Figure 621. Suppose buyers, rather than sellers, were required to pay this tax
(in the same amount per unit as shown in the graph). Relative to the tax on sellers, the
tax on buyers would result in
a. buyers bearing a larger share of the tax burden.
b. sellers bearing a smaller share of the tax burden.
c. the same amount of tax revenue for the government.
d. Both a) and b) are correct.
If Freedonia changes its laws to allow international trade in software and the world
price is higher than its domestic price, then it must be the case that
a. both consumer surplus and producer surplus increase.
b. consumer surplus increases and producer surplus decreases.
c. consumer surplus decreases and producer surplus increases.
d. both consumer surplus and producer surplus decrease.
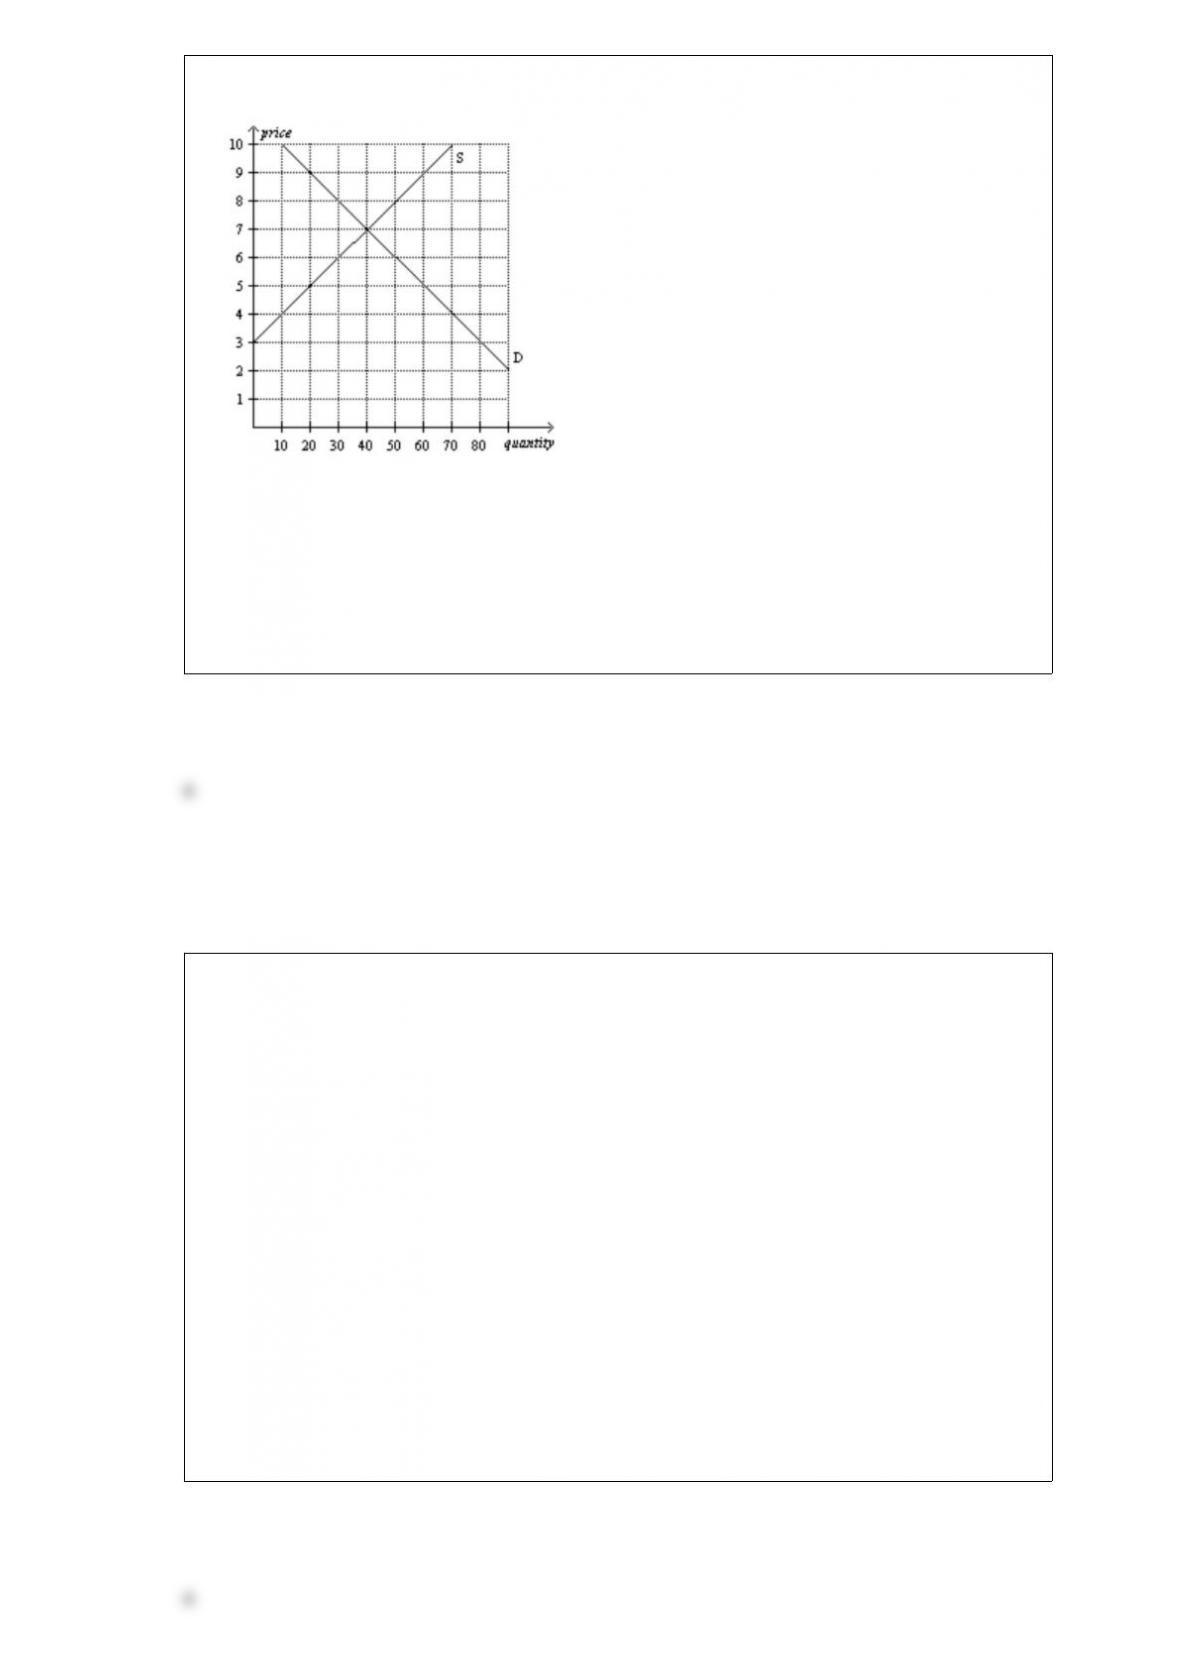
Figure 67
Refer to Figure 67. Suppose a price ceiling of $5 is imposed on this market. As a
result,
a. the quantity of the good supplied decreases by 20 units.
b. the demand curve shifts to the left; quantity sold is now 30 units and the price is $5.
c. buyers’ total expenditure on the good decreases by $80.
d. the price of the good continues to serve as the rationing mechanism.
Table 326
Assume that Japan and Korea can switch between producing cars and producing
airplanes at a constant rate.
Hours Needed to Make 1Quantity Produced in 2400 Hours
CarAirplaneCarsAirplanes
Japan301508016
Korea501504816
Refer to Table 326. Assume that Japan and Korea each has 2400 hours available.
Originally, each country divided its time equally between the production of cars and
airplanes. Now, each country spends all its time producing the good in which it has a
comparative advantage. As a result, the total output of cars increased by
a. 16.
b. 40.
c. 64.
d. 80.

Table 77
BuyerWillingness to Pay
Michael$500
Earvin$400
Larry$350
Charles$300
Refer to Table 77. You have four essentially identical extra tickets to the Midwest
Regional Sweet 16 game in the men’s NCAA basketball tournament. The table shows
the willingness to pay of the four potential buyers in the market for a ticket to the game.
You offer to sell the tickets for $325. How many tickets do you sell, and what is the
total consumer surplus in the market?
a. one ticket; $175
b. two tickets; $225
c. three tickets; $225
d. three tickets; $275
When a country allows trade and becomes an importer of coal,
a. the losses of the domestic producers of coal exceed the gains of the domestic
consumers of coal.
b. the losses of the domestic consumers of coal exceed the gains of the domestic
producers of coal.
c. the gains of the domestic producers of coal exceed the losses of the domestic
consumers of coal.
d. the gains of the domestic consumers of coal exceed the losses of the domestic
producers of coal.
If an electric power plant does not bear the entire cost of the pollution it emits, it will
a. not emit any pollution so as to avoid the entire cost of the pollution.
b. emit lower levels of pollution.
c. emit an acceptable level of pollution.
d. emit too much pollution.
HTMLENTITY#8203HTMLENTITYA shortage is eliminated when
a. HTMLENTITY#8203HTMLENTITYa binding price ceiling is removed.
b. HTMLENTITY#8203HTMLENTITYa binding price ceiling is enacted.
c. HTMLENTITY#8203HTMLENTITYa nonbinding price ceiling is repealed.
d. HTMLENTITY#8203HTMLENTITYa nonbinding price ceiling is imposed.
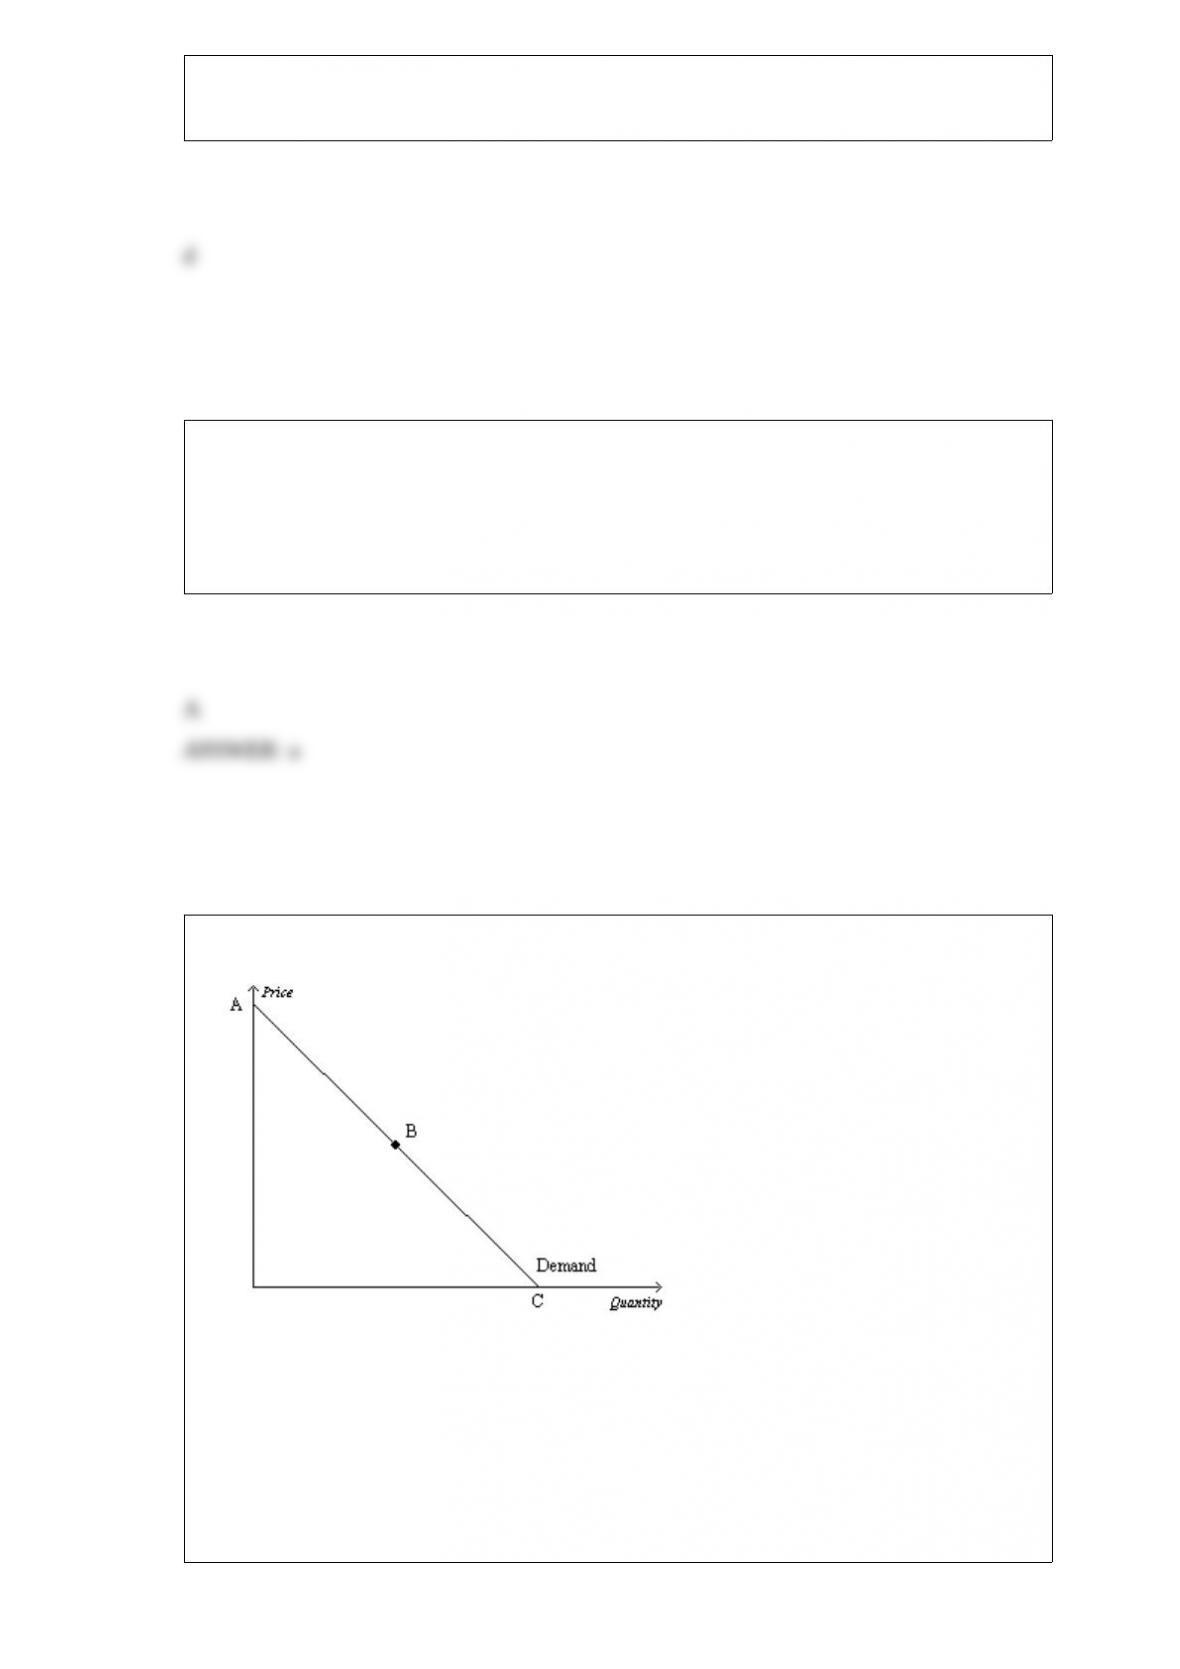
Figure 54
Refer to Figure 54. Assume, for the good in question, two specific points on the
demand curve are (Q = 2,000, P = $15) and (Q = 2,400, P = $12). Then which of the
following scenarios is possible?
a. Both of these points lie on section BC of the demand curve.
b. The vertical intercept of the demand curve is the point (Q = 0, P = $22).
c. The horizontal intercept of the demand curve is the point (Q = 5,000, P = $0).
d. Any of these scenarios is possible.
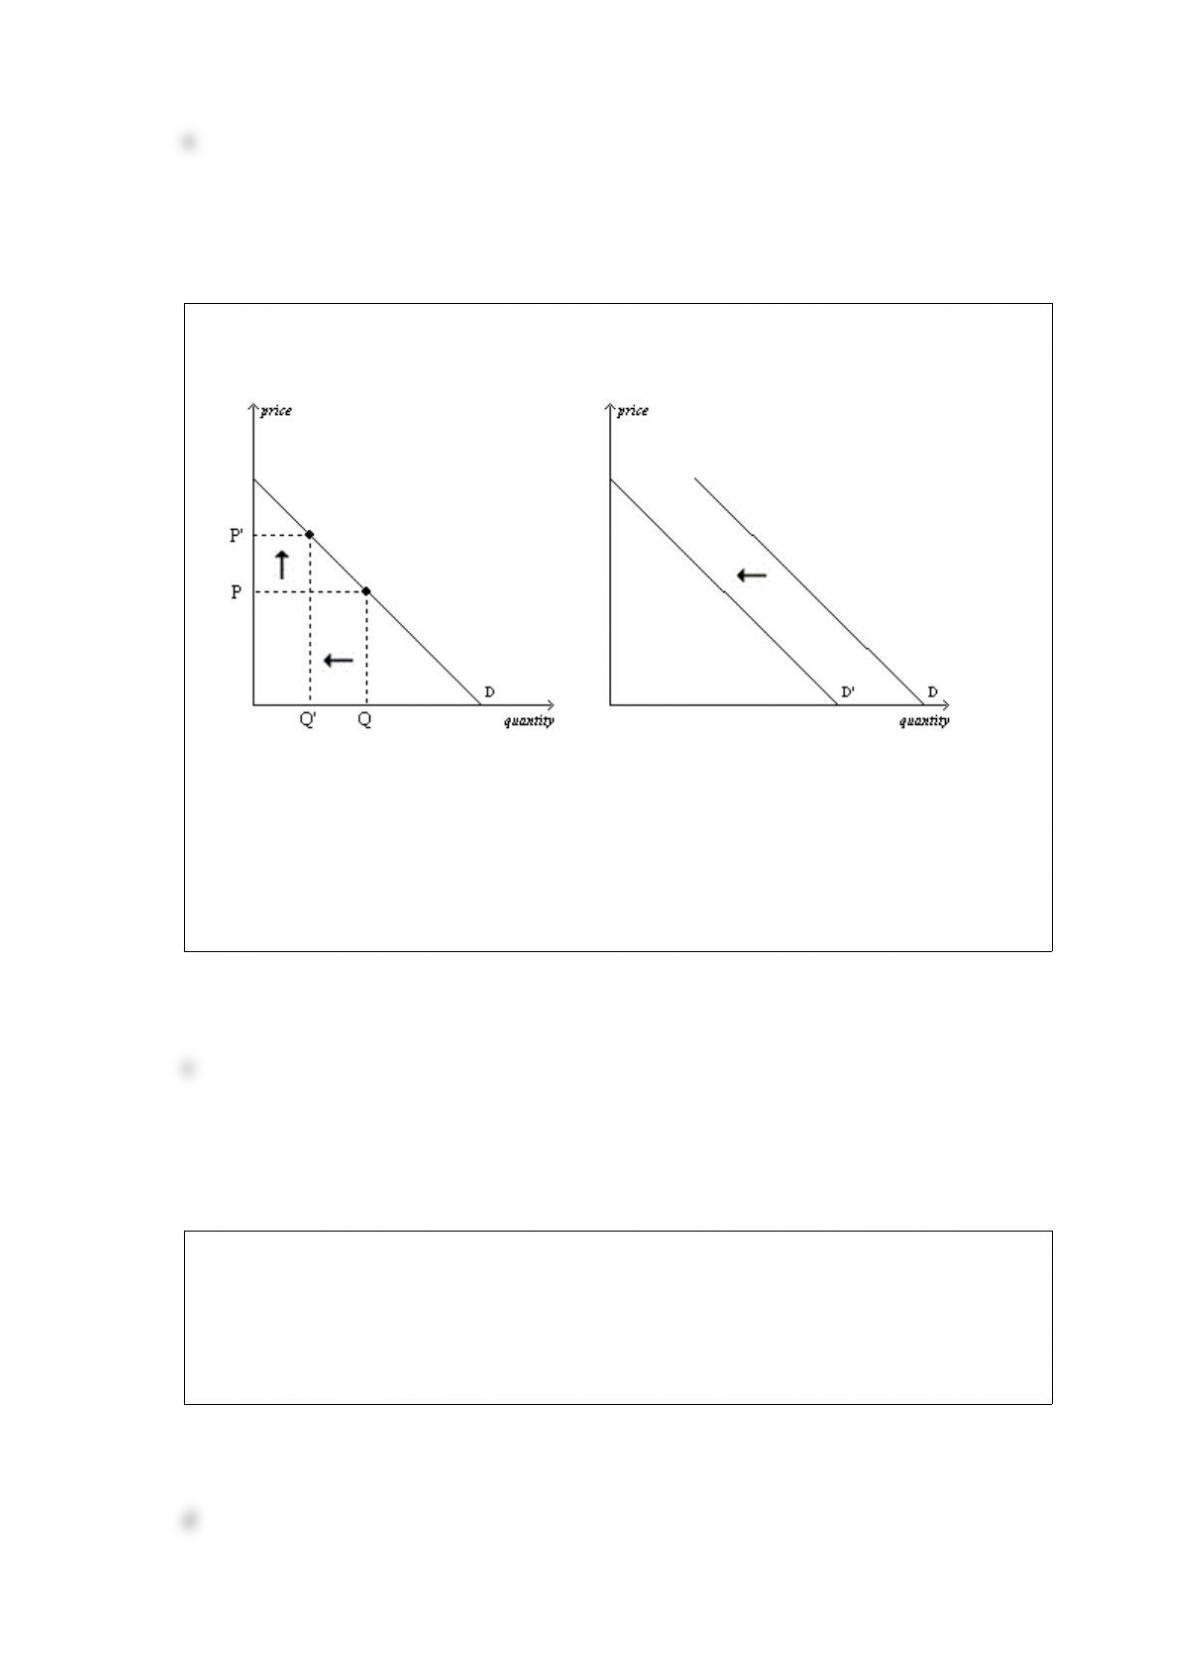
Figure 49
Panel (a)Panel (b)
Refer to Figure 49. The graphs show the demand for cigarettes. In Panel (a), the
arrows are consistent with which of the following events?
a. Tobacco and marijuana are complements, and the price of marijuana decreased.
b. Tobacco is a “gateway drug,” and the price of marijuana increased.
c. The price of cigarettes increased.
d. The arrows are consistent with all of these events.
When supply is perfectly elastic, the value of the price elasticity of supply is
a. 0.
b. 1.
c. greater than 0 and less than 1.
d. infinity.
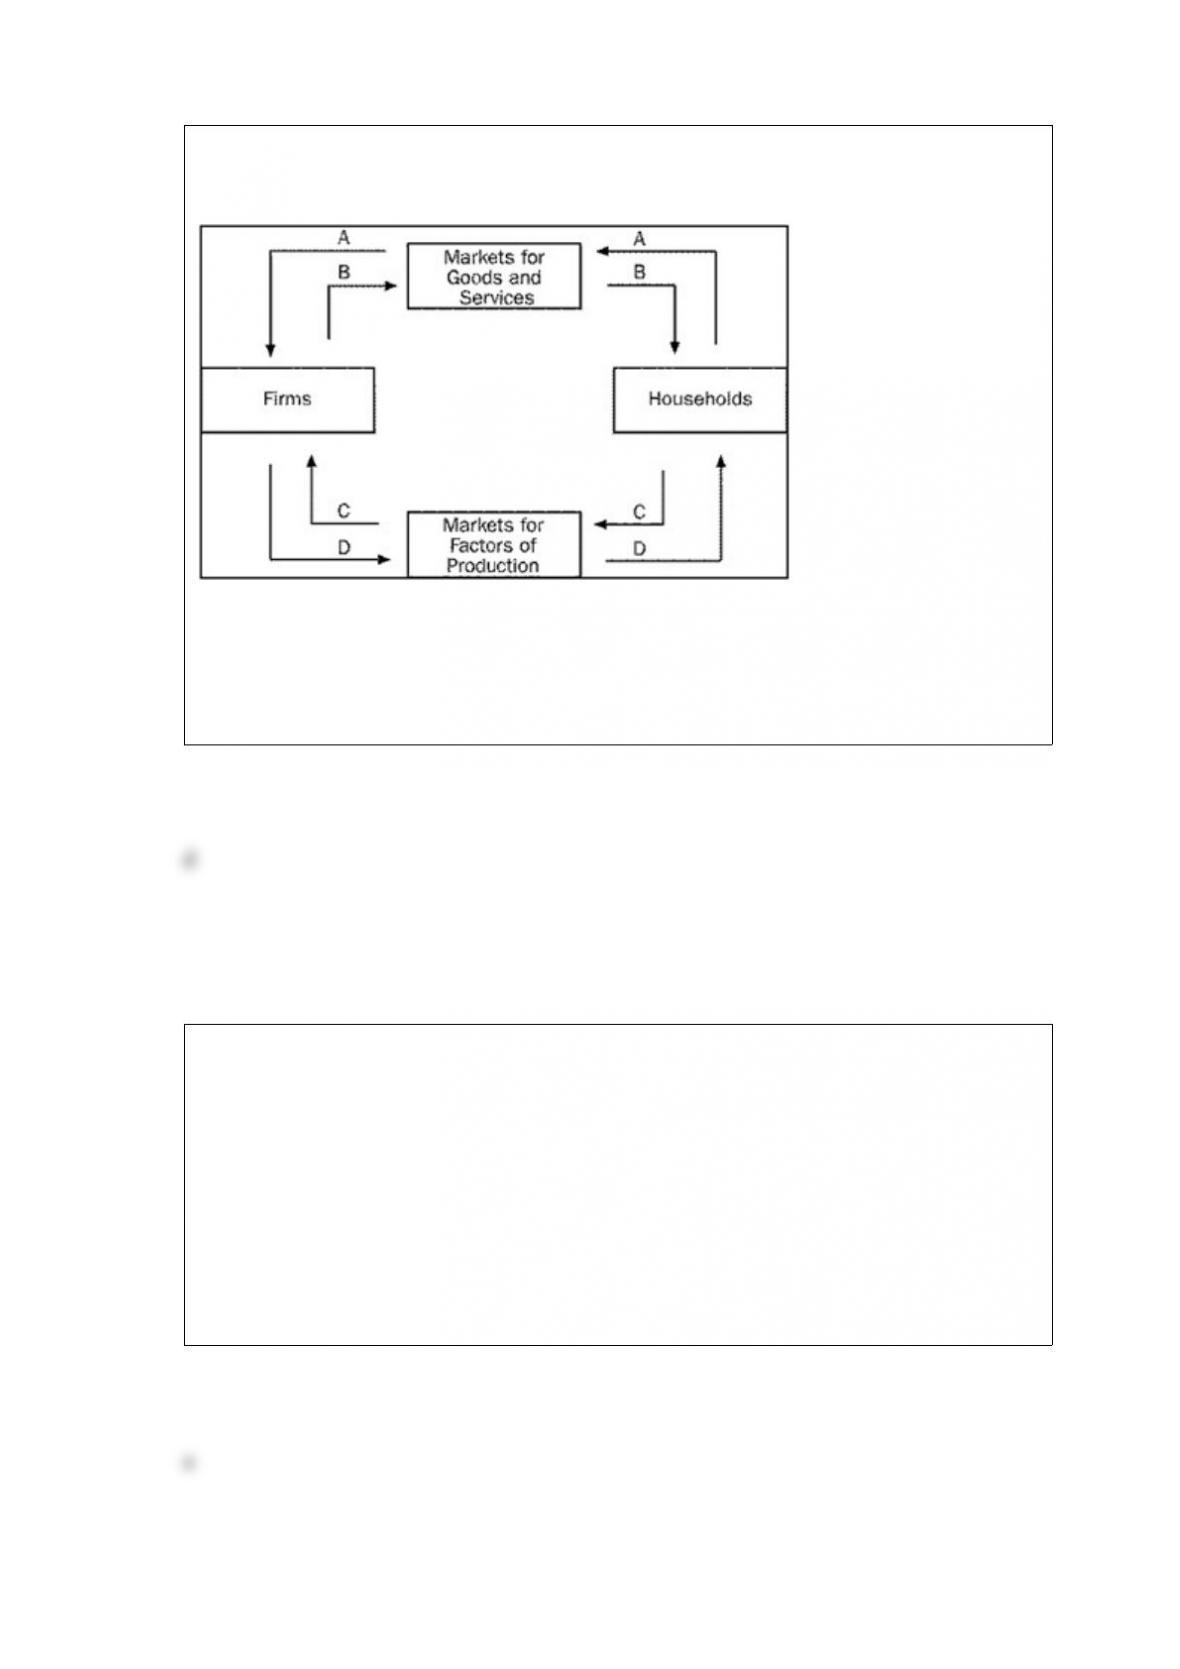
Figure 21
Refer to Figure 21. Which arrow represents the flow of income payments?
a. A
b. B
c. C
d. D
Stephen is restoring a car and has already spent $4,000 on the restoration. He expects to
be able to sell the car for $5800. Stephen discovers that he needs to do an additional
$2,400 of work to make the car worth $5,800 to potential buyers. He could also sell the
car now, without completing the additional work, for $3,800. What should he do?
a. He should sell the car now for $3,800.
b. He should keep the car since it wouldn’t be rational to spend $6,400 restoring a car
and then sell it for only $5,800.
c. He should complete the additional work and sell the car for $5,800.
d. It does not matter which action he takes since the outcome will be the same either
way.

Table 323
Assume that the farmer and the rancher can switch between producing pork and
producing tomatoes at a constant rate.
Labor Hours Needed to Make 1 Pound of Pounds Produced in 24 Hours
PorkTomatoesPorkTomatoes
Farmer6348
Rancher4466
Refer to Table 323. The opportunity cost of 1 pound of tomatoes for the farmer is
a. 1/2 pound of pork.
b. 2 hours of labor.
c. 2 pounds of pork.
d. 4 hours of labor.