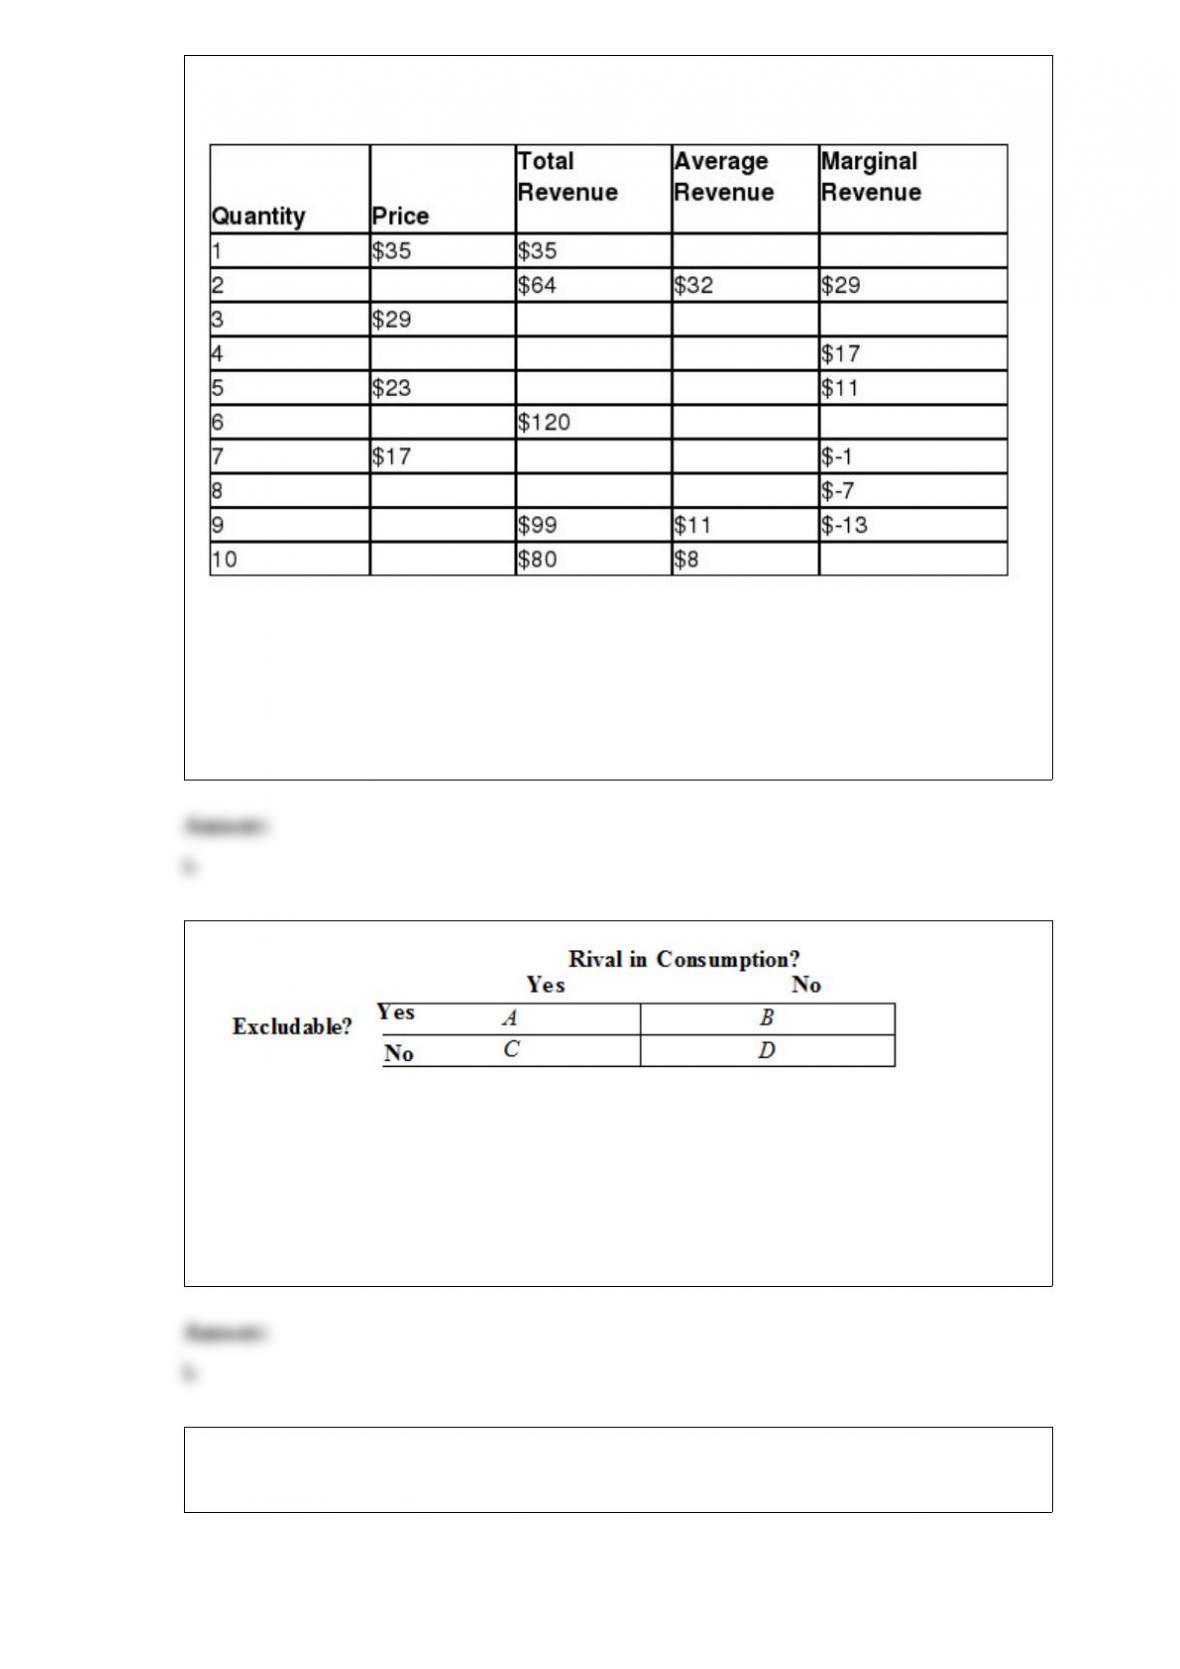
1) Table 15-1
Assume this monopolist’s marginal cost is constant at $12. What quantity of output (Q)
will it produce and what price (P) will it charge?
a. Q = 4, P = $29
b. Q = 4, P = $26
c. Q = 5, P = $23
d. Q = 7, P = $17
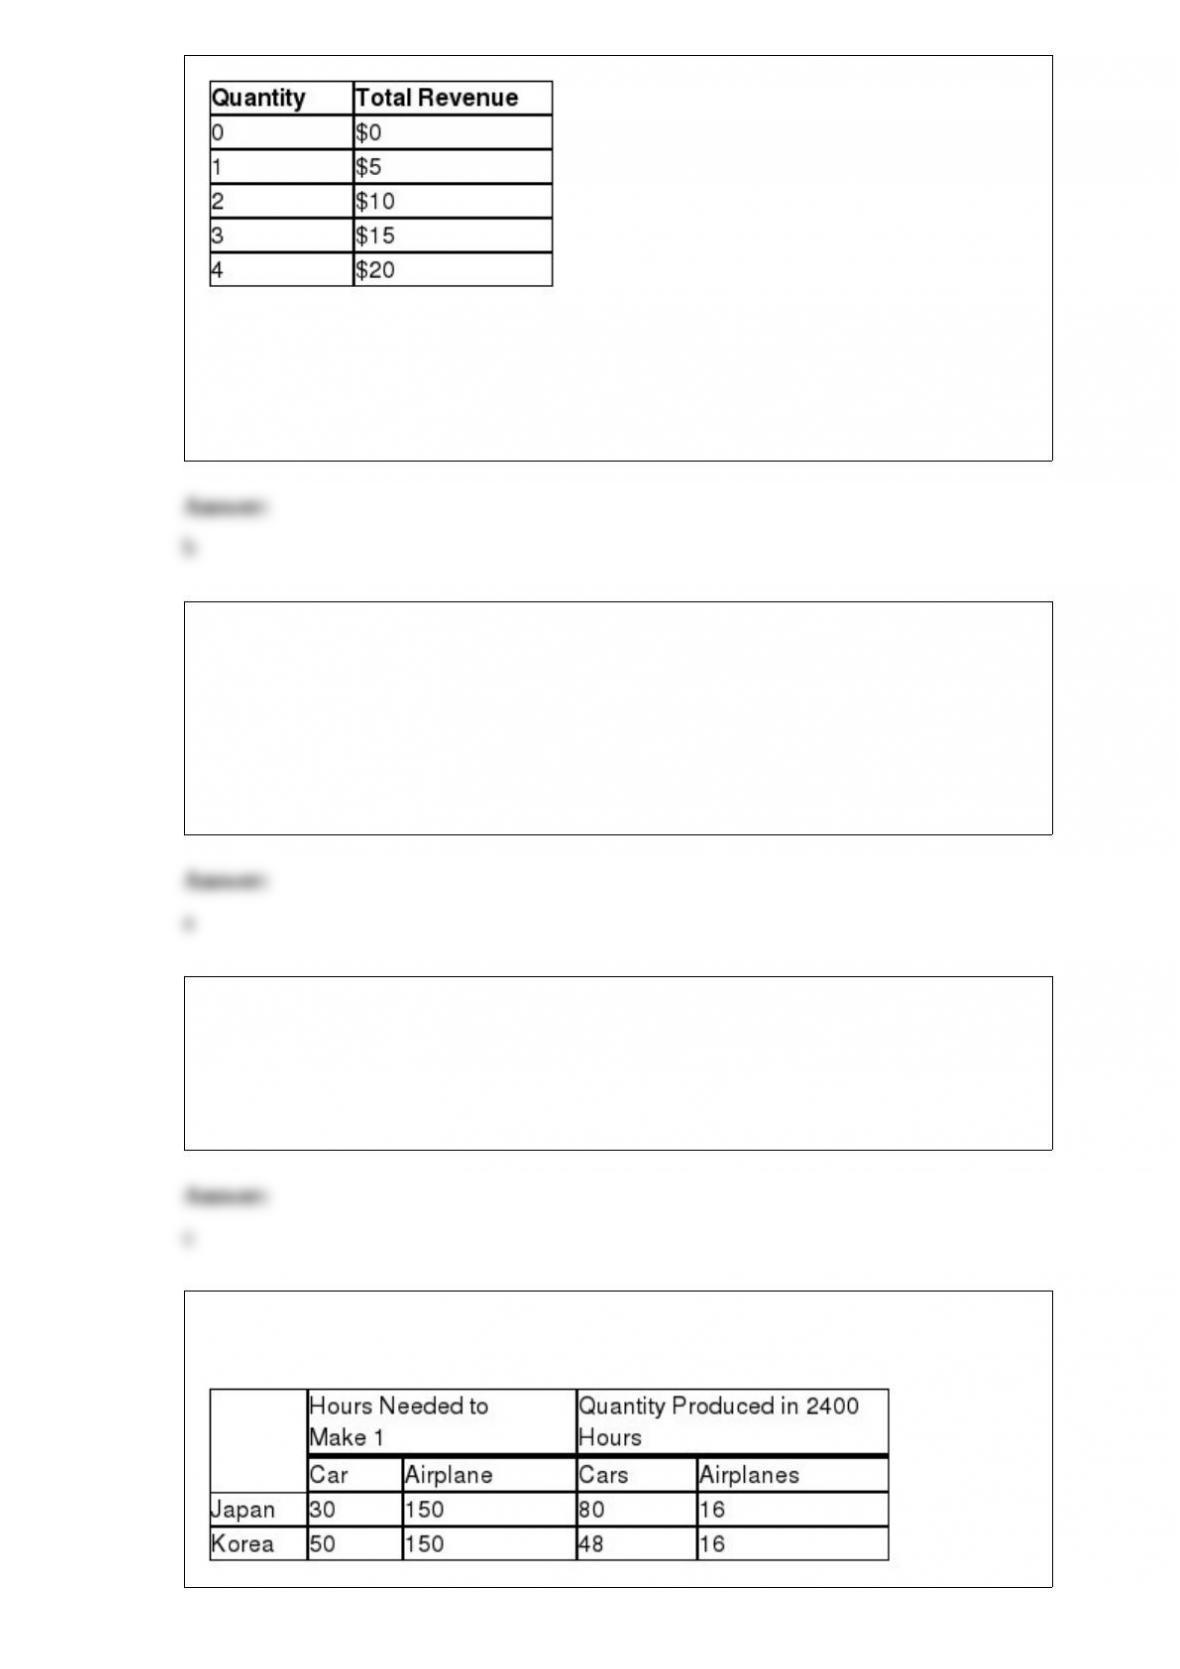
2)
Which of the following items is not an example of the type of good represented by Box
D?
a.a mathematical theorem
b.an uncongested toll road
c.national defense
d.fighting poverty
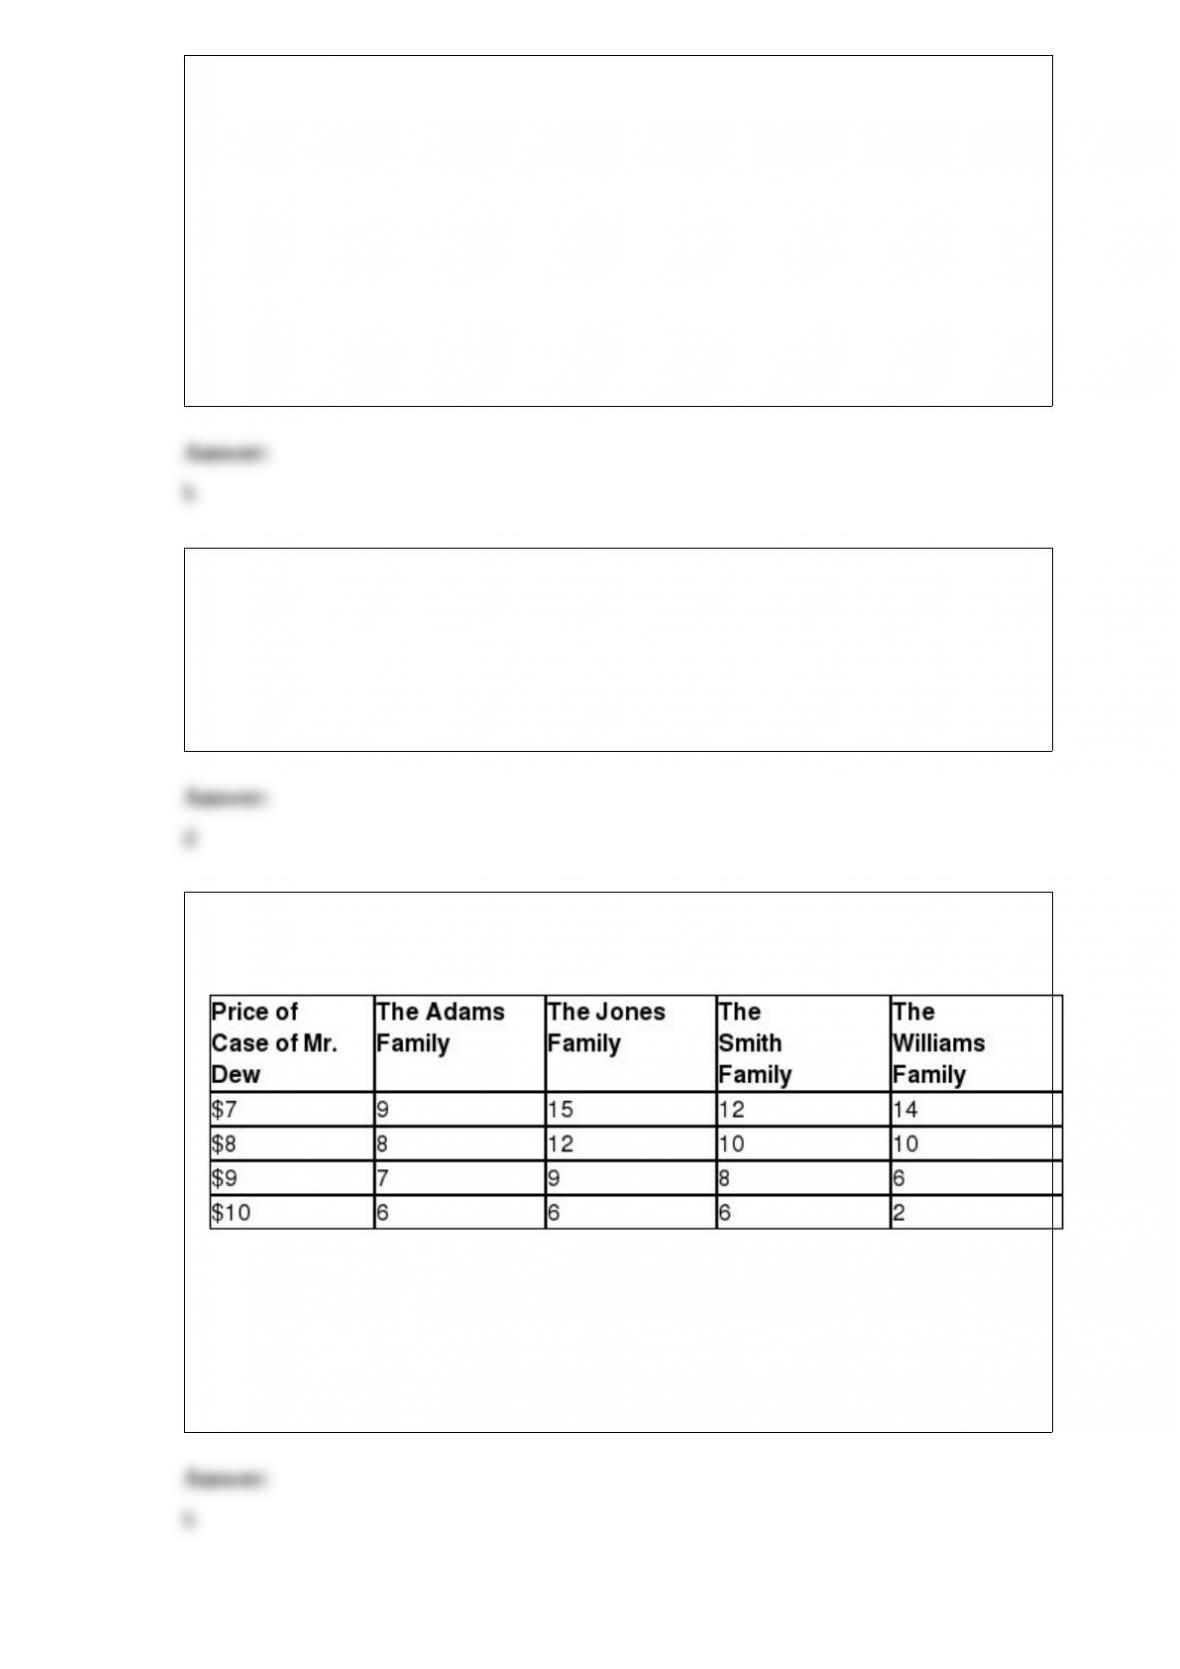
3) Table 14-4
The table represents a demand curve faced by a firm in a competitive market.
For this firm, the average revenue is
a. $0.
b.$5.
c.$10.
d.$15.
4) Which of the following is not an example of a barrier to entry?
a.A soybean farmer is the first in her county to use a new brand of fertilizer.
b.Microsoft obtains a copyright for its Windows operating system.
c.A pharmaceutical company obtains a patent for a new medication to treat migraine
headaches.
d.A taxi cab driver in New York City obtains a license to legally provide transportation
in New York City.
5) Which of the following statements is not correct?
a.Common resources are rival in consumption but are not excludable.
b.Uncongested toll roads are examples of club goods.
c.When African elephants were privatized, the survival of the species deteriorated.
d.National defense is not rival in consumption, nor is it excludable.
6) Assume that Japan and Korea can switch between producing cars and producing
airplanes at a constant rate.
We could use the information in the table to draw a production possibilities frontier for
Japan and a second production possibilities frontier for Korea. If we were to do this,
measuring cars along the horizontal axis, then
a.the slope of Japan’s production possibilities frontier would be 5 and the slope of
Korea’s production possibilities frontier would be -3.
b.the slope of Japan’s production possibilities frontier would be 0.2 and the slope of
Korea’s production possibilities frontier would be -0.33.
c.the slope of Japan’s production possibilities frontier would be 0.2 and the slope of
Korea’s production possibilities frontier would be 0.33.
d.the slope of Japan’s production possibilities frontier would be 5 and the slope of
Korea’s production possibilities frontier would be 3.
7) If a 10% decrease in price for a good results in a 20% increase in quantity demanded,
the is
a. 0.50.
b.1
c.1.5.
d.2
8) The table below shows the quantities demanded of cases of Mt. Dew per month by
four families at various prices.
Suppose the four families listed in the table are the only demanders of Mt. Dew in the
market. If the price of a case of Mt. Dew decreases by $1, the
a.market quantity demanded decreases by 10
b.market quantity demanded increases by 10
c.Adams family increases its quantity demanded by more than the Smith family.
d.Jones family increases its quantity demanded by more than the Williams family.
9) Table 17-7
The information in the table below shows the total demand for internet radio
subscriptions in a small urban market. Assume that each company that provides these
subscriptions incurs an annual fixed cost of $20,000 (per year) and that the marginal
cost of providing an additional subscription is always $16.
Refer to Table 17-7. The socially efficient level of output supplied to this market is
a. 4,000
b. 5,000
c. 6,000
d. 8,000
10) Table 12-9
United States Income Tax Rates for a Single Individual, 2012 and 2013.
Ruby Sue is a single person whose taxable income is $100,000 a year. What happened
to her marginal tax rate between 2012 and 2013?
a.It increased.
b.It decreased.
c.It did not change.
d.We do not have enough information to answer this question.

11) In 2011 the top 5 percent of income earners accounted for over 50% of all income
received by United States’ families.
a.True
b.False
12) A survey of professional economists revealed that more than three-fourths of them
agreed with a number of statements, including which of the following?
a.Tariffs and import quotas usually reduce general economic welfare.
b.A large federal budget deficit has an adverse effect on the economy.
c.Minimum wage increases unemployment among young and unskilled workers.
d.All of the above are correct.
13) Which of the following is not an example of scarcity?
a.Only some people can afford to buy a BMW automobile.
b.Every individual in society cannot attain the highest standard of living to which he or
she might aspire.
c.Miranda has an unlimited supply of oranges in her orchard.
d.Each member of a household cannot get everything he or she wants.
14) Taxes create deadweight losses.
a.True
b.False