Local or state offices of the Department of Justice usually set prices for natural
monopolies in their jurisdictions.
The quantity equation becomes the basis for a theory when we assume that velocity of
money is constant.
If speculators believe a currency is soon going to be revalued, they will increase their
demand for that currency.
The problem with inflation is that as prices rise, consumers can no longer afford to buy
as many goods and services.
For all points below the 45-degree line, planned aggregate expenditure will be less than
GDP.
The minimum point on the average variable cost curve is called the loss-minimizing
point.
Firms in monopolistic competition compete by selling similar, but not identical
products.
According to new growth theory, firms accumulate the efficient level of both physical
and knowledge capital.
A tariff is a numerical limit on the quantity of a good that can be imported.
The ability to engage in product differentiation is one of the factors a manager or owner
of a firm can control in order to create value for consumers.
The costs to firms of changing prices are called menu costs.
Canada has a single-payer health care system in which the government provides
national health insurance to all Canadian residents.
The largest percentage of federal income tax revenue in the United States is paid by the
A) lowest income taxpayers.
B) middle income taxpayers.
C) highest income taxpayers.
D) All groups of taxpayers-low income, high income and middle income-pay the same
percent of federal income taxes.
Which of the following explains why fluctuations in real GDP have become less
volatile in the United States since 1950?
A) Services have become a smaller fraction of GDP since the 1950s.
B) Unemployment insurance and other government transfer programs are more
prevalent since the 1950s.
C) The government has become more reluctant to intervene when real GDP declines
and unemployment rises since the 1950s.
D) both B and C
Figure 13-16
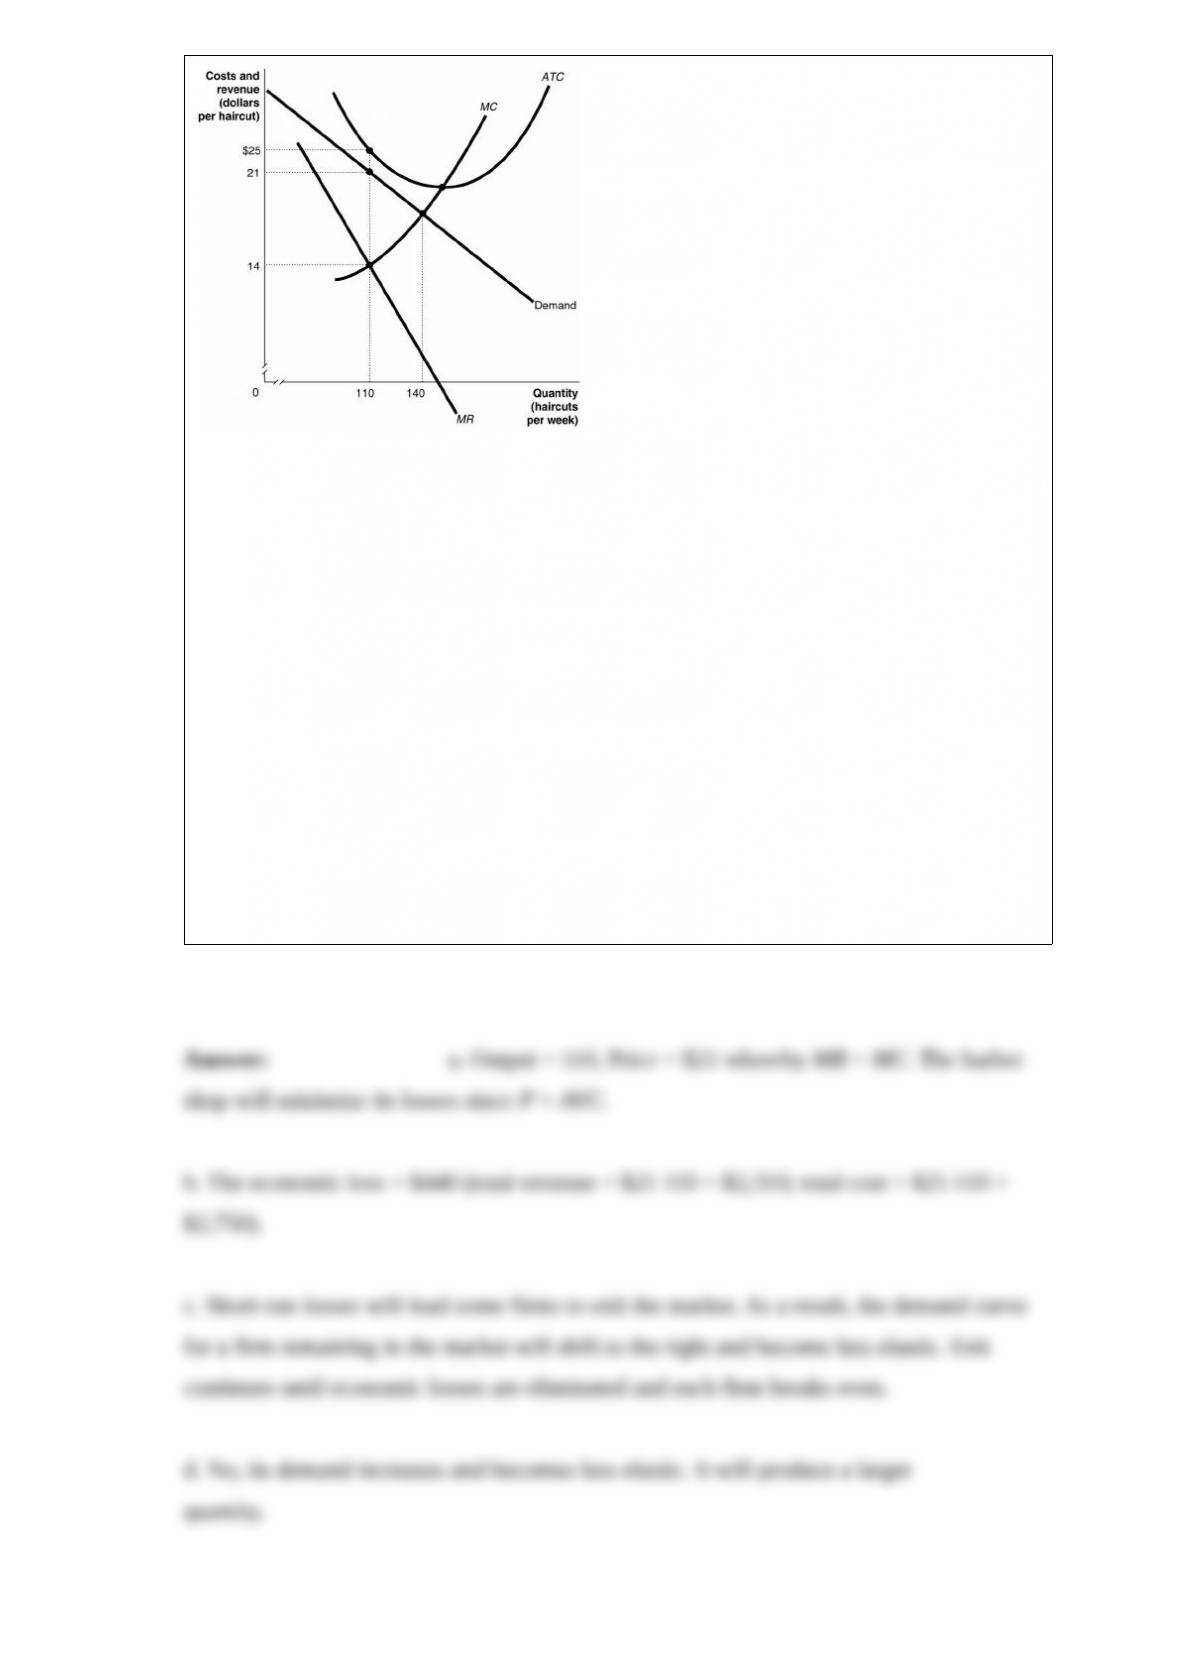
Figure 13-16 depicts a monopolistically competitive barber shop. Use the diagram to
answer the following questions.
a. Suppose the average variable cost of production is $15 when output equals 110
haircuts and $15.25 when output equals 140 haircuts. If the firm wants to maximize its
profit or minimize its losses, how many haircuts will it produce and what price should it
charge? Explain your answer.
b. Calculate the firm’s profit or loss.
c. What is likely to happen in this industry over time as it moves to its new long-run
equilibrium?
d. Suppose the barber shop depicted in the diagram remains in the industry. Is this
barber shop likely to produce this same quantity of haircuts as in part (a) in the long
run?
The long-run Phillips curve is ________ than the short-run Phillips curve.
A) flatter
B) steeper
C) less stable
D) more volatile
Spending on the war in Afghanistan is essentially categorized as government purchases.
How do increases in spending on the war in Afghanistan affect the aggregate demand
curve?
A) They will move the economy down along a stationary aggregate demand curve.
B) They will move the economy up along a stationary aggregate demand curve.
C) They will shift the aggregate demand curve to the right.
D) They will shift the aggregate demand curve to the left.
State and local governments subsidize college students with grants and low-interest
loans. The loans and subsidies are examples of
A) positive externalities.
B) Coase subsidies.
C) Pigovian subsidies.
D) emission allowances.
A product is considered to be nonexcludable if
A) you can keep those who did not pay for the item from enjoying its benefits.
B) you cannot keep those who did not pay for the item from enjoying its benefits.
C) your consumption of the product reduces the quantity available for others to
consume.
D) it is jointly owned by all members of a community.
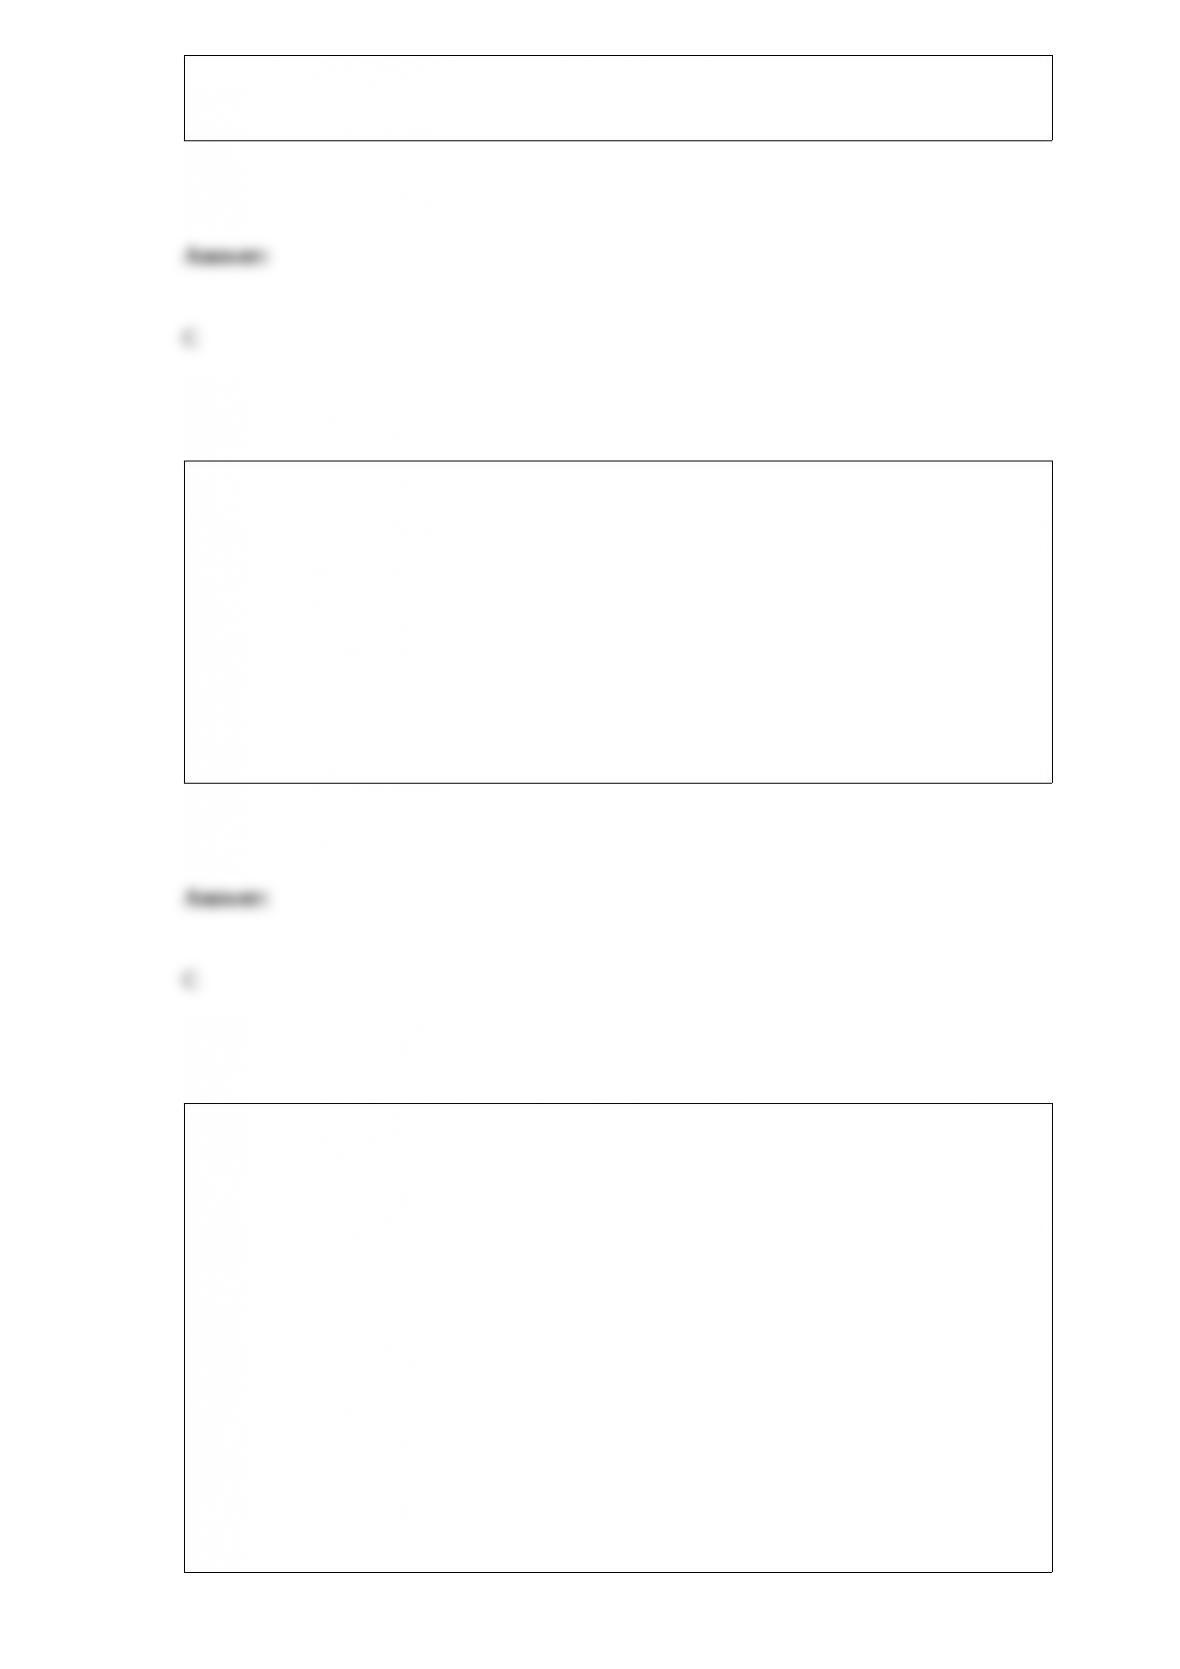
Table 2-5
Table 2-5 shows the number of labor hours required to produce a cell phone and a board
foot of lumber in Estonia and Finland. If the two countries specialize and trade, who
should export cell phones?
A) There is no basis for trade between the two countries.
B) Estonia
C) Finland
D) They should both be importing cell phones.
In a subgame perfect equilibrium
A) the first mover has an advantage over other players.
B) the last mover has an advantage over other players.
C) each player’s strategy constitutes a Nash equilibrium at every subgame of the
original game.
D) each player has the same response as the others at every subgame of the tree.
One reason for the success that firms have in getting the government to erect barriers to
foreign competition is that jobs lost to foreign competition are easy to identify but jobs
created by foreign trade are often hard to identify. Which of the following is a second
reason?
A) The costs that tariffs and quotas impose on consumers are large in total but relatively
small per person.
B) People who benefit from foreign trade tend not to vote in elections; people who are
harmed by foreign trade are much more likely to vote.
C) Firms that benefit from trade barriers have more money to lobby government
officials to support the barriers than do firms that are harmed by trade barriers.
D) The benefits from free trade are less than the costs.
In order to avoid the imposition of other types of trade barriers, foreign producers will
sometimes agree to voluntary export restraints. With voluntary export restraints, foreign
producers
A) agree to meet specific quality standards required by the importing country.
B) limit their exports to a country.
C) pay a tax on all products they export.
D) must agree to import an equal quantity of products that they export.
Examples of ________ show how trade between two countries can make each better
off.
A) absolute advantage
B) comparative advantage
C) autarky
D) trade barriers
Which of the following describes a characteristic of a perfectly competitive market?
A) There are many buyers but few sellers.
B) There are many sellers but few buyers.
C) There are many buyers and sellers.
D) Equilibrium is achieved when demand for the product sold in the market equals the
supply.
If planned aggregate expenditure is greater than total production,
A) actual inventories will equal planned inventories.
B) firms will experience an unplanned increase in inventories.
C) GDP will increase.
D) the economy is in equilibrium.
Suppose the governor of California has proposed increasing toll rates on California’s
toll roads, and has presented two possible scenarios to implement these increases.
Following are projected data for the two scenarios for the California toll roads: Scenario
1: Toll rate in 2012: $10.00. Toll rate in 2016: $22.50
For every 100 cars using the toll roads in 2012, only 81.6 cars will use the toll roads in
2016. Scenario 2: Toll rate in 2012: $10.00. Toll rate in 2016: $17.50
For every 100 cars using the toll roads in 2012, only 96.2 cars will use the toll roads in
2016.
a. Using the midpoint formula, calculate the price elasticity of demand for Scenario 1
and Scenario 2.
b. Assume 10,000 cars use California toll roads every day in 2012. What would be the
daily total revenue received for each scenario in 2012 and in 2016?
c. Is demand under Scenario 1 and under Scenario 2 price elastic, inelastic, or unit
elastic. Briefly explain.
(For above questions, assume that nothing other than the toll change occurs during the
time frame listed that would affect consumer demand.)
C = 4,000 + 0.5Y
I = 1,500
G=2,250
NX = -150 Given the equations for C, I, G, and NX above, what is the equilibrium level
of GDP (Y)?
Provide two examples of a government barrier to entry.
If you own a bond with a 3 percent coupon rate and new bonds are paying 8 percent,
what will happen to your bond’s market price?
What is the difference between accounting profit and economic profit?
What is the law of supply? What does this law imply about the shape of the supply
curve?