
If a graph has a line that shows the amount of outsourcing in the last ten years, it is
known as
A) a pie chart.
B) a time-series graph.
C) a demand curve for outsourcing.
D) a supply curve of outsourcing.
Soo Jin shares a one-bedroom apartment with her classmate. Her share of the rent is
$700 per month. She is considering moving to a studio apartment which she will not
have to share with anyone. The studio apartment rents for $950 per month. Recently,
you ran into Soo Jin on campus and she tells you that she has moved into the studio
apartment. Soo Jin is as rational as any other person. As an economics major, you
rightly conclude that
A) Soo Jin did not have a choice; her roommate was a slob.
B) Soo Jin figures that the additional benefit of having her own place (as opposed to
sharing) is at least $250.
C) Soo Jin figures that the benefit of having her own place (as opposed to sharing) is at
least $950.
D) the cost of having one’s own space outweighs the benefits.
Which of the following is most likely to be able to sustain economic growth in an
economy?

A) sustained increases in the labor force participation rate
B) technological change
C) increases in capital per hour worked
D) accumulations of economic resources
Draw a demand curve and label it D1. On the graph, illustrate an increase in demand
and a decrease in demand, and label the curves D2 and D3, respectively. Starting on
demand curve D1, explain the shift that would result from each of the following events:
a. a decrease in income and the good is a normal good
b. a decrease in income and the good is an inferior good
c. an increase in the price of a substitute good
d. an increase in the price of a complementary good
e. a decrease in the taste for the good
f. an increase in population
g. a decrease in the expected future price of the good
When you buy newly-issued shares of Facebook stock, this transaction takes place in
the
A) primary market.
B) bond market.
C) secondary market.
D) bear market.
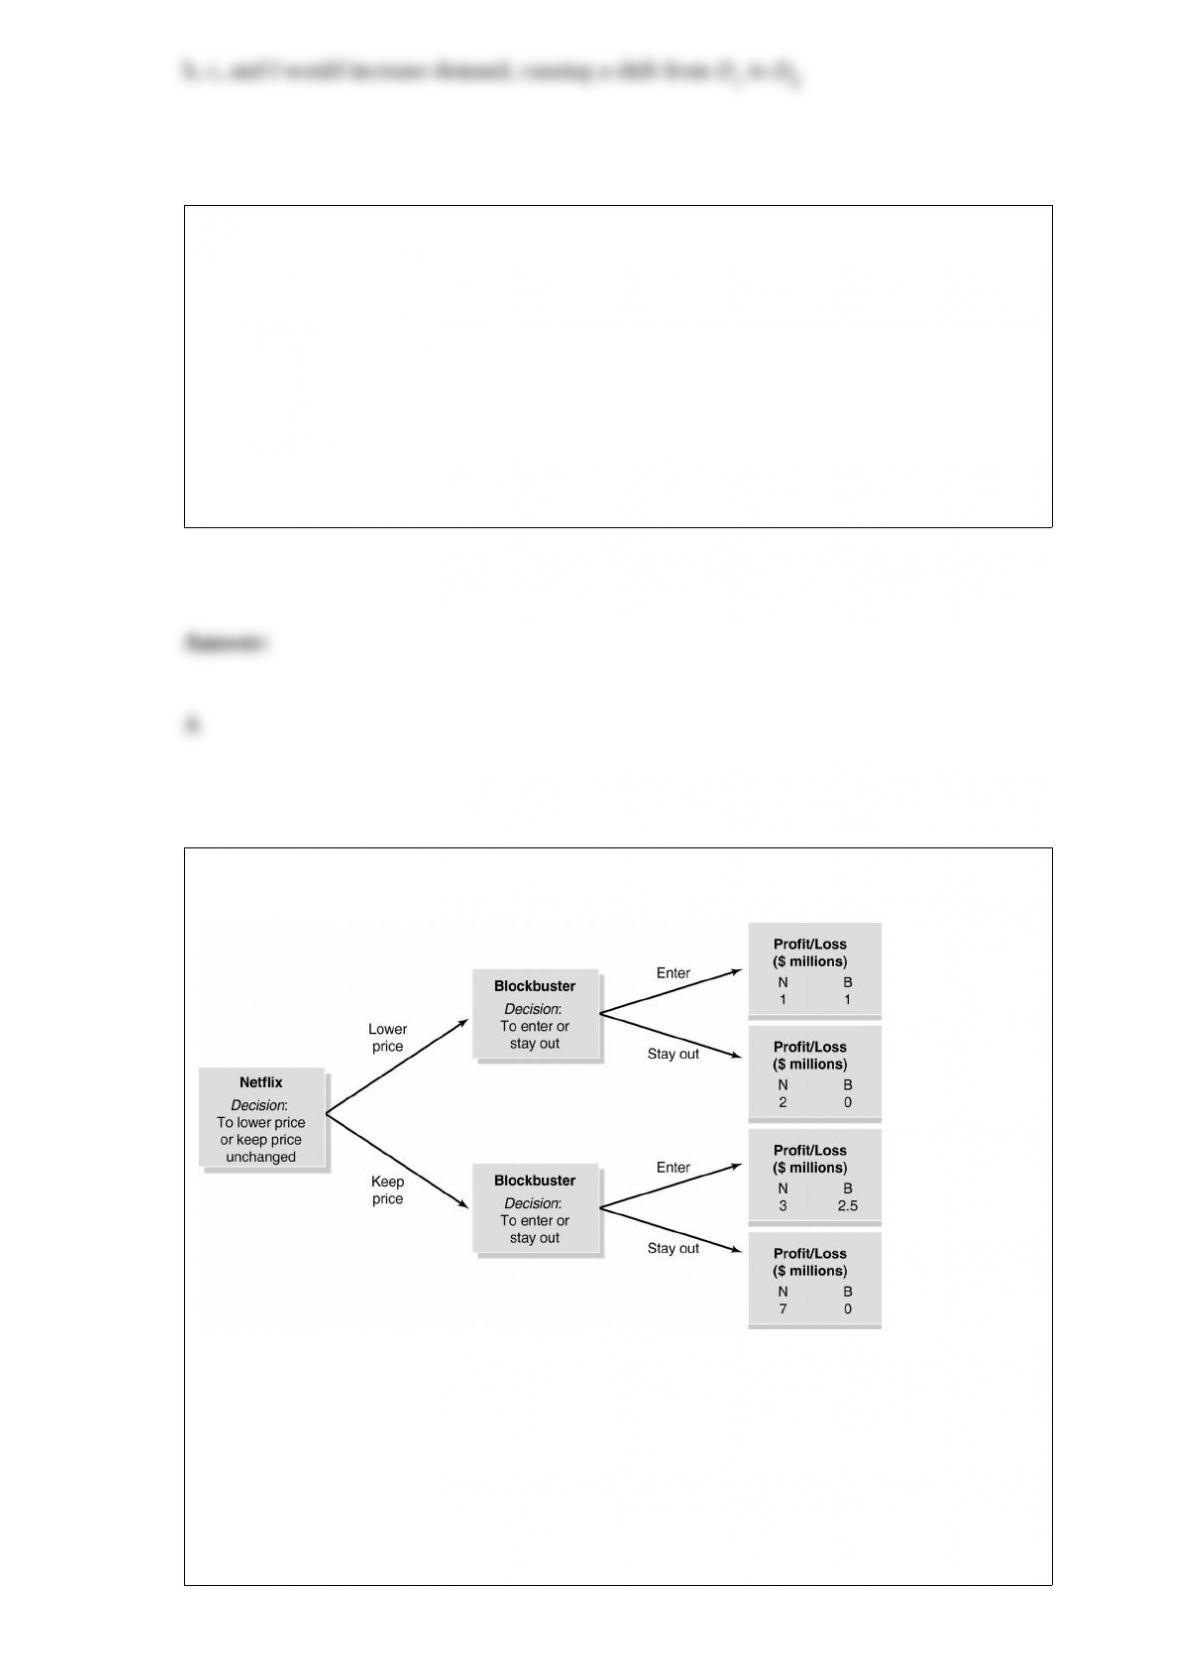
Figure 14-5
A few years
ago Netflix (N) pioneered an online DVD rental service. Blockbuster (B), a brick and
mortar DVD/video rental company, waited until Netflix had been in business for over a
year before deciding whether to establish its own online rental service. At this point,
Netflix had to decide whether or not to lower its subscription price in order to deter
Blockbuster’s entry into the market. Figure 14-5 shows the decision tree for the
Netflix-Blockbuster entry game. Does it make sense for Netflix to lower its price in
order to deter Blockbuster’s entry into the online DVD rental market?

A) Yes, because Netflix stands to make a profit of $7 million by lowering its price and
keeping Blockbuster out of the market.
B) No, because Netflix will make a higher profit by keeping its subscription price
unchanged, whether Blockbuster enters the market or not.
C) Yes, because it is always profitable to remain a monopoly.
D) No, because Blockbuster will enter the market regardless of Netflix’s decision about
its subscription price.
In 2012, which component of GDP had a negative value?
A) consumption
B) investment
C) government spending
D) net exports
Table 8-12

Consider the following data on nominal GDP and real GDP (values are in billions of
dollars): The base year used in calculating real GDP is
A) 2008.
B) 2009.
C) 2010.
D) 2011.
Which of the following is considered a negative supply shock?
A) increasing immigration in the economy causes the labor supply to rise
B) an improvement in technology
C) an increase in unemployment
D) an unexpected decrease in the refining capacity for oil
Which of the following best illustrates the free rider problem?
A) Since no one owns elephants and elephants are valued for their hide, meat and ivory,
elephants can be hunted to extinction.

B) For every purchase of a $30 fare card, you are entitled to five free bus rides.
C) If your neighbors professionally landscape their front yards, it is likely that the
market value of your property will increase.
D) All three homeowners in a quiet cul-de-sac have expressed the desirability of
security lighting in the common parking area. One of the homeowners installs the
lighting and asks you to contribute toward the cost. You choose not to contribute.