
El Niño wind patterns affected the weather across the United States during the winter of
1997″1998. Suppose the demand for home heating oil in Connecticut is given by Q =
20 ” 2Phho + 0.5Png ” TEMP, where Q is the quantity of home heating oil demanded,
Phho is the price of home heating oil per unit, Png is the price of natural gas per unit,
and TEMP is the absolute difference between the average winter temperature over the
past 10 years and the current average winter temperature. If the current price of home
heating oil is $1.20, the current price of natural gas is $2.00, and the average winter
temperature this year is 40 degrees compared to 28 degrees over the past 10 years, the
TEMP variable tells us that:
a. each 1-degree increase in temperature over the normal average raises home heating
oil sales by 1 unit.
b. each 1-degree increase in temperature over the normal average lowers home heating
oil sales by 1 unit.
c. the average daily temperature has no impact on the sales of home heating oil.
d. the average daily temperature has an impact only on the sales of natural gas.
e. price elasticity of demand for home heating oil is 2.
Joe’s T-shirts has costs given by TC = $100 + 3Q, where Q is the number of shirts. If
Joe charges $5 each, the percentage markup for 100 shirts is:
a. 20%.
b. 25%.
c. 33%.
d. 50%.
e. 67%.

In an English auction:
a. the dominant strategy is to bid up to your reservation price.
b. the dominant strategy is to bid beyond your reservation price.
c. there is no dominant strategy.
d. the dominant strategy is to bid up to half of your reservation price.
e. the dominant strategy is to maximize expected utility.
For a producer of joint products X and Y with total costs CX and CY, an isocost curve:
a. isolates CX and CY separately.
b. shows points where CX = CY .
c. shows points where cost curves are tangent.
d. shows points where CX /CY is constant.
e. shows points where CX + CY is constant.

The marginal product of labor can be illustrated geometrically as the:
a. slope of the total product curve with respect to labor.
b. slope of the total product curve with respect to capital.
c. slope of a chord from the origin out to the total product curve at the specified level of
labor.
d. inverse of the slope of a chord from the origin out to the total product curve at the
specified level of labor.
e. slope of the total product curve with respect to labor divided by the slope of the total
product curve with respect to capital.
If output is produced according to Q = 3K + 4L, then this production process exhibits:
a. increasing returns to scale.
b. decreasing returns to scale.
c. first increasing and then decreasing returns to scale.
d. constant returns to scale.
e. first decreasing and then increasing returns to scale.

Two local ready-mix cement manufacturers, Here and There, have combined demand
given by Q = 105 ” P. Their total costs are given by TCHere = 5QHere + 0.5Q2
Here and
TCThere = 5QThere + 0.5Q2
There. If they cannot successfully collude and instead produce
where the market price equals marginal cost, their total output will be:
a. 50.
b. 60.
c. 66.67.
d. 75.
e. 85.
What is the optimal strategy in a second-price, sealed-bid auction?
a. Bid an amount that is equal to your reservation price.
b. Bid an amount that is greater than your reservation price because you will be paying
the second-highest bid if you win.
c. Bid an amount that is less than your reservation price.
d. Bid an amount that is less than your reservation price, depending on the number of
bidders.
e. If there are fewer than five bidders, bid below your reservation price. Otherwise, bid
your reservation price.

If a firm supplies separable markets with price elasticities h1 and h2, it should set prices
P1 and P2 so that:
a. P1h1 = P2h2.
b. P1 /h1 = P2 /h2.
c. P1(1 + 1/h1) = P2 (1 + 1/h2).
d. P1/(1 ” 1 /h1) = P2 / (1 ” 1/h2).
e. P1 = 1 ” 1/h1 and P2 = 1 ” 1/h2.
Thelma is indifferent between $100 and a bet with a 0.6 chance of no return and a 0.4
chance of $200. If U(0) = 20 and U(200) = 220, then U(100) = :
a. 88
b. 94
c. 100
d. 110
e. 132

If there are 10 equal-sized firms in an industry, the Herfindahl-Hirschman index would
be:
a. 1,000
b. 100
c. 10,000
d. 10
e. 1
A producer of fixed proportion goods X and Y (Q = QX = QY) has marginal costs and
revenues of MC = 12Q, MRX = 54 ” 6QX, MRY = 126 ” 12QY. The producer should
produce how many units?
a. 3.
b. 5.25.
c. 6.
d. 8.25.
e. 10.

A consumer buys 12 units of entertainment and 84 units of “all other things.” The
consumer’s income elasticity of demand is greater than 1 for entertainment and less than
1 for all other things. If income increases by 10%, then the consumer’s marginal rate of
substitution at the utility-maximizing market bundle will:
a. increase.
b. decrease.
c. be equal to 1.
d. remain constant.
e. There is insufficient information to answer the question.
In a Dutch auction:
a. the dominant strategy is to bid up to your reservation price.
b. the dominant strategy is to bid beyond your reservation price.
c. there is no dominant strategy.
d. the dominant strategy is to bid up to half of your reservation price.
e. the dominant strategy is to maximize expected utility.

If C is total cost, Q is quantity, P is price, and A is total assets, the target return r is
defined by:
a. (PQ ” C)/A.
b. [1 ” (P ” C)/Q]A.
c. [1 ” (P ” C)Q]A.
d. (P ” C)Q/A.
e. 1 ” (P ” C)Q/A.
If a firm uses optimal transfer pricing between production division A and marketing
division B, and a competitive external market for the output of division A exists, then
production division A will surely:
a. make positive economic profits.
b. make normal economic profits.
c. sell at marginal costs.
d. sell at the external price.
e. sell at less than the external price.

The major disadvantage of rate regulation of natural monopolies is that:
a. natural monopolists spend too much time lobbying for higher rates.
b. unlike a competitive firm, the natural monopoly has too much incentive to increase
efficiency.
c. the regulatory bureaucracy grinds slowly and generates regulatory lags.
d. state public service commissions are poorly staffed and supervised.
e. natural monopolists spend too much money on philanthropic activities.
The demand for personal computers has been estimated to be Q = 500,000 ” 700P +
200I ” 500S. Assume that per capita income I is $13,000 and the average price of
software S is $400. When the price of personal computers is P = $3,000, the price
elasticity of demand is:
a. “2.625.
b. “7.0.
c. “1.0.
d. “21.0.
e. “4.25.

Relative to the posted-price selling mechanism, an auction market will provide:
a. more surplus to the market.
b. more consumer surplus and less producer surplus to the market.
c. more producer surplus and less consumer surplus to the market.
d. less surplus to the market.
e. no change in the allocation of consumer and producer surplus to the market.
You borrow money from Fast Eddie’s Fast Cash at 20% per year interest and agree to
pay $500 at the end of each of the next four years. You must have borrowed
approximately:
a. $2,000.
b. $1,595.
c. $1,295.
d. $1,095.
e. $895.
In managerial economics, managers are assumed to maximize:

a. current profits.
b. their take-home pay.
c. their employees’ welfare.
d. the value of their firm.
e. social welfare.
The weekly total cost of baking pies at Tasty Tortes is given by TC = 0.01Q1.5. Tasty’s
marginal cost of producing 10,000 pies a week is:
a. $1.00.
b. $1.50.
c. $2.00.
d. $2.50.
e. $4.50.
Cereal manufacturers’ use of coupons can be partially explained by:
a. first-degree price discrimination.

b. second-degree price discrimination.
c. third-degree price discrimination.
d. markup pricing.
e. tying.
An example of implicit costs is the:
a. bad-debt liabilities arising out of excessive sales on credit.
b. wages paid to the owners’ children.
c. opportunity cost of owner-supplied capital and labor that is not recognized by
accountants.
d. prices paid for purchased inputs.
e. the alternative uses for money that could be borrowed.
A regression of exports as a function of imports in 1991 across industry types yielded
exports = 68 ” 0.3(imports), R2 = .25, Prob > F = .26, and RMSE = 30. If imports by an
industry equal 60, what is the estimate of exports from this industry, and how confident
are you of your estimate?
a. Exportsestimated = 50, variation in imports explains 25% of variation in exports, and
the F-test statistic is high, so we are confident in our estimate of exports.
b. Exportsestimated = 86, variation in imports explains 25% of variation in exports, and
the F-test statistic is high, so we are confident in our estimate of exports.
c. Exportsestimated = 50, variation in exports explains 25% of variation in imports, and
the F-test statistic is high, so we are confident in our estimate of exports.
d. Exportsestimated = 86, variation in exports explains 25% of variation in imports, and
the F-test statistic is high, so we are confident in our estimate of exports.
e. Exportsestimated = 50, but the F-test statistic fails standard significance tests and the
RMSE is large relative to estimated exports, so we are not confident in our estimate.
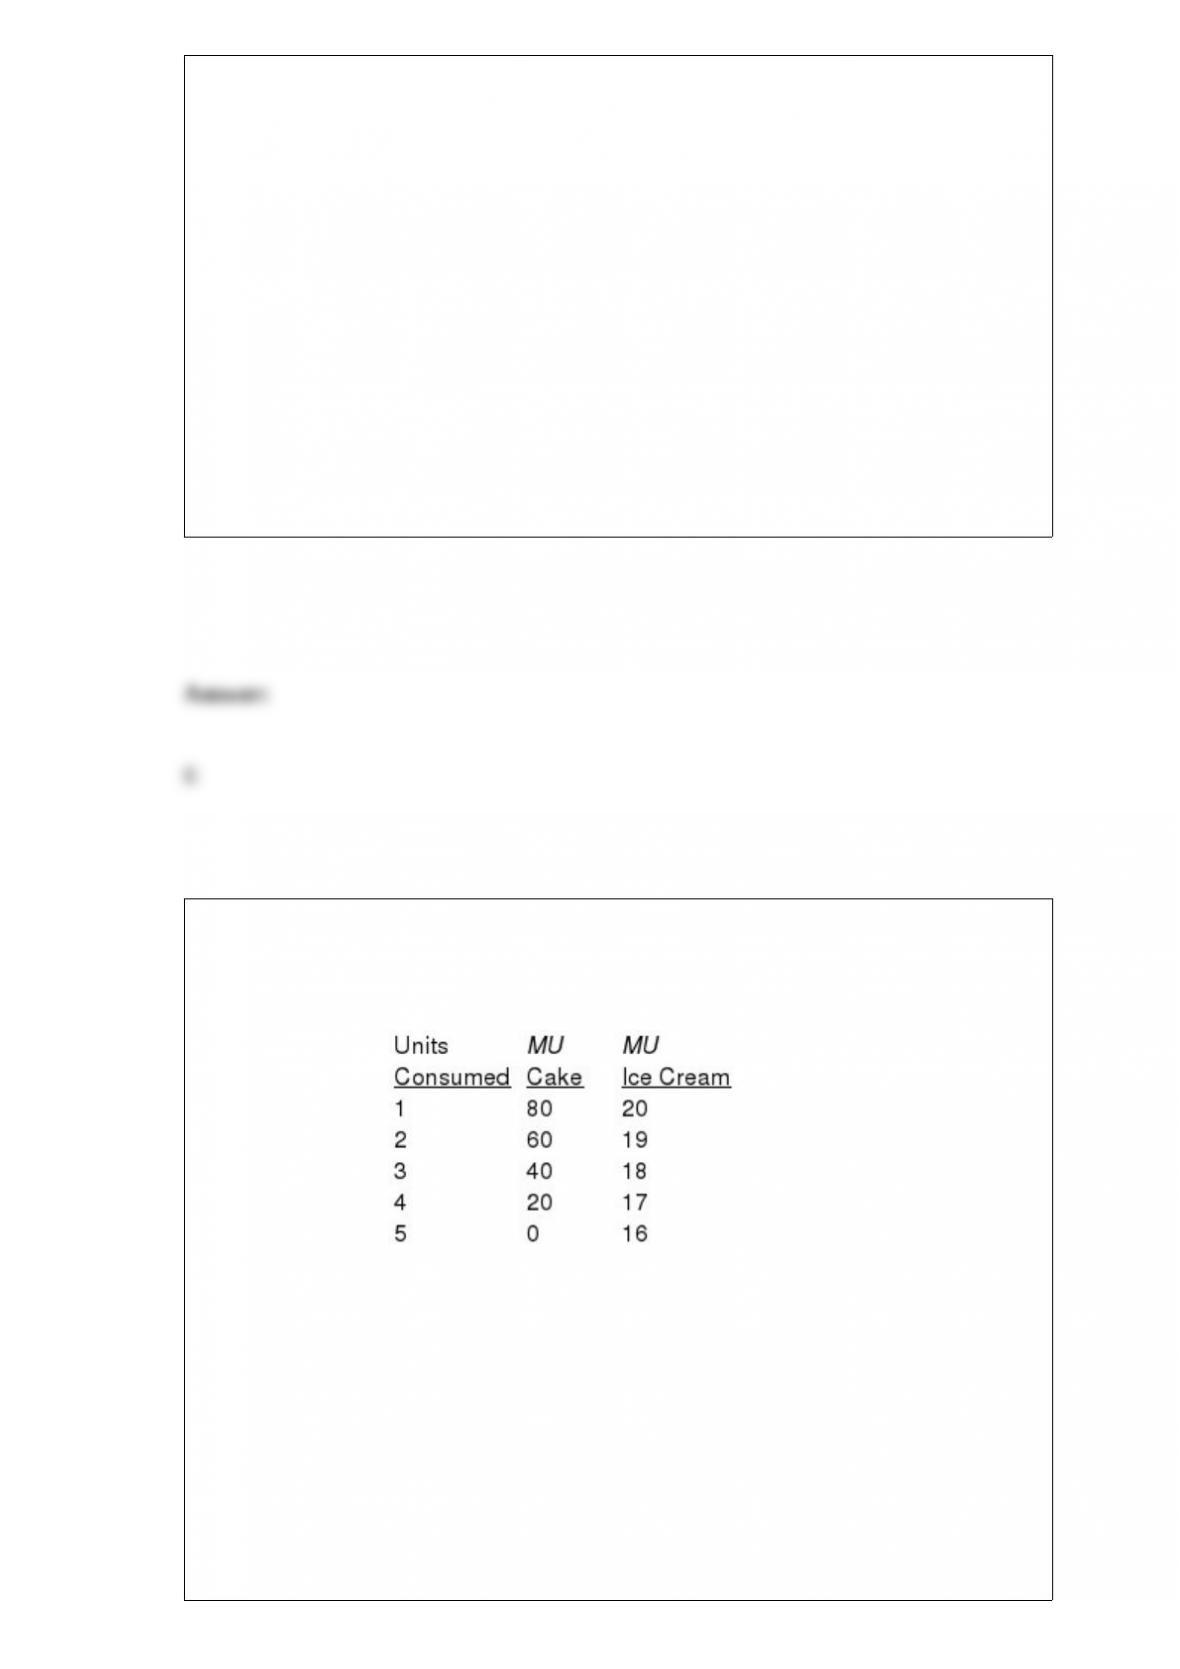
The following table describes Ben’s preferences over cake and ice cream. The utility
from consumption of one good is independent of the consumption of the other. The
price of cake is $10 per unit, and the price of ice cream is $4 per unit.
Ben’s total utility at his optimal consumption bundle will be:
a. 56.
b. 200.
c. 270.
d. 310.

e. none of the above.
Whenever marginal product is positive and declining with increasing use of an input:
a. total product is declining as input use increases.
b. average product is declining as input use increases.
c. marginal product is greater than average product.
d. marginal product is less than average product.
e. total product is increasing at a decreasing rate as input use increases.
Play It Again Sam is a producer of high-end CD burners. It requires customers to
purchase high-quality blank CDs from it in order to maintain warranty agreements. This
is an example of a:
a. bundle.
b. two-part tariff.
c. tying contract.
d. transfer price.
e. joint product.

The coefficient of determination from a regression represents the:
a. proportion of variation in the dependent variable explained by variation in the
independent variables.
b. proportion of variation in the independent variables explained by variation in the
dependent variable.
c. variation in the dependent variable.
d. proportion of the variation in the dependent variable.
e. proportion of the variation in the independent variable.
Tying can sometimes be justified as helping consumers by:
a. brand-name quality protection.
b. different consumer evaluations of the main good.
c. transportation costs.
d. standard industry practice.
e. offsetting price reductions in the main good.

If a firm supplies separable markets with price elasticities h1 = “3 and h2 = “2, it should
set prices P1 and P2 so that:
a. P1 = P2.
b. 3P1 = 2P2.
c. 2P1 = 3P2.
d. 2/3P1 = 1/2P2.
e. 2P1 = 2/3P2.
If the demand increases for the product of an increasing-cost industry:
a. short-run price goes up, but long-run price falls.
b. long-run output goes up, but long-run price may go up or down.
c. short-run output goes up, but long-run output may go up or down.
d. long-run output goes up, but short-run price remains constant.
e. short-run price goes up, and long-run price goes up.

Expected utility is:
a. the profit from a given decision.
b. a probability weighted average of possible profits.
c. an evenly weighted average of possibility profits.
d. a probability weighted average of possible utility levels.
e. the expected profits plus a number that depends on risk.
Strategic foresight is the ability to make decisions today that are rational based on:
a. complete uncertainty about the future.
b. our best information about what will happen in the future.
c. what we know only about behavior in the past.
d. information that we have only about our own behavior in the past.
e. incorrect information about the past.
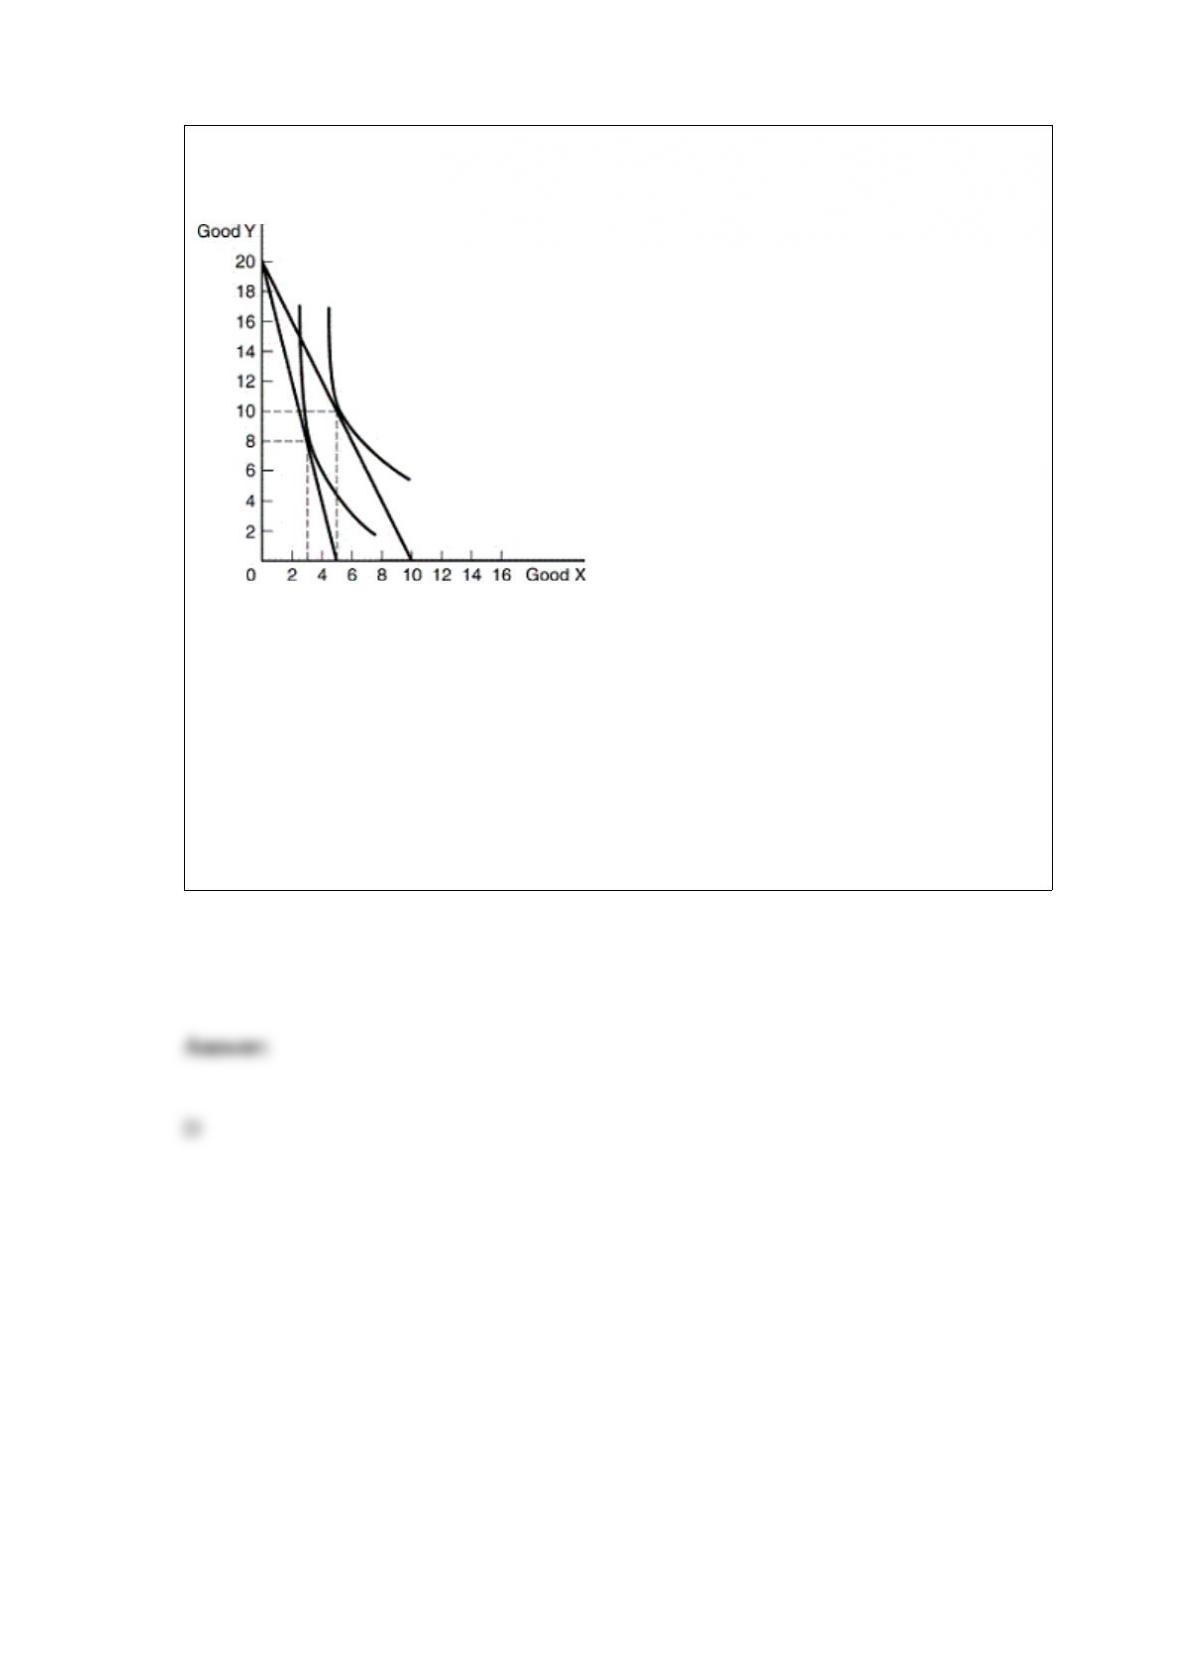
Consider the following indifference map. The price of Y is $5. Two points on a demand
curve for good X are:
a. (8, $5) and (10, $5).
b. (3, $10) and (5, $20).
c. (3, $20) and (8, $5).
d. (3, $20) and (5, $10).
e. none of the above.