Unlock document.
This document is partially blurred.
Unlock all pages and 1 million more documents.
Get Access
The certainty equivalent is the certain dollar amount a risk-averse decision maker
would accept in order to avoid a gamble altogether.
The adjusted R2 is used primarily to monitor whether extra explanatory variables really
belong in a multiple regression model
NARRBEGIN: SA_104_112
Mrs. Rich has just bought a new $30,000 car. As a reasonably safe driver, she believes
that there is only a 5% chance of being in an accident in the forthcoming year. If she is
involved in an accident, the damage to her new car depends on the severity of the
accident. The probability distribution for the range of possible accidents and the
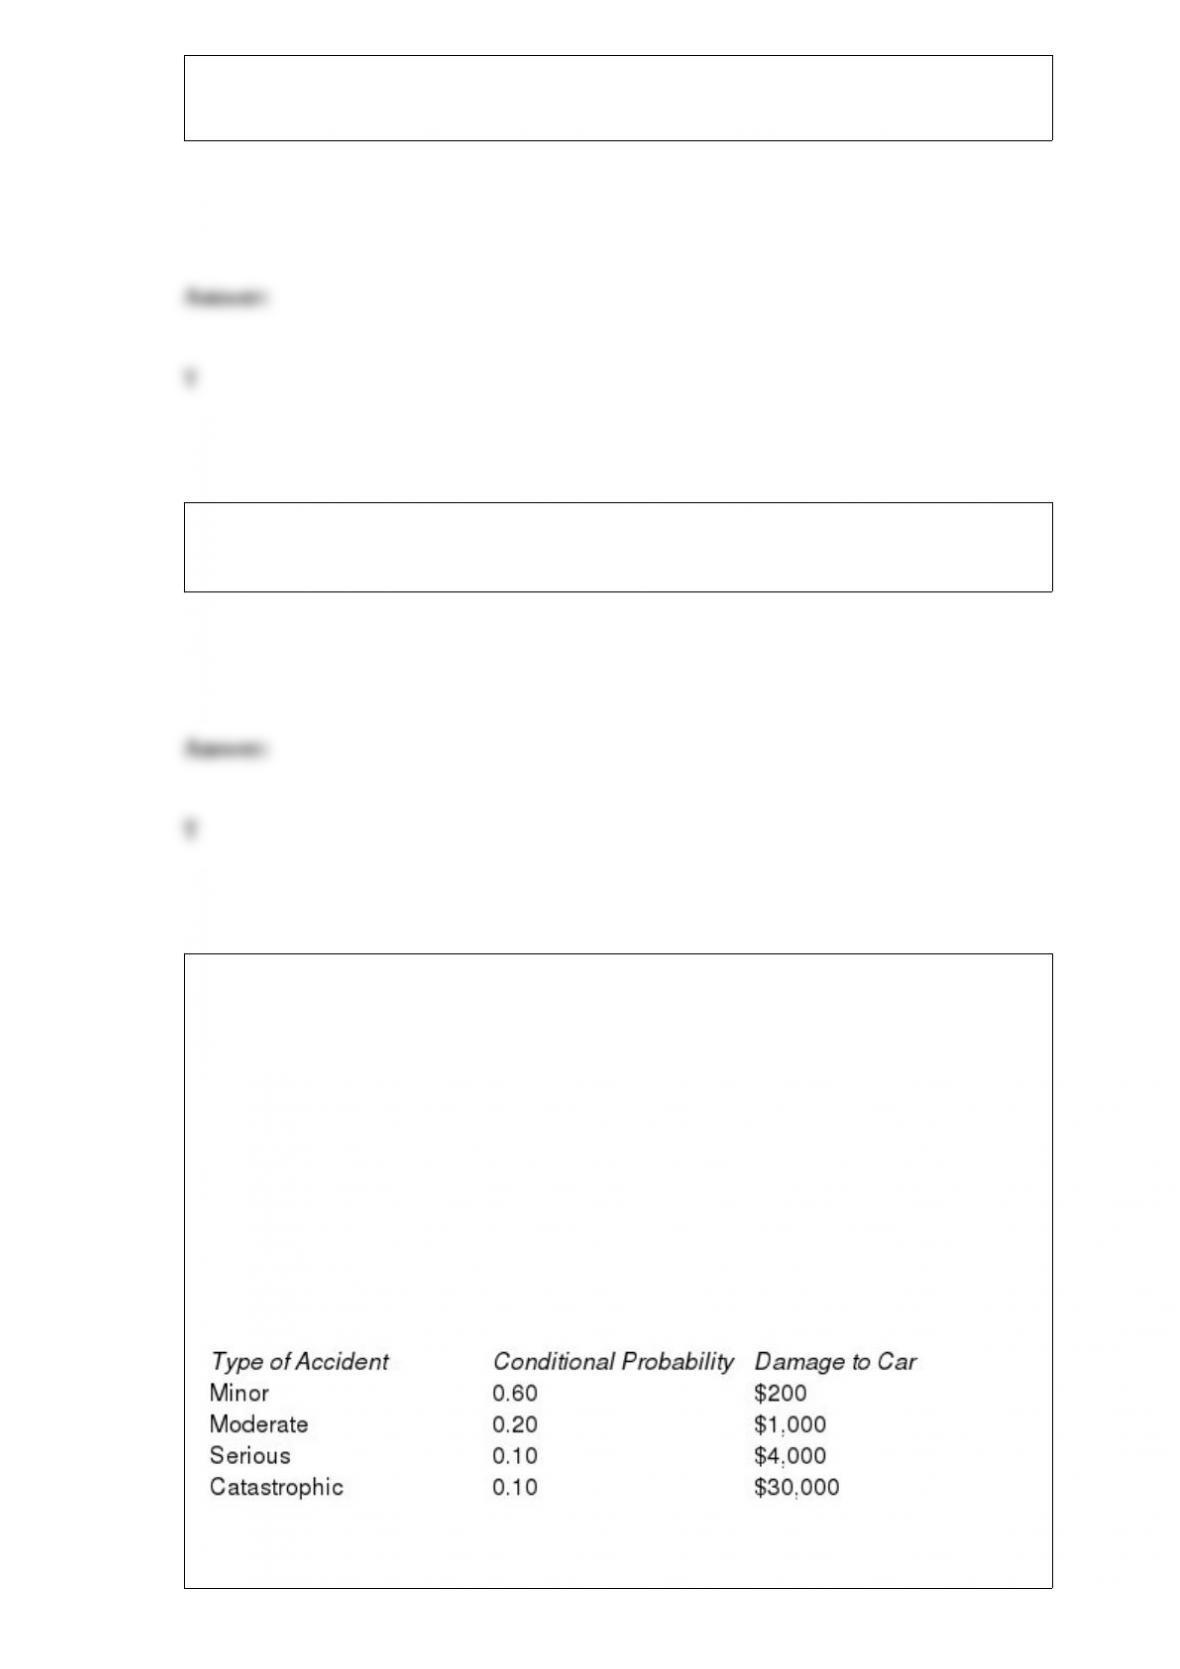
corresponding damage amounts (in dollars) are shown in the table below. Mrs. Rich is
trying to decide whether she is willing to pay $170 each year for collision insurance
with a $300 deductible. Note that with this type of insurance, she pays the first $300 in
damages if she causes an accident, and the insurance company pays the remainder.
Distribution of Accident Types and Corresponding Damage Amounts
NARREND
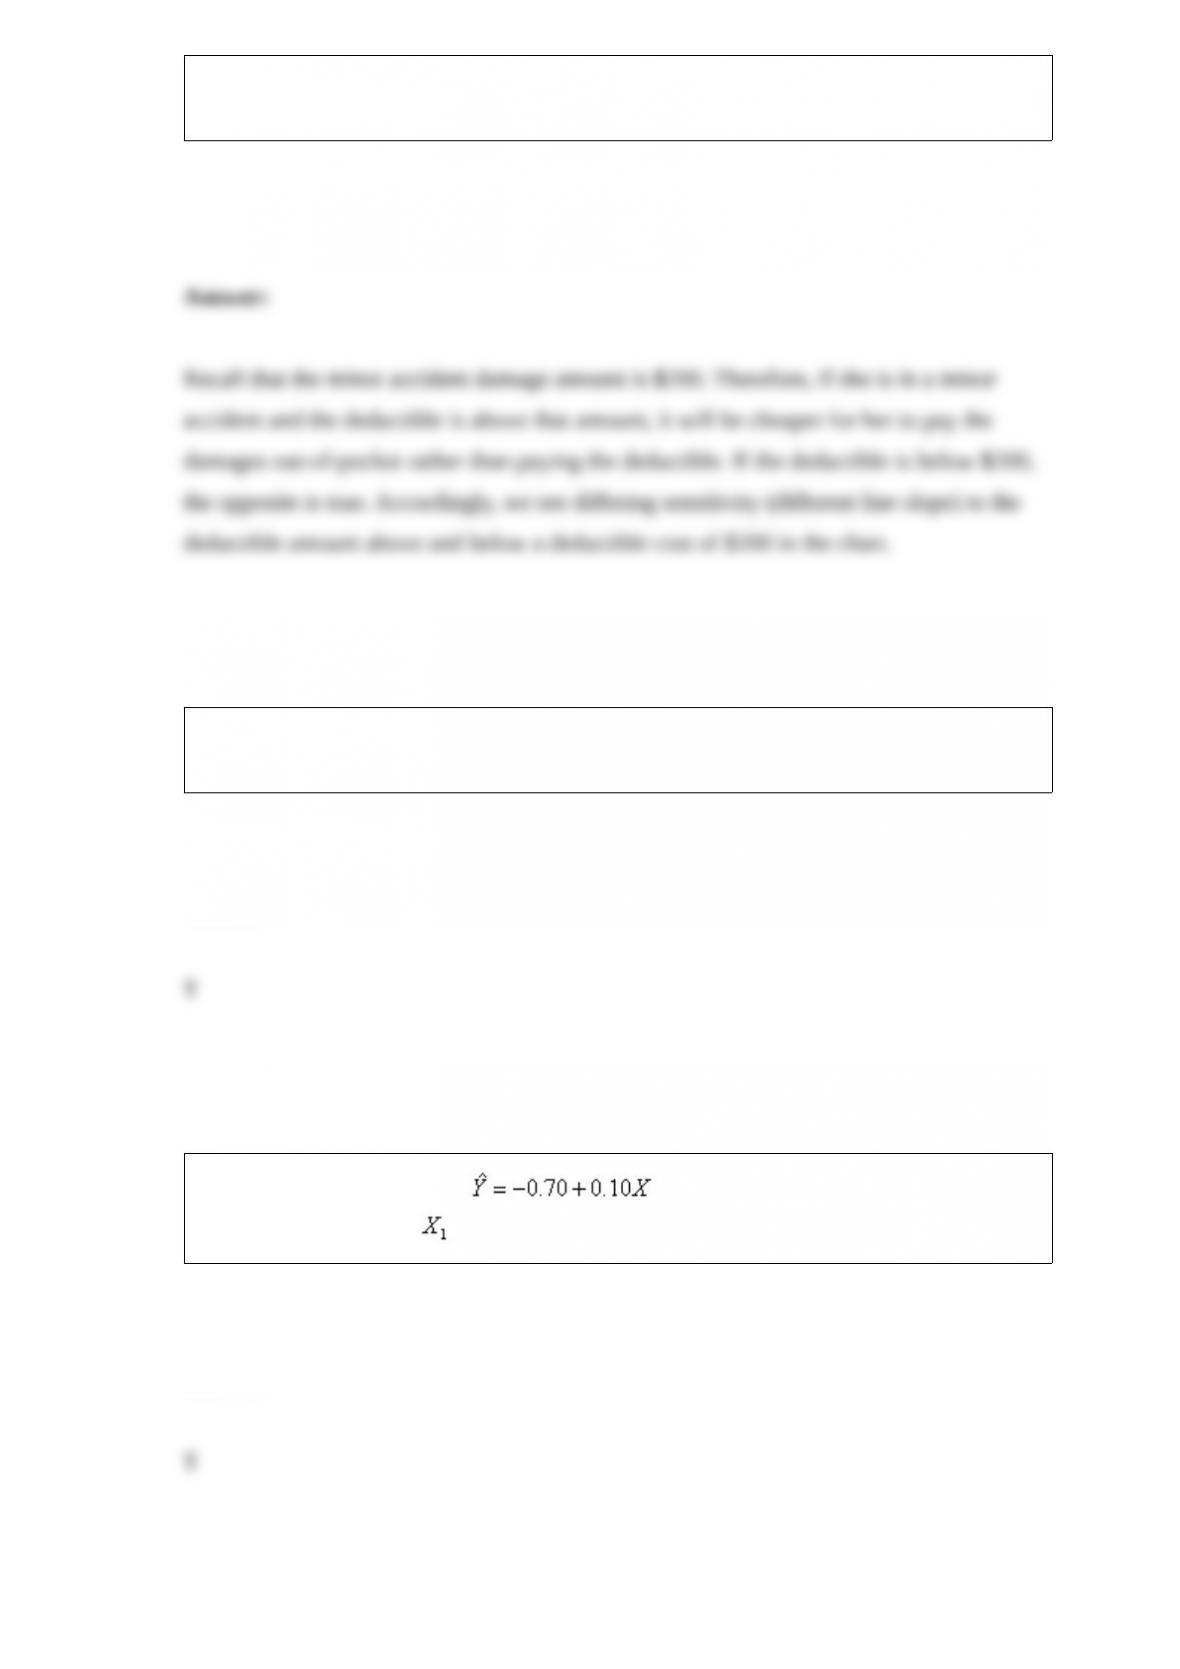
Why is there a kink in the line for the "Buy Insurance" line in the above strategy region
chart?
Every form of exponential smoothing model has at least one smoothing constant, which
is always between 0 and 1.
In reference to the equation, , the value 0.10 is the expected change
in Y per unit change in .
We do not even try to interpret correlations numerically except possibly to check
whether they are positive or negative
The mean of the sampling distribution of the sample proportion , when the sample
size n = 100 and the population proportion p = 0.15, is 15.0.
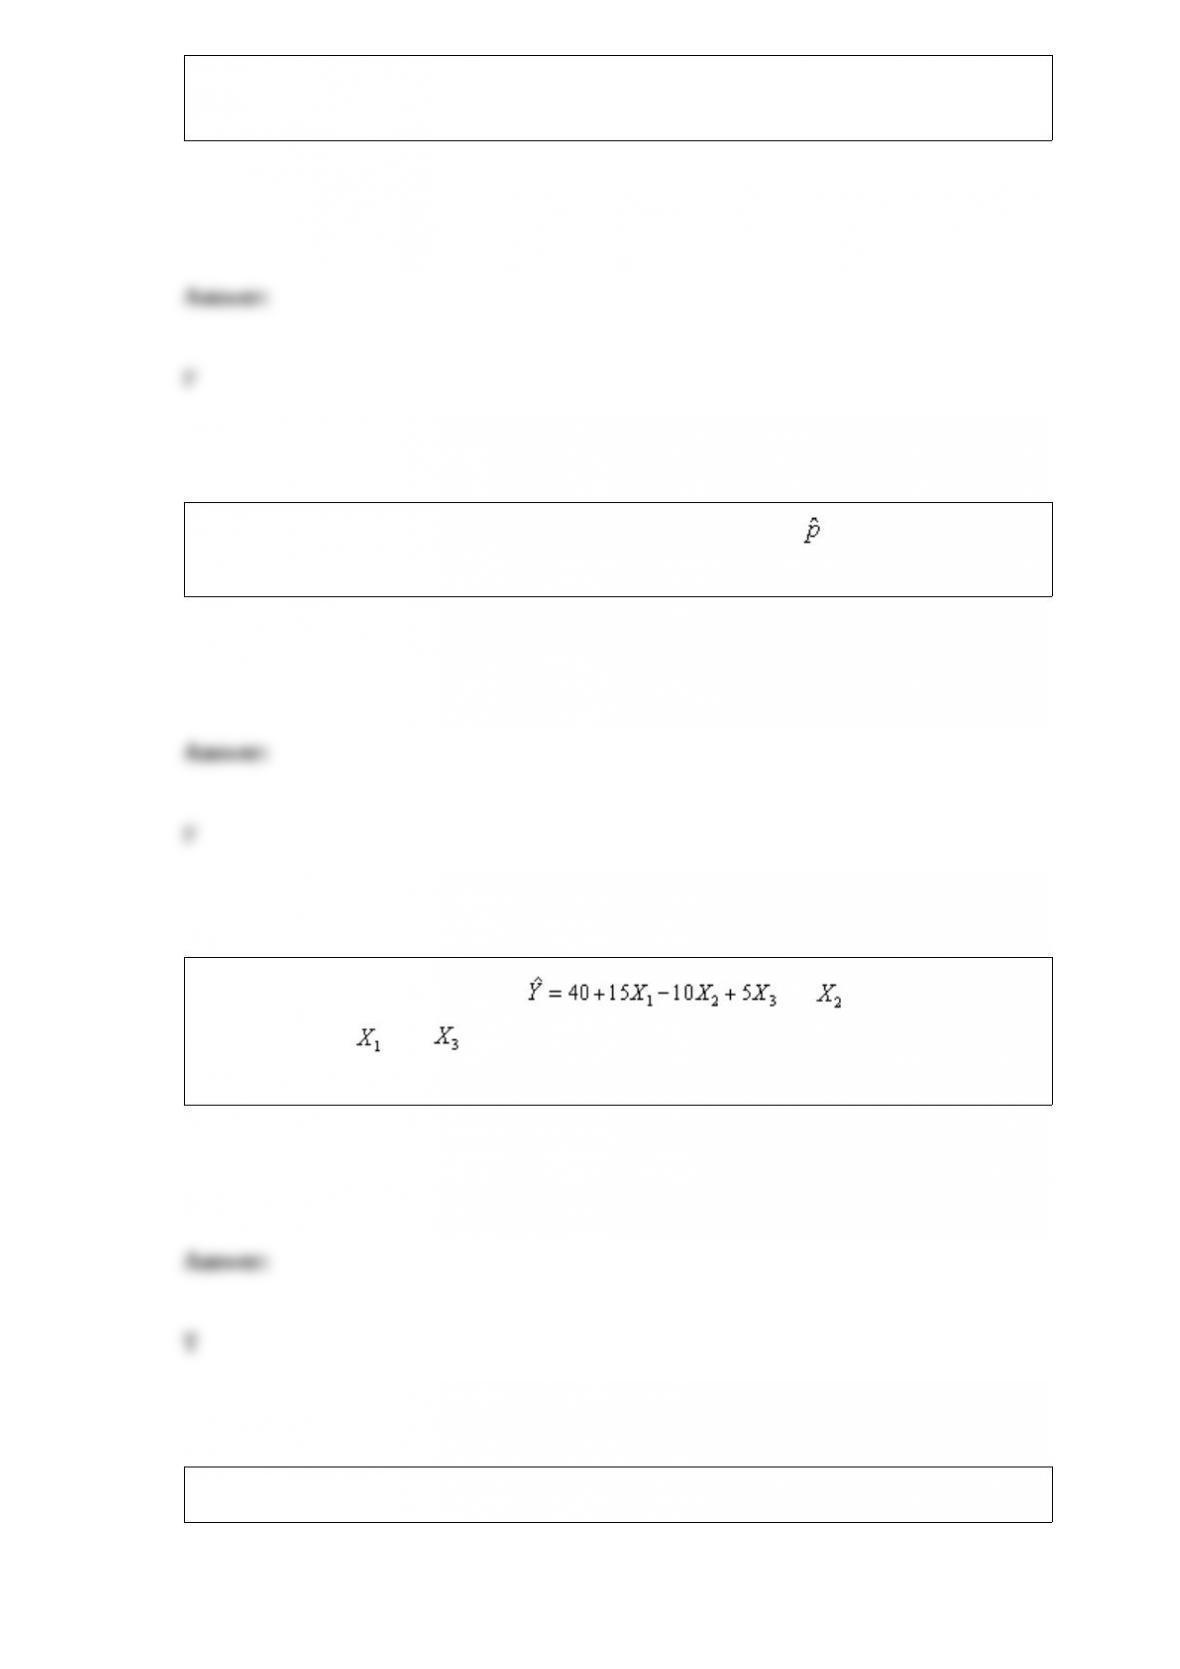
For the multiple regression model , if were to increase by
5 units, holding and constant, the value of Y would be expected to decrease by
50 units.
If a solution to an LP problem satisfies all of the constraints, then is must be feasible.

NARRBEGIN: SA_91_103
A sample of 1000 households was selected in Los Angeles to determine information
concerning consumer behavior. Among the questions asked was "Do you enjoy
shopping for clothing?" Of 480 males, 272 answered yes. Of 520 females, 448
answered yes.
NARREND
What is the probability that a respondent chosen at random enjoys or does not enjoy
shopping for clothing?
NARRBEGIN: SA_91_103
A sample of 1000 households was selected in Los Angeles to determine information
concerning consumer behavior. Among the questions asked was "Do you enjoy
shopping for clothing?" Of 480 males, 272 answered yes. Of 520 females, 448
answered yes.
NARREND
What is the probability that a respondent chosen at random is a female and enjoys
shopping for clothing?

In a manufacturing setting, a discrete distribution is natural for modeling the number of
days to produce a batch, and a continuous distribution is appropriate for modeling the
yield from a batch.
An exponential trend is appropriate when the time series changes by a constant
percentage each period.
Problems in data analysis where we want to compare a numerical variable across two or
more subpopulations are called comparison problems.
The Central Limit Theorem (CLT) states that the sampling distribution of the mean is
approximately normal, no matter what the distribution of the population, so long as the
sample size is large enough.

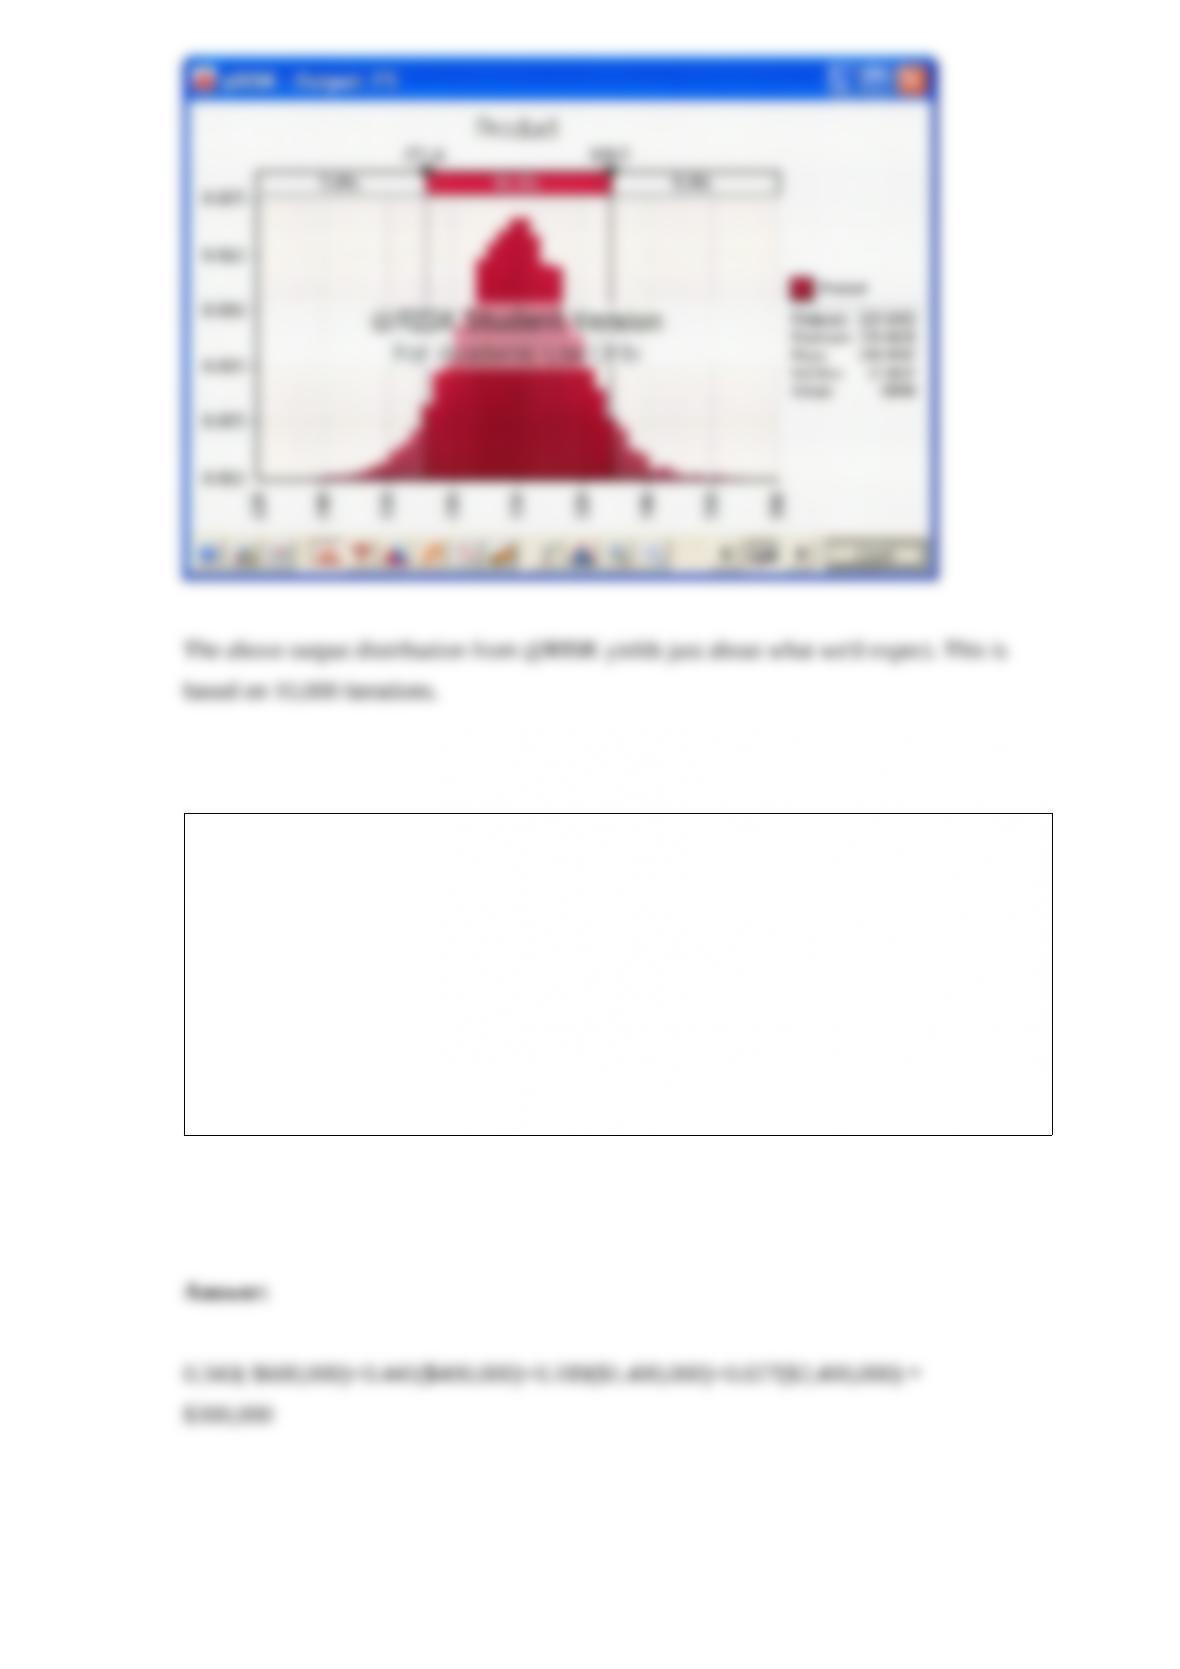
If you add several normally distributed random numbers, the result is normally
distributed, where the mean of the sum is the sum of the individual means, and the
variance of the sum is the sum of the individual variances. This result is difficult to
prove mathematically, but it is easy to demonstrate with simulation. To do so, run a
simulation where you add three normally distributed random numbers, each with mean
100 and standard deviation 10. Your single output variable should be the sum of these
three numbers. Verify with @RISK that the distribution of this output is approximately
normal with mean 300 and variance 300 (hence, standard deviation = 17.32).
NARRBEGIN: SA_113_120
An oil company is planning to drill three exploratory wells in different areas of West
Texas. The company estimates that each of these wells, independent of the others, has
about a 30% chance of being successful.
NARREND
If it costs $200,000 to drill each well and a successful well will produce $1,000,000
worth of oil over its lifetime, what is the expected net value of this three-well program?


