
NARRBEGIN: SA_69_70
A sample of 40 country CD recordings of Willie Nelson has been examined. The
average playing time of these recordings is 51.3 minutes, and the standard deviation is
5.8 minutes.
NARREND
(A) Construct a 95% confidence interval for the mean playing time of all Willie Nelson
recordings.
(B) Interpret the confidence interval you constructed in (A).
NARRBEGIN: SA_76_78
The owner of a pizza restaurant chain would like to predict the sales of her specialty,
the deep-dish Mexican pizza. She has gathered data on monthly sales of the deep-dish
Mexican pizza at her restaurants. She has also gathered information related to the
average price of the deep-dish pizzas, the monthly advertising expenditures and the
disposable income per household in the areas surrounding the restaurants. Below you
will find output from the stepwise regression analysis. The p-value method was used
with a cutoff of 0.05.
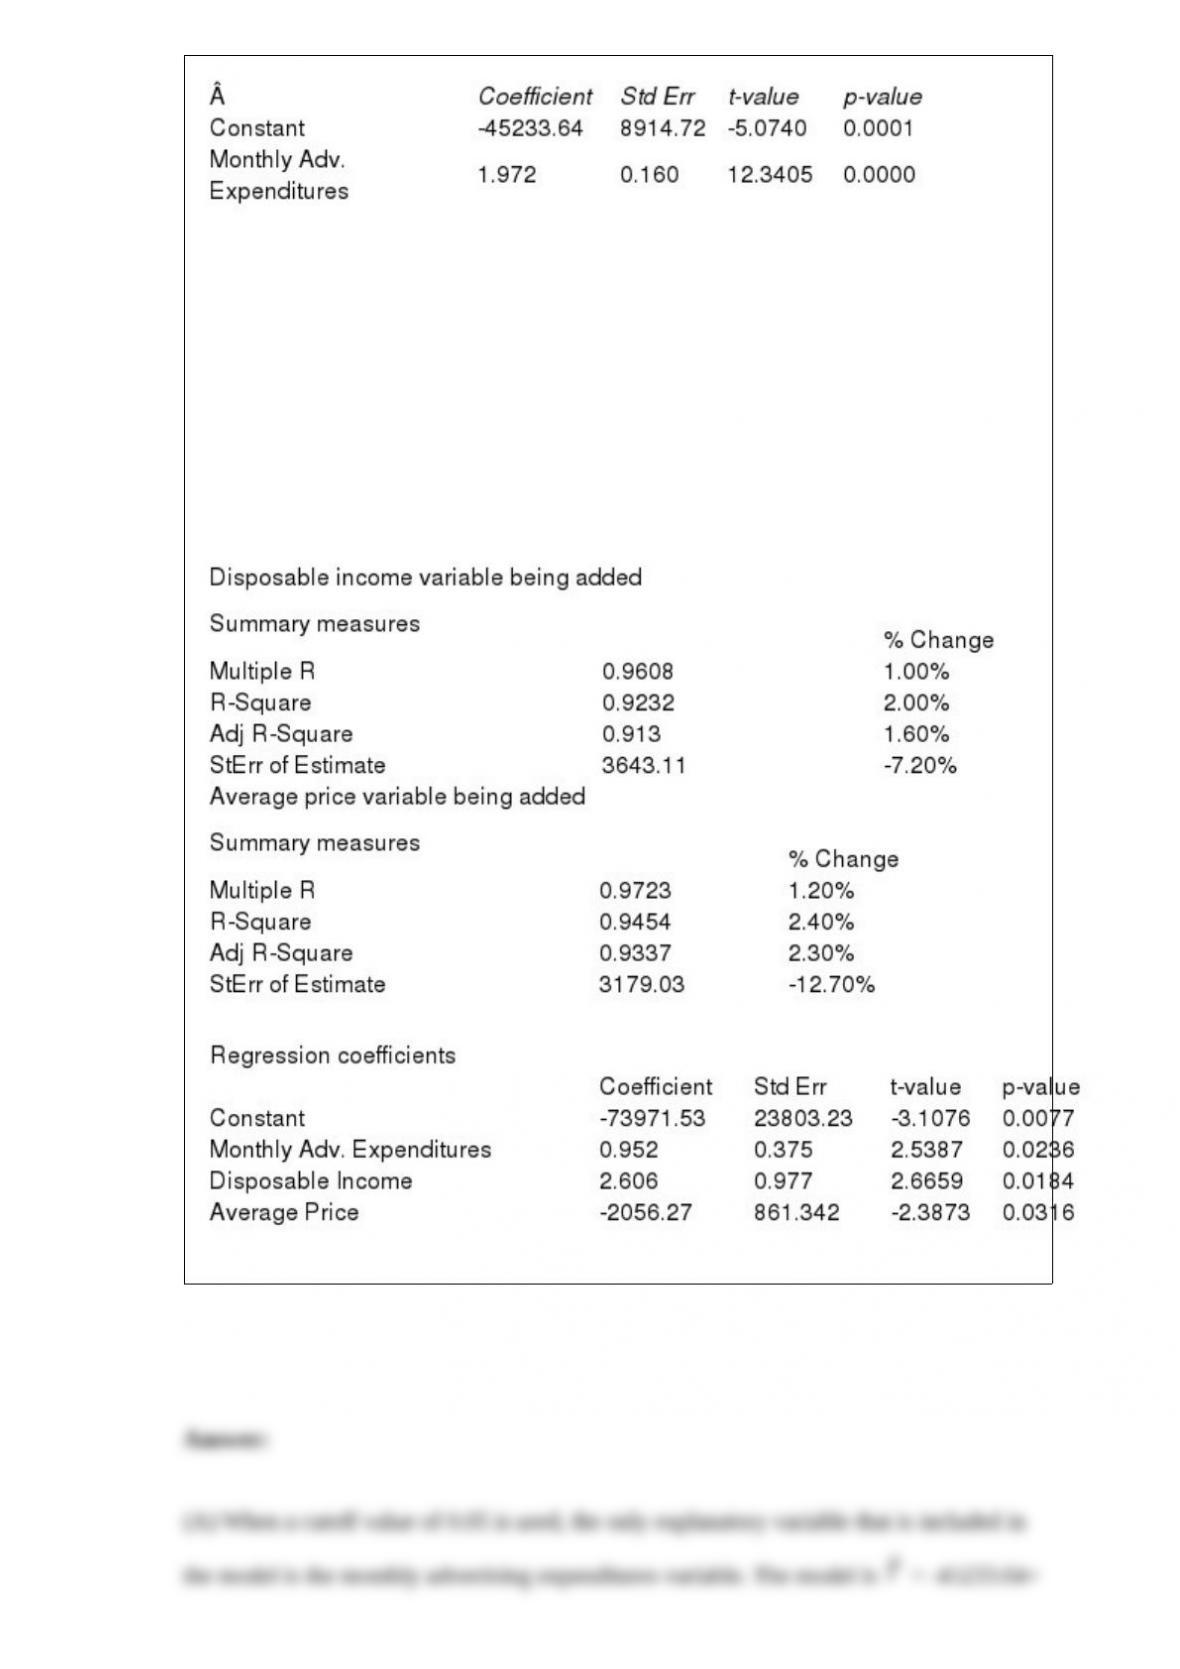
Regression coefficients
NARREND
(A) Summarize the findings of the stepwise regression method using this cutoff value.
(B) When the cutoff value was increased to 0.10, the output below was the result. The
table at top left represents the change when the disposable income variable is added to
the model and the table at top right represents the average price variable being added.
The regression model with both added variables is shown in the bottom table.
Summarize the results for this model.
(C) Which model would you recommend using? Why?

Which of the following are reasons for why simple random sampling is used
infrequently in real applications?
a. Samples can be spread over a large geographic region
b. Simple random sampling requires that all sampling units be identified prior to
sampling
c. Simple random sampling can result in underrepresentation or overrepresentation of
certain segments of the population
d. All of these options

When we replace with the sample standard deviation (s), we introduce a new source
of variability and the sampling distribution becomes the _____.
a. t -distribution
b. F- distribution
c. chi-square distribution
d. normal distribution
If events A and B are mutually exclusive, then the probability of both events occurring
simultaneously is equal to
a. 0.0
b. 0.5
c. 1.0
d. any value between 0.5 and 1.0
There are situations where a set of explanatory variables forms a logical group. The test
to determine whether the extra variables provide enough extra explanatory power to
warrant inclusion in the equation is referred to as the:
a. complete F-test

b. reduced F-test
c. partial F-test
d. reduced t-test
One obvious advantage of stratified sampling is that we obtain separate estimates
within each stratum ” which we would not obtain if we took a simple random sample
from the entire population. A more important advantage is that we can increase the
accuracy of the resulting population estimates by using appropriately defined strata.
Tables used to display counts of a categorical variable are called
a. Crosstabs
b. Contingency tables
c. Both of these options
d. Neither of these options

Scatterplots are also referred to as
a. Crosstabs
b. Contingency charts
c. X-Y charts
d. All of these options
e. None of these options
The decision making process includes
a. optimization techniques for problems with no uncertainty
b. decision analysis for problems with uncertainty
c. sensitivity analysis
d. All of the above

Suppose that a simple exponential smoothing model is used (with = 0.40) to forecast
monthly sandwich sales at a local sandwich shop. The forecasted demand for
September was 1560 and the actual demand was 1480 sandwiches. Given this
information, what would be the forecast number of sandwiches for October?
a. 1480
b. 1528
c. 1560
d. 1592
In some cases, a linear programming problem can be formulated such that the objective
can become infinitely large (for a maximization problem) or infinitely small (for a
minimization problem). This type of problem is said to be:
a. infeasible
b. inconsistent
c. unbounded
d. redundant
The data below represents sales for a particular product. If you were to use the moving
average method with a span of 3 periods, what would be your forecast for period 5?

a. 90
b. 100
c. 105
d. 110
Customer loyalty models are an example of which of the following types of simulation
application?
a. Operations models
b. Financial models
c. Marketing models
d. Games of chance
e. None of these options

Generate a boxplot to summarize the data. What does the boxplot indicate?
In the standardized value , the symbol represents the:
a. mean of
b. variance of
c. standard error of
d. degrees of freedom of
NARRBEGIN: SA_92_96
The owner of a radio station in a rapidly growing community in central Texas is about
to begin operations and must decide what type of program format to offer. She is
considering three formats; rock, country, and rap. The number of listeners for a
particular format will depend on the type of potential audience that is available. Income
from advertising depends on the number of listeners the station has. Three broad
categories of audience type can be described as A1, A2, and A3. The rock music format
draws mainly for the A1 listener, the country music format draws mainly from the A2
listener and the rap music format draws mainly from the A3 listener. The station owner
does not know which type of audience will dominate the community once its growth
has stabilized. Probabilities have been assigned to the potential dominant audience,
based on the community growth that has already occurred in this area. Since she wants
to begin building an image now, the decision as to which format to adopt must be made
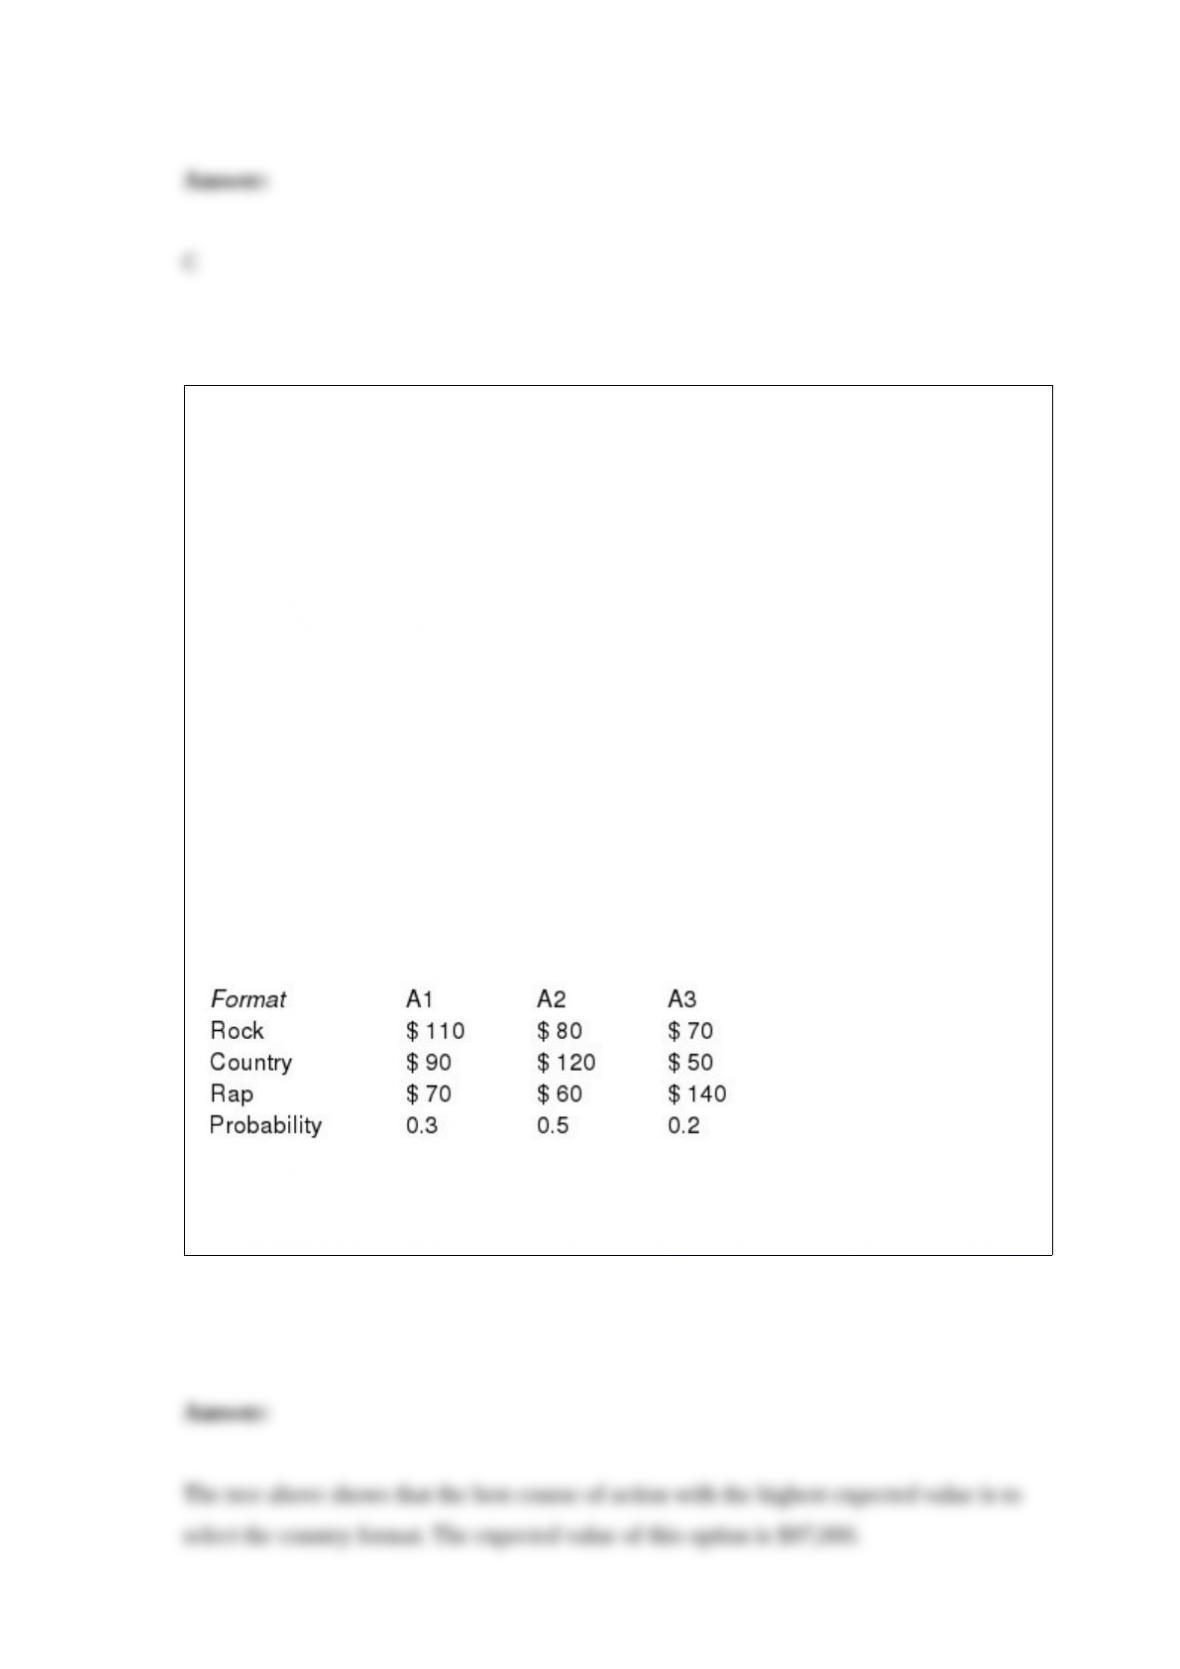
in an environment of uncertainty. The station owner has been able to construct the
following payoff table, in which the entries are average monthly revenue in thousands
of dollars.
Audience
NARREND
What format is optimal? What is the expected profit in that case?

(A) What is the expected completion time (in months) from now for this project?
(B) How much variability (in months) exists around the expected value found in (A)?
In the nomenclature of Bayes’ Rule, which of the following are probabilities that are
conditioned on information that is obtained?
a. Prior probabilities
b. Posterior probabilities
c. Marginal probabilities
d. Objective probabilities
e. Subjective probabilities
NARRBEGIN: SA_71_73
It is surprising (but true) that if 23 randomly selected people are in the same room, there
is about a 50% chance that at least two people will have the same birthday. Suppose you
want to estimate the probability that if 30 people are in the same room, at least two of

them will have the same birthday. You can proceed as follows:
NARREND
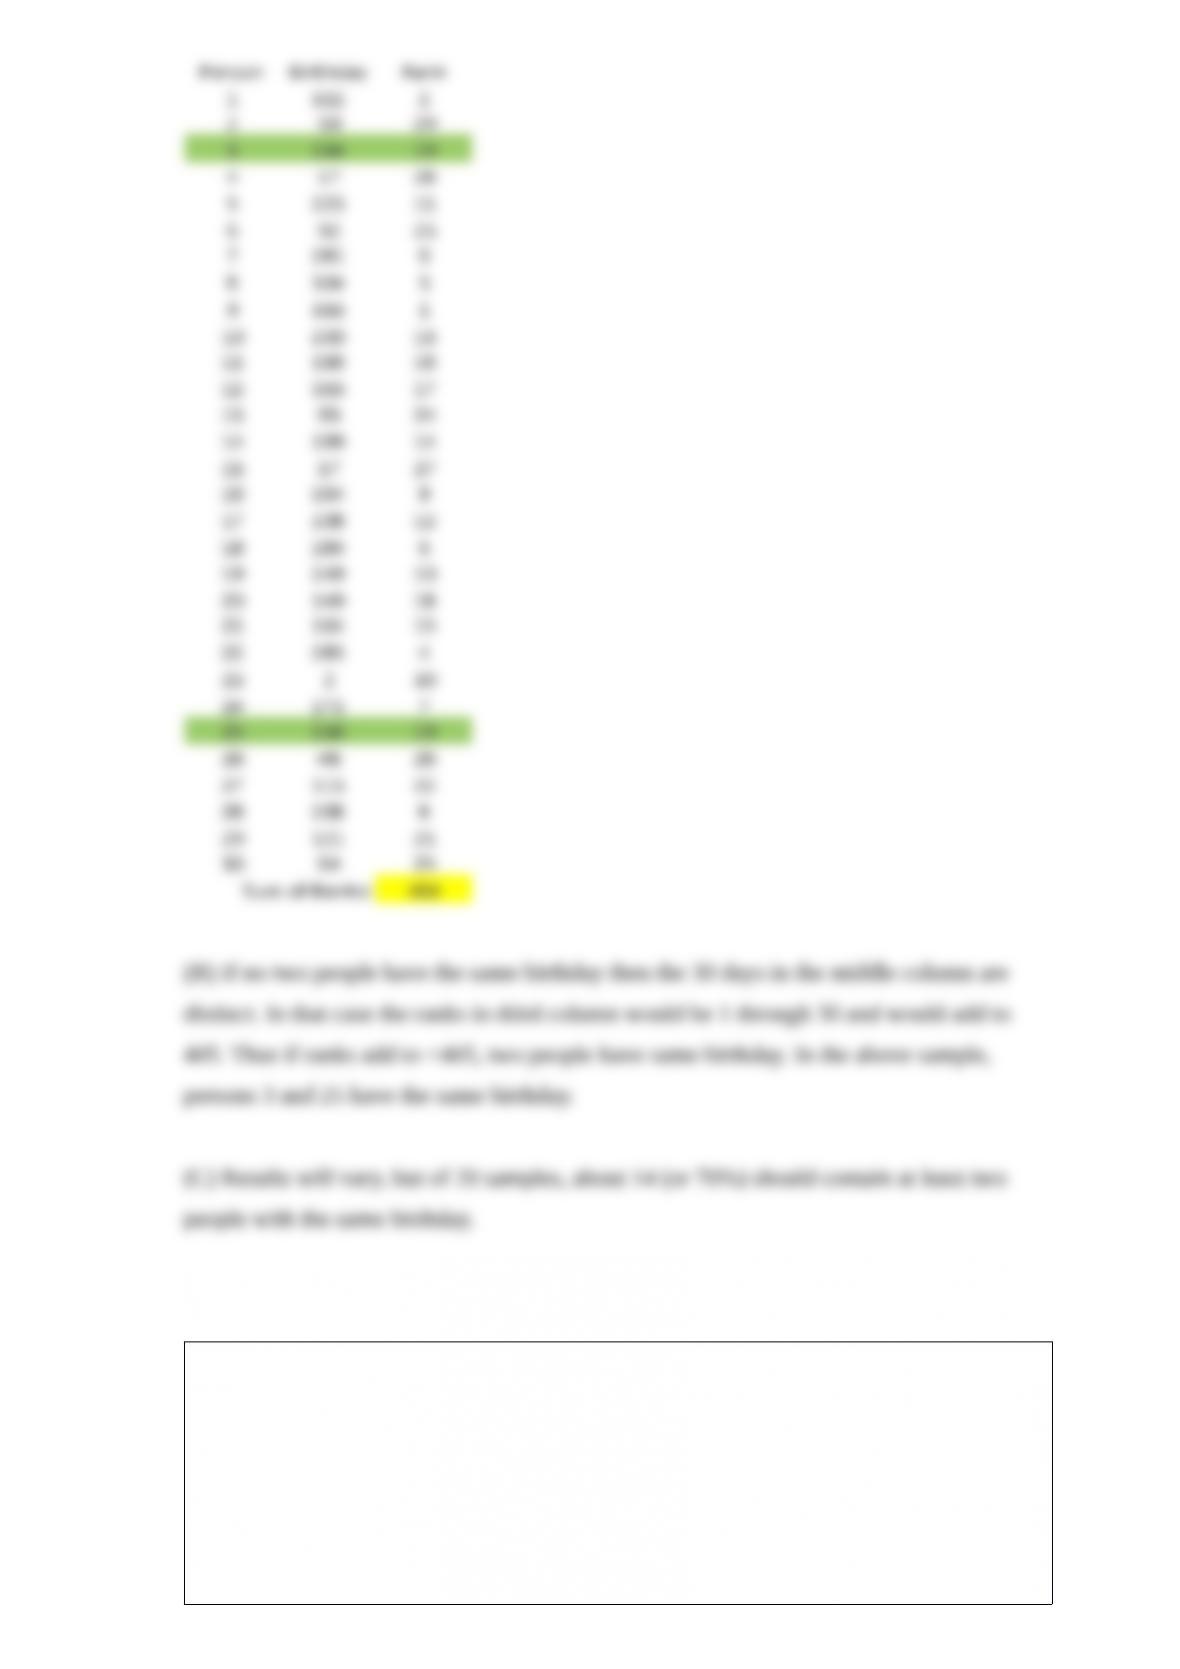
(A) Generate the “birthdays” of 30 different people, assuming that each person has a
1/365 chance of having a given birthday (call the days of the year 1, 2, 3, ……..,365).
You can use a formula involving the INT and RAND functions to generate birthdays.
(B) Once you have generated 30 people’s birthdays, you can tell whether at least two
people have the same birthday using Excel’s RANK function (i.e., in the case of a tie,
two numbers are given the same rank). Do you see any people with the same birthday in
your sample?
(C) Obtain at least 20 samples of the 30 person group using the F9 key. What do you
estimate the probability of finding two people with the same birthday in a sample of 30
people to be?
Which of the following are the two most commonly used measures of variability?
a. Variance and median
b. Variance and standard deviation
c. Mean and variance

d. Mean and range
e. First quartile and third quartile
We can infer that there is a strong relationship between two numerical variables when
a. The points on a scatterplot cluster tightly around an upward sloping straight line
b. The points on a scatterplot cluster tightly around a downward sloping straight line
c. Either of these options
d. Neither of these options
The following are the values of a time series for the first four time periods:
Using a four-period moving average, the forecasted value for time period 5 is:
a. 24.5
b. 25.5
c. 26.5
d. 27.5

If exact multicollinearlity exists, that means that there is redundancy in the data.
NARRBEGIN: SA_75_78
The percent defective for parts produced by a manufacturing process is targeted at 4%.
The process is monitored daily by taking samples of sizes n = 160 units. Suppose that
today’s sample contains 14 defectives.
NARREND
(A) Determine a 95% confidence interval for the proportion defective for the process
today.
(B) Based on your answer to (A), is it still reasonable to think the overall proportion
defective produced by today’s process is actually the targeted 4%? Explain your
reasoning.
(C) The confidence interval in (A) is based on the assumption of a large sample size. Is
this sample size sufficiently large in this example? Explain how you arrived at your
answer.
(D) How many units would have to be sampled to be 95% confident that you can
estimate the fraction of defective parts within 2% (using the information from today’s
sample)?

There are two types of random variables, they are
a. discrete and continuous
b. exhaustive and mutually exclusive
c. complementary and cumulative
d. real and unreal
If two events are collectively exhaustive, what is the probability that one or the other
occurs?
a. 0.25

b. 0.50
c. 1.00
d. Cannot be determined from the information given.
The defining property of a simple random sample is that:
a. every sample has the same chance of being chosen
b. the easiest method to access samples are chosen
c. the fewest samples are chosen
d. every fourth subject is chosen as a sample
NARRBEGIN: SA_88_93
A company that makes baseball caps would like to predict the sales of it main product,
standard little league caps. The company has gathered data on monthly sales of caps at
all of its retail stores, along with information related to the average retail price, which
varies by location. Below you will find regression output comparing these two
variables.

NARREND
(A) Estimate the regression model. How well does this model fit the given data?
(B) Is there a linear relationship between X and Y at the 5% significance level? Explain
how you arrived at your answer.
(C) Use the estimated regression model to predict the number of caps that will be sold
during the next month if the average selling price is $10.
(D) Find a 95% prediction interval for the number of caps determined in Question 90.
Use t- multiple = 2.
(E) Find a 95% confidence interval for the average number of caps sold given an
average selling price of $10. Use a t-multiple = 2.
(F) How do you explain the differences between the widths of the intervals in (D) and
(E)?

All optimization problems have:
a. an objective function and decision variables
b. an objective function and constraints
c. decision variables and constraints
d. an objective function, decision variables and constraints

Which of the following distributions is appropriate to measure the length of time
between arrivals at a grocery checkout counter?
a. Uniform
b. Normal
c. Exponential
d. Poisson
In nonlinear models, which of the following statements are correct?
a. Only the objective function is not a linear function of the decision variables
b. Only the constraints are not linear functions of the decision variables
c. The objective function and/or the constraints are not linear functions of the decision
variables
d. All of these options
If A and B are mutually exclusive events with P(A) = 0.30 and P(B) = 0.40, then the
probability that either A or B or both occur is:
a. 0.10
b. 0.12
c. 0.70

d. None of the above
NARRBEGIN: SA_117_120
The time it takes a technician to fix a computer problem is exponentially distributed
with a mean of 15 minutes.
NARREND
What is the probability density function for the time it takes a technician to fix a
computer problem?
NARRBEGIN: SA_74_77
The “winner’s curse” refers to a situation where there are several bidders on the same
item. Each participant can make his or her independent estimate for the value of the
item. When all participants are equally informed their estimates will be unbiased, but,
given the difficulty of estimating the value, the estimates may vary widely. Even though
the mean of the estimates may equal the expected value, the winner’s bid will likely be
more than the value of the item. Consider a case where 3 companies are trying to decide
how much to bid for a commercial real estate tract. Assume that each bidder
independently estimates the value of the tract. This estimated value is a random variable
that for each bidder is drawn from a normal distribution with a mean of $1,000,000 and
a standard deviation of $200,000. The actual value is also drawn from the same
distribution.
NARREND
What is the probability of winning for the conservative bidder?
NARRBEGIN: SA_108_112
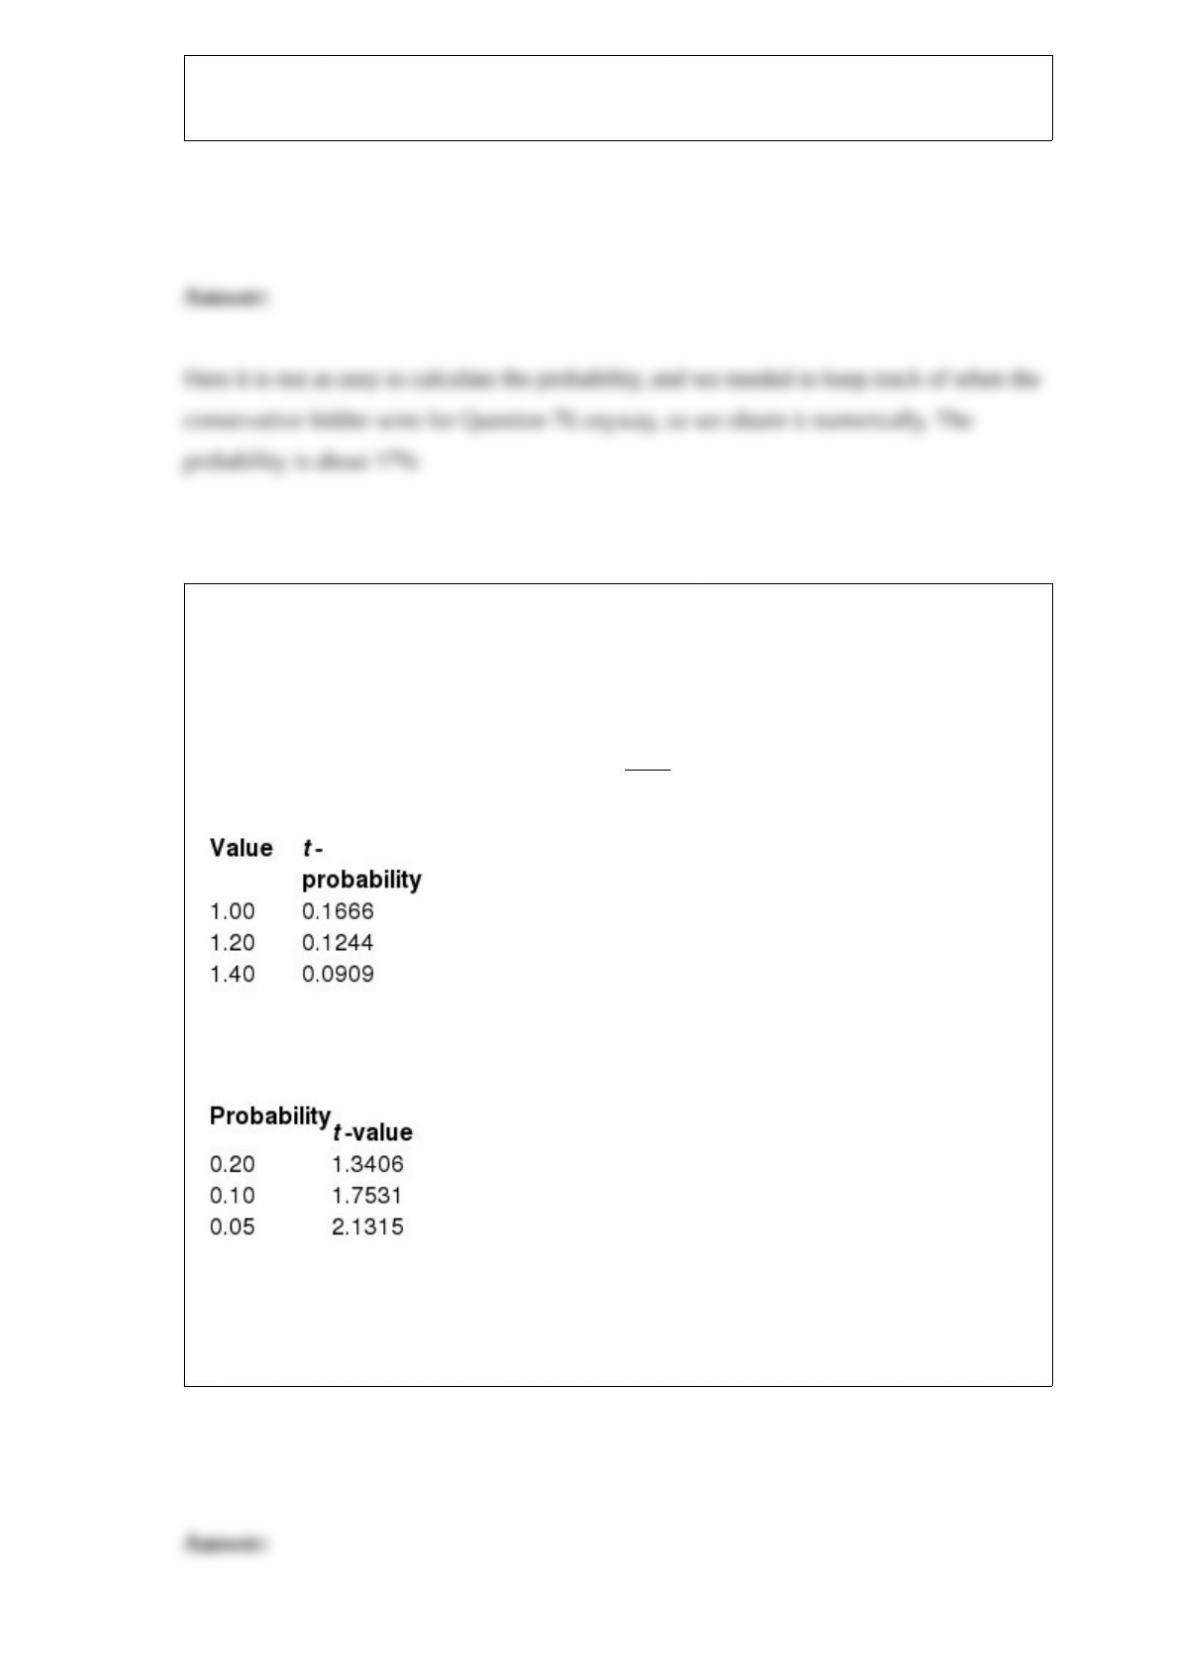
The following values have been calculated using the TDIST and TINV functions in
Excel. These values come from a t- distribution with 15 degrees of freedom.
These values represent the probability to the right of the given positive values.
These values represent the positive t- value for a given probability in both tails (sum of
both tails).
NARREND
What would be the t-values where 0.10 of the values are in both tails (sum of both
tails)?

NARRBEGIN: SA_92_94
Suppose that simple exponential smoothing with is used to forecast monthly
Pepsi sales at a small grocery store. After March’s demand is observed, the forecasted
demand for April is 5000 cans of Pepsi.
NARREND
At the beginning of April, what is the forecast of June’s Pepsi sales?
Poisson distribution is appropriate to determine the probability of a given number of
defective items in a shipment.
A skewed histogram is one with a long tail extending either to the right or left. The
former is called negatively skewed, and the later is called positively skewed.

NARRBEGIN: SA_83_85
A department store in a small town is in the process of budget planning and will be
building a decision tree to select the best option among its available marketing
channels. To estimate the probabilities it will need, it considers a customer base of 1500
individuals, 700 of which are women. Data shows that 240 of the women in this
population earn at least $50,000 per year and 300 of the men earn at least $50,000 per
year.
NARREND
What is the probability that a randomly selected individual from this population earns
less than $50,000 per year?
The expected monetary value (EMV) criterion is sometimes referred to as “playing the
averages” and for that reason should only be used for recurring decisions.
To calculate the five-period moving average for a time series, we average the values in
the two preceding periods, and the values in the three following time periods.

NARRBEGIN: SA_78_80
A company is about to develop and then market a new product. It wants to build a
simulation model for the entire process, and one key uncertain input is the development
time, which is measured in an integer number of months. For each of the scenarios in
the questions below, choose an “appropriate” distribution, together with its parameters,
and explain your choice.
NARREND
Company experts believe the development time will be from 5 to 9 months. They
believe that 7 months is twice as likely as either 6 months or 8 months and that either of
these latter possibilities is three times as likely as either 5 months or 9 months.
The transportation model is a special case of the minimum cost network flow model
(MCNFM).

The chi”square test for normality makes a comparison between the observed histogram
and a histogram based on normality.
NARRBEGIN: SA_78_80
A company is about to develop and then market a new product. It wants to build a
simulation model for the entire process, and one key uncertain input is the development
time, which is measured in an integer number of months. For each of the scenarios in
the questions below, choose an “appropriate” distribution, together with its parameters,
and explain your choice.
NARREND
Company experts believe the development time will from 5 to 9 months. They believe
the probabilities of the extremes (5 and 9 months) are both 10%, and the probabilities
will vary linearly from those endpoints to a most likely value at 7 months.
Data are usually meaningless until they are analyzed for trends, patterns, relationships,
and other useful information.

Suppose A and B are mutually exclusive events where P(A) = 0.3 and P(B) = 0.4, then
P(A and B) = 0.12.
Some histograms have two or more peaks. This is often an indication that the data come
from two or more distinct populations.
How would you characterize the relationship between gender and annual salary?
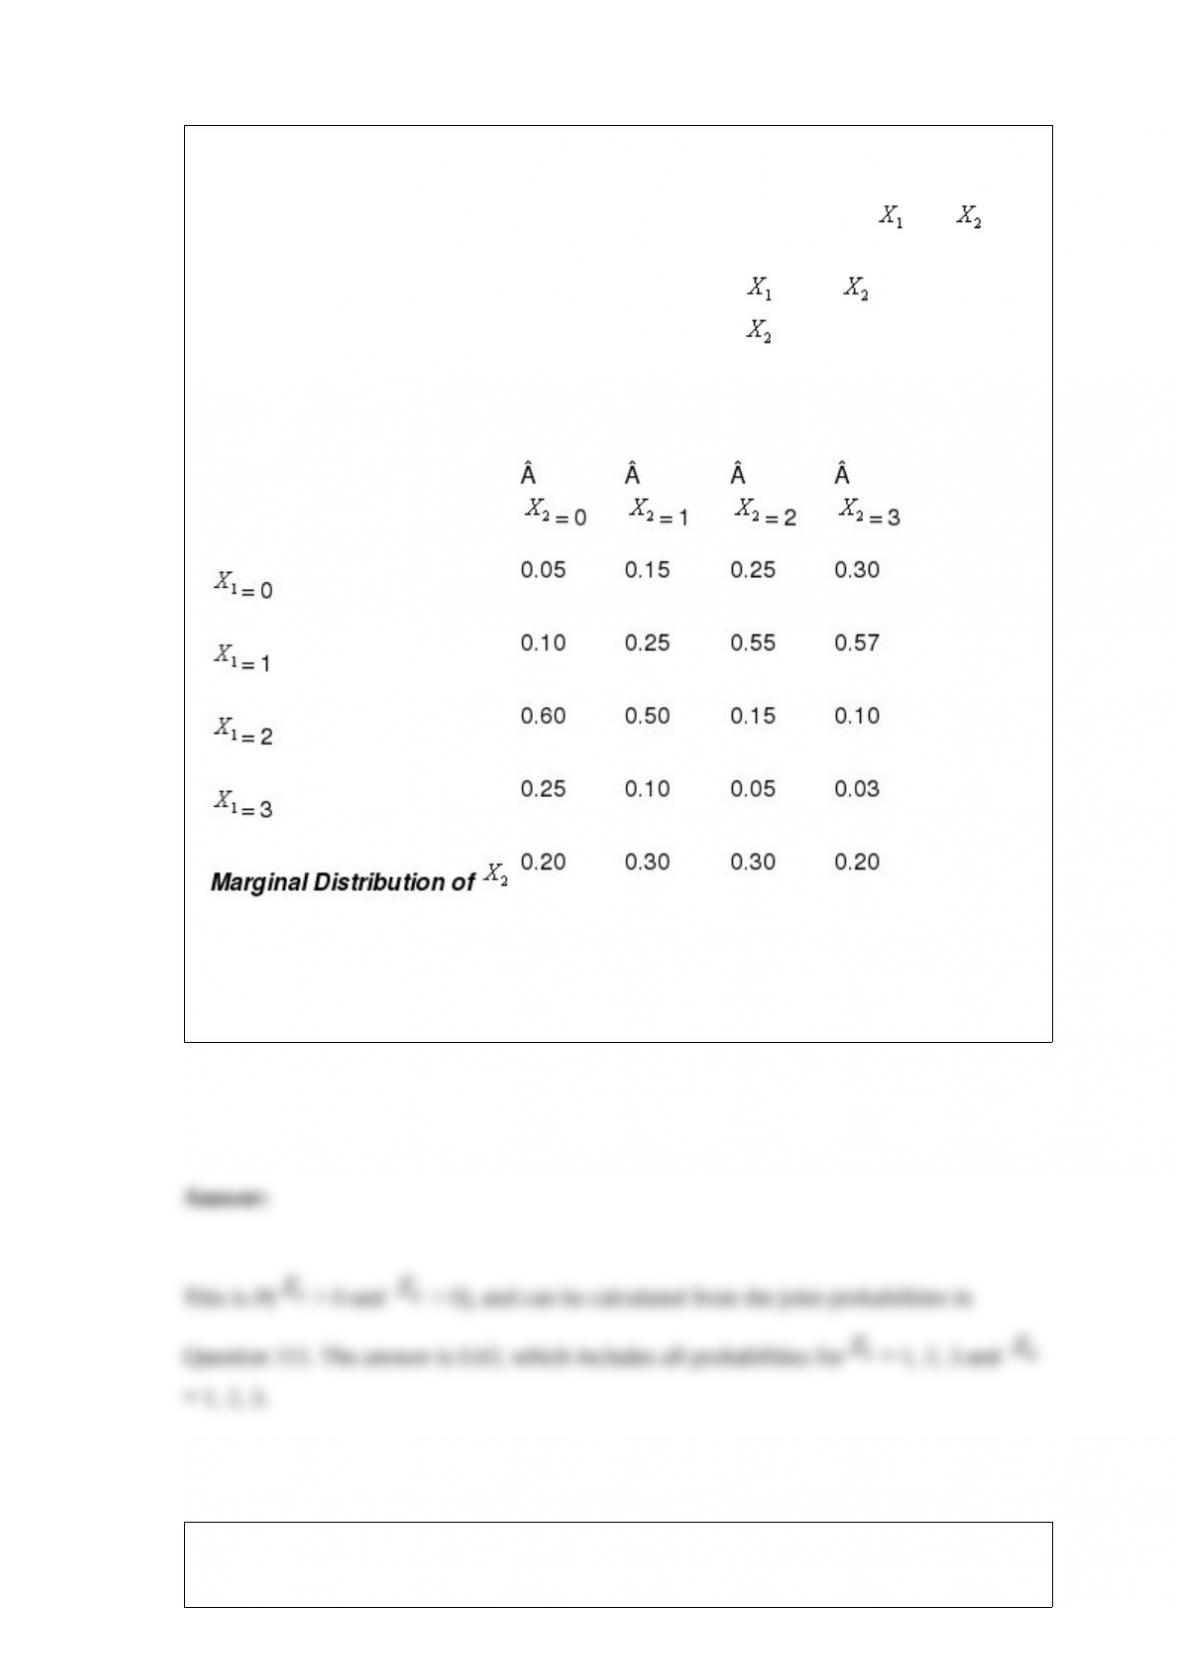
NARRBEGIN: SA_84_90
A sporting goods store sells two competing brands of softball bats. Let and be
the numbers of the two brands sold on a typical day at the store. Based on the store
historical data, the conditional probability distribution of given is assessed and
provided in the table below. The marginal distribution of is also given in the bottom
row of the table.
Sales of Brand 1, Given sales of Brand 2
NARREND
What is probability of observing the sale of at least one brand 1 bat and at least one
brand 2 bat on the same day at this sporting goods store?
NARRBEGIN: SA_104_112

Mrs. Rich has just bought a new $30,000 car. As a reasonably safe driver, she believes
that there is only a 5% chance of being in an accident in the forthcoming year. If she is
involved in an accident, the damage to her new car depends on the severity of the
accident. The probability distribution for the range of possible accidents and the
corresponding damage amounts (in dollars) are shown in the table below. Mrs. Rich is
trying to decide whether she is willing to pay $170 each year for collision insurance
with a $300 deductible. Note that with this type of insurance, she pays the first $300 in
damages if she causes an accident, and the insurance company pays the remainder.
Distribution of Accident Types and Corresponding Damage Amounts
NARREND
What should Mrs. Rich do? What is her expected cost in that case?
Correlation and covariance can be used to examine relationships between numerical
variables and categorical variables that have been coded numerically.