
In a simple regression with a single explanatory variable, the multiple R is the same as
the standard correlation between the Y variable and the explanatory X variable.
In conducting hypothesis testing for difference between two means when samples are
dependent (paired samples), the variable under consideration is ; the sample mean
difference between the pairs.
The proportionality property of LP models means that if the level of any activity is
multiplied by a constant factor, then the contribution of this activity to the objective
function, or to any of the constraints in which the activity is involved, is multiplied by
the same factor.
The analyst gets to choose the significance level . It is typically chosen to be 0.50,

but it is occasionally chosen to be 0.05.
Sample evidence is statistically significant at the level only if the p“value is larger
than .
Why is the independence assumption in Question 74 probably not realistic? Using a
more realistic assumption, do you think the probability in Question 74 would increase
or decrease?
NARRBEGIN: SA_66_71

The weekly demand for a particular automobile manufacturer follows a normal
distribution with a mean of 40,000 cars and a standard deviation of 10,000. Below you
will find probability and percentile calculations related to the customer purchase
amounts. Use this information to answer the following questions.
Probability Calculations
P(Sales < 2,000,000) = 0.134, P(Sales < 2,050,000) = 0.339
P(Sales < 2,100,000) = 0.609, P(Sales < 2,150,000) = 0.834
Percentiles Calculations
1st percentile = 1,912,245, 5th percentile = 1,961,388
95th percentile = 2,198,612, 99th percentile = 2,247,755
NARREND
What is the probability that this company will sell between 2.0 and 2.15 million cars
next year?
Prior probabilities are sometimes called likelihoods, the probabilities that are influenced
by information about the outcome of an earlier uncertainty.
Suppose that a sample of 10 observations has a standard deviation of 3, then the sum of
the squared deviations from the sample mean is 30.

Categorical variables can be classified as either discrete or continuous.
If a random sample of size 250 is taken from a population, where it is known that the
population proportion p = 0.4, then the mean of the sampling distribution of the sample
proportion is 0.60.
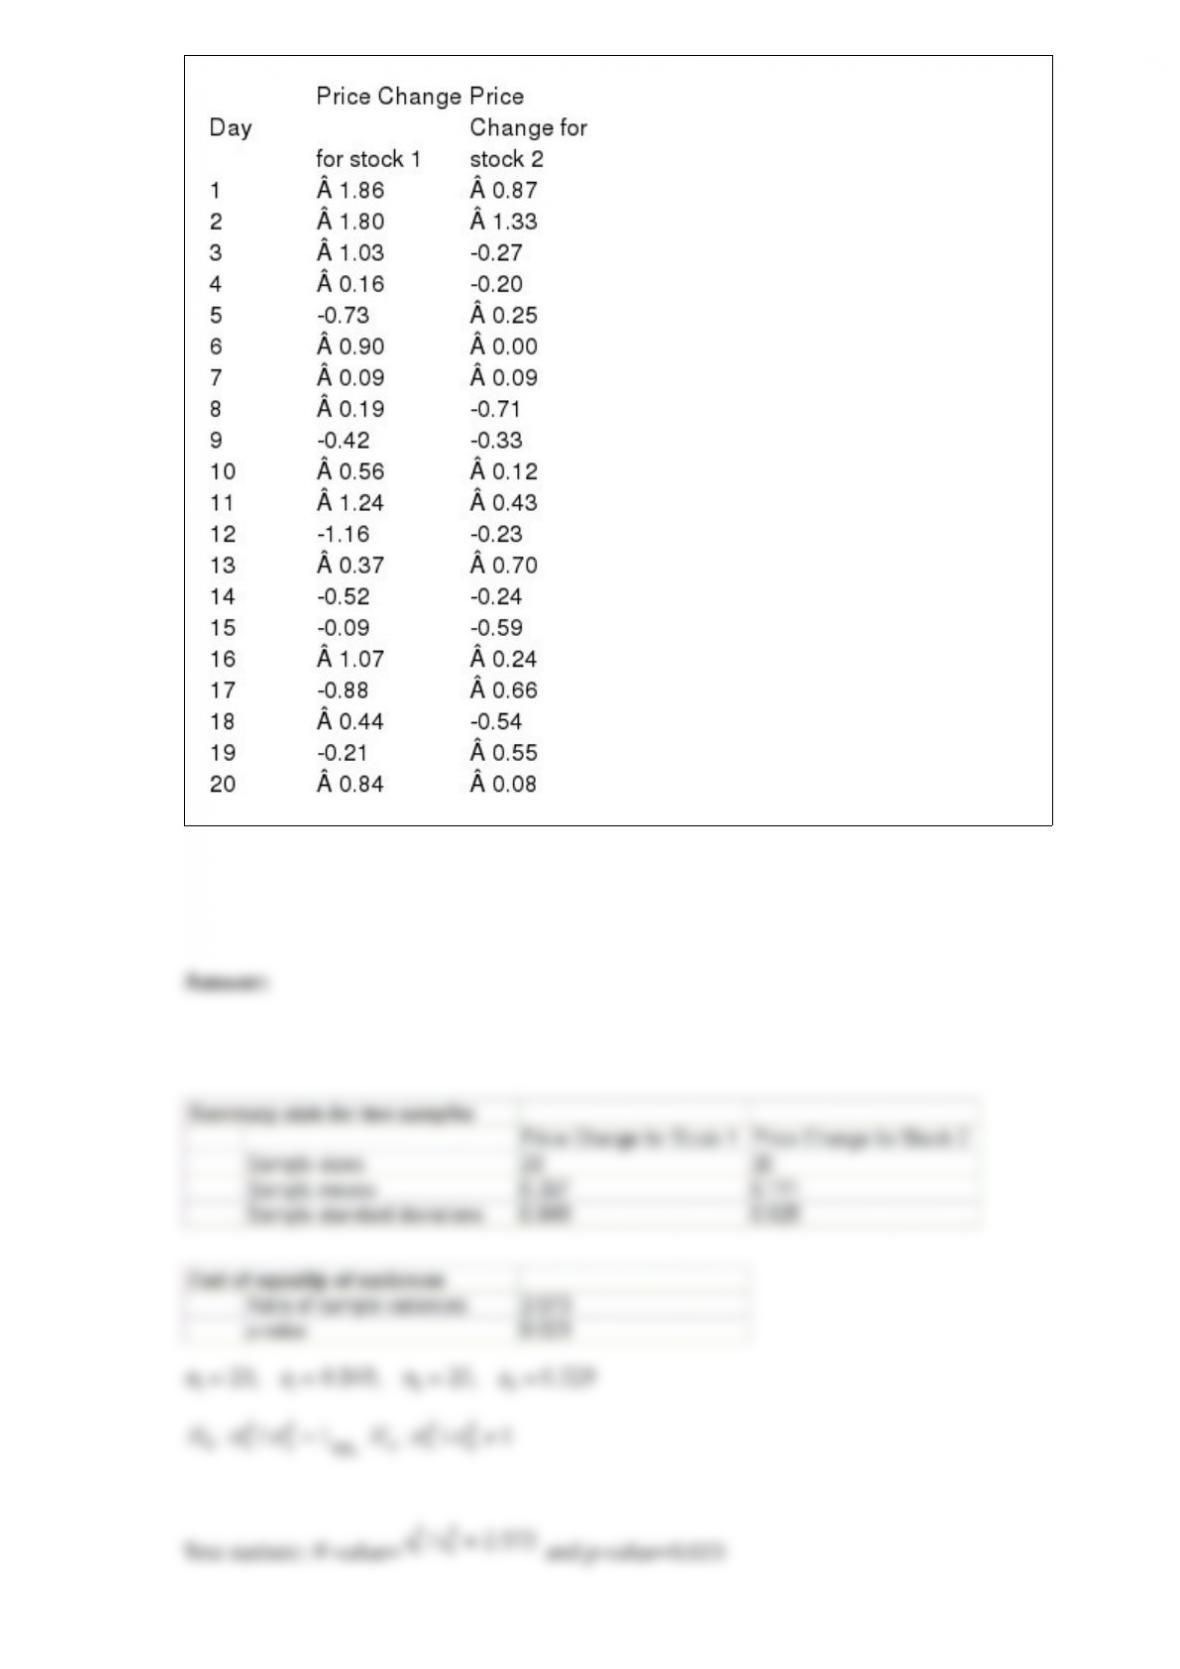
An investor wants to compare the risks associated with two different stocks. One way to
measure the risk of a given stock is to measure the variation in the stock’s daily price
changes. The investor obtains a random sample of 20 daily price changes for stock 1
and 20 daily price changes for stock 2. These data are shown in the table below. Show
how this investor can compare the risks associated with the two stocks by testing the
null hypothesis that the variances of the stocks are equal. Use = 0.10 and interpret the
results of the statistical test.

A constant elasticity, or multiplicative, model the dependent variable is expressed as a
product of explanatory variables raised to powers
How many job applicants scored above 50?
Probability is a number between 0 and 1, inclusive, which measures the likelihood that
some event will occur.
A common guideline in constructing confidence intervals for the mean is to place upper

and lower bounds one standard error on either side of the average to obtain an
approximate 95% confidence interval.
We can use Excel’s RAND function inside an IF function to simulate whether some
event occurs or does not occur.