
If Cov(X,Y) = – 16.0, variance of X = 25, variance of Y = 16 then the sample coefficient
of correlation r is
a. + 1.60
b. ” 1.60
c. ” 0.80
d. + 0.80
e. Cannot be determined from the given information
The term nonnegativity refers to the condition where:
a. the objective function cannot be less that zero
b. the decision variables cannot be less than zero
c. the right hand side of the constraints cannot be greater then zero
d. the reduced cost cannot be less than zero
Confidence intervals are a function of which of the following three things?
a. The population, the sample, and the standard deviation

b. The sample, the variable of interest, and the degrees of freedom
c. The data in the sample, the confidence level, and the sample size
d. The sampling distribution, the confidence level, and the degrees of freedom
e. The mean, median, and mode
We assume that the outcomes of successive trials in a binomial experiment are:
a. probabilistically independent
b. probabilistically dependent
c. identical from trial to trial
d. random number between 0 and 1
A researcher can check whether the errors are normally distributed by using:
a. a t-test or an F-test
b. the Durbin-Watson statistic
c. a frequency distribution or the value of the regression coefficient
d. a histogram or a Q-Q plot

The Poisson and Exponential distributions are commonly used in which of the
following applications
a. Inventory models
b. Financial models
c. Failure analysis models
d. All of these options
A scatterplot that exhibits a “fan” shape (the variation of Y increases as X increases) is
an example of:
a. homoscedasticity
b. heteroscedasticity
c. autocorrelation
d. multicollinearity

If the odds of a horse winning a race are 2 to 1, then the probability of this horse
winning the race is_____.
a. 1/4
b. 1/3
c. 1/2
d. 2/3
e. None of the above
NARRBEGIN: SA_118_122
Southport Mining Corporation is considering a new mining venture in Indonesia. There
are two uncertainties associated with this prospect; the metallurgical properties of the
ore and the net price (market price minus mining and transportation costs) of the ore in
the future.
The metallurgical properties of the ore would be classified as either “high grade” or
“low grade”. Southport’s geologists have estimated that there is a 70% chance that the
ore will be “high grade”, and otherwise, it will be “low grade”. Depending on the net
price, both ore classifications could be commercially successful.
The anticipated net prices depended on market conditions, and also on the metallurgical
properties of the ore. Southport’s economists have simplified the continuous distribution
of possible prices into a two-outcome discrete distribution (“high” or “low” net price)
for the investment analysis. The probabilities of these net prices, and the associated
outcomes (in millions of dollars), are summarized below.
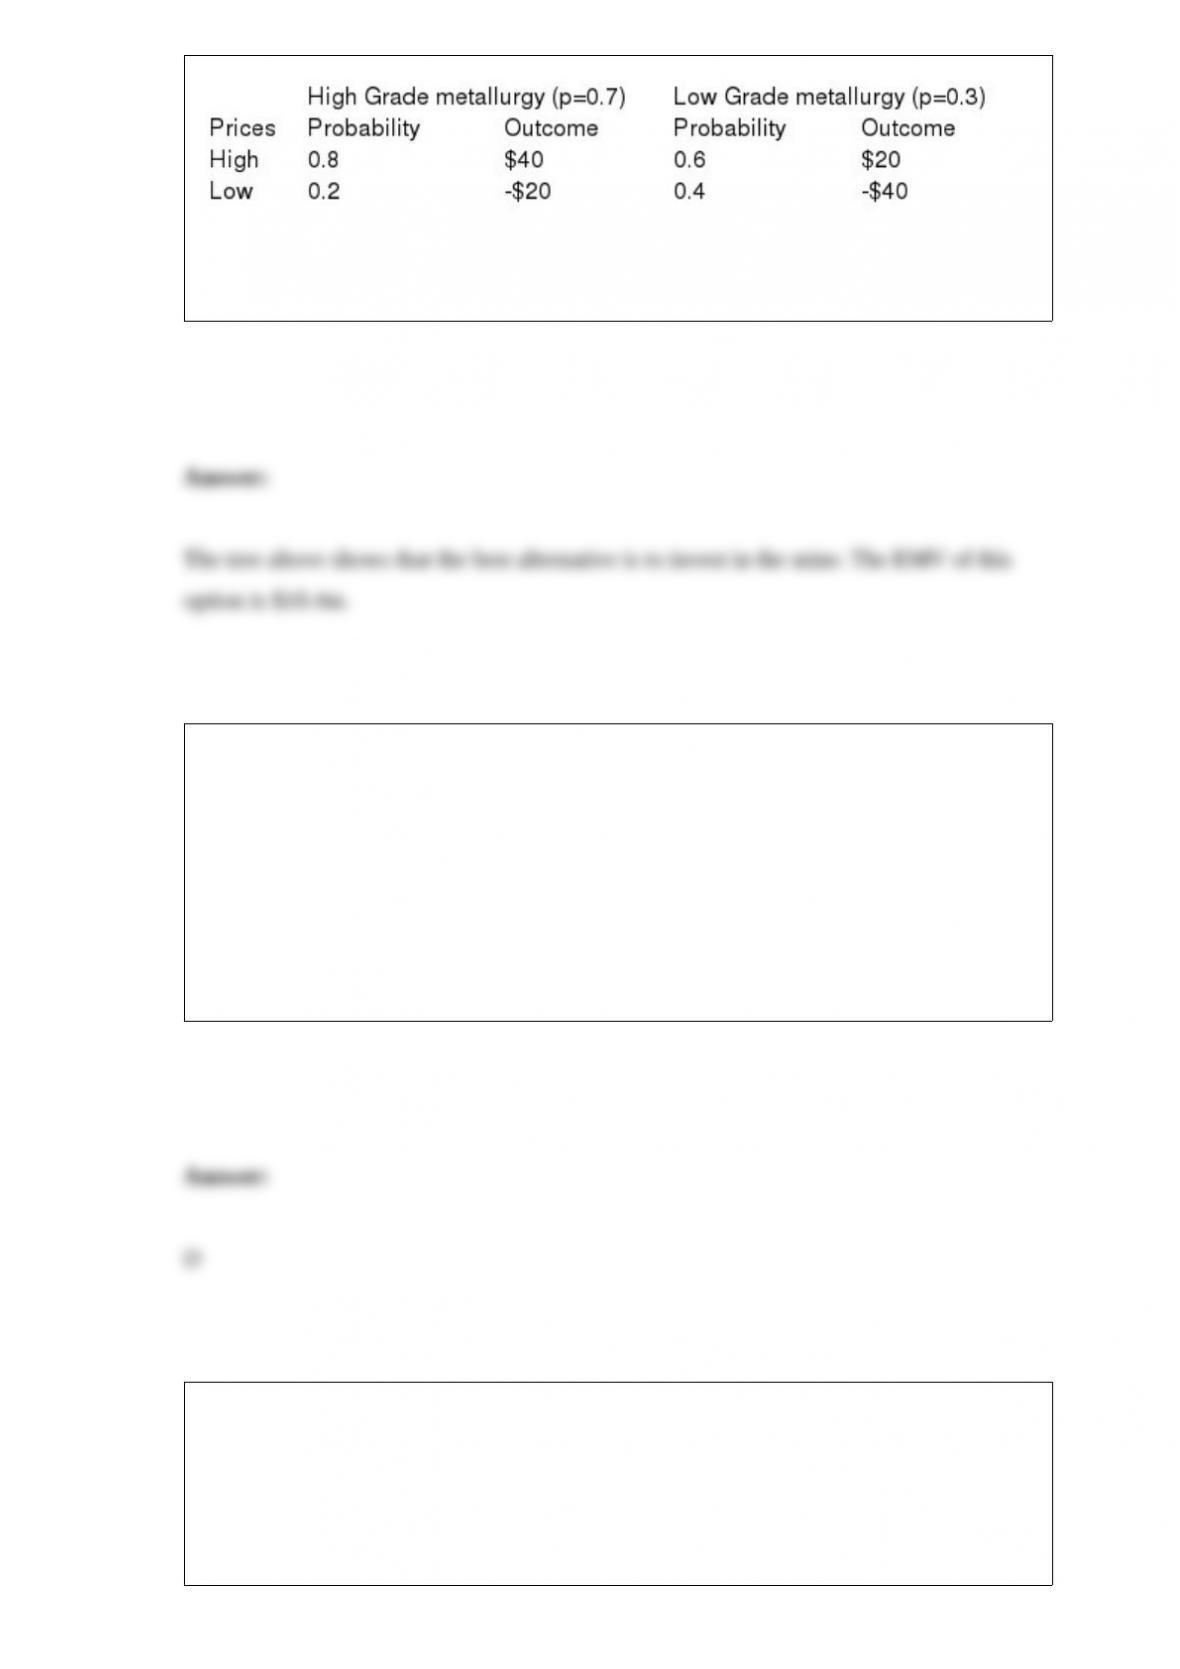
NARREND
What should the Southport do? What is their expected profit?
The median can also be described as:
a. the middle observation when the data values are arranged in ascending order
b. the second quartile
c. the 50th percentile
d. All of these options
NARRBEGIN: SA_93_95
After Michigan State University reached the final four in the 2000 NCAA Basketball
Tournament, a sweatshirt supplier in Lansing is trying to decide how many sweatshirts
to print for the upcoming championships. The final four teams (Michigan State, Florida,
Wisconsin, and North Carolina) have emerged from the quarterfinal round, and there is
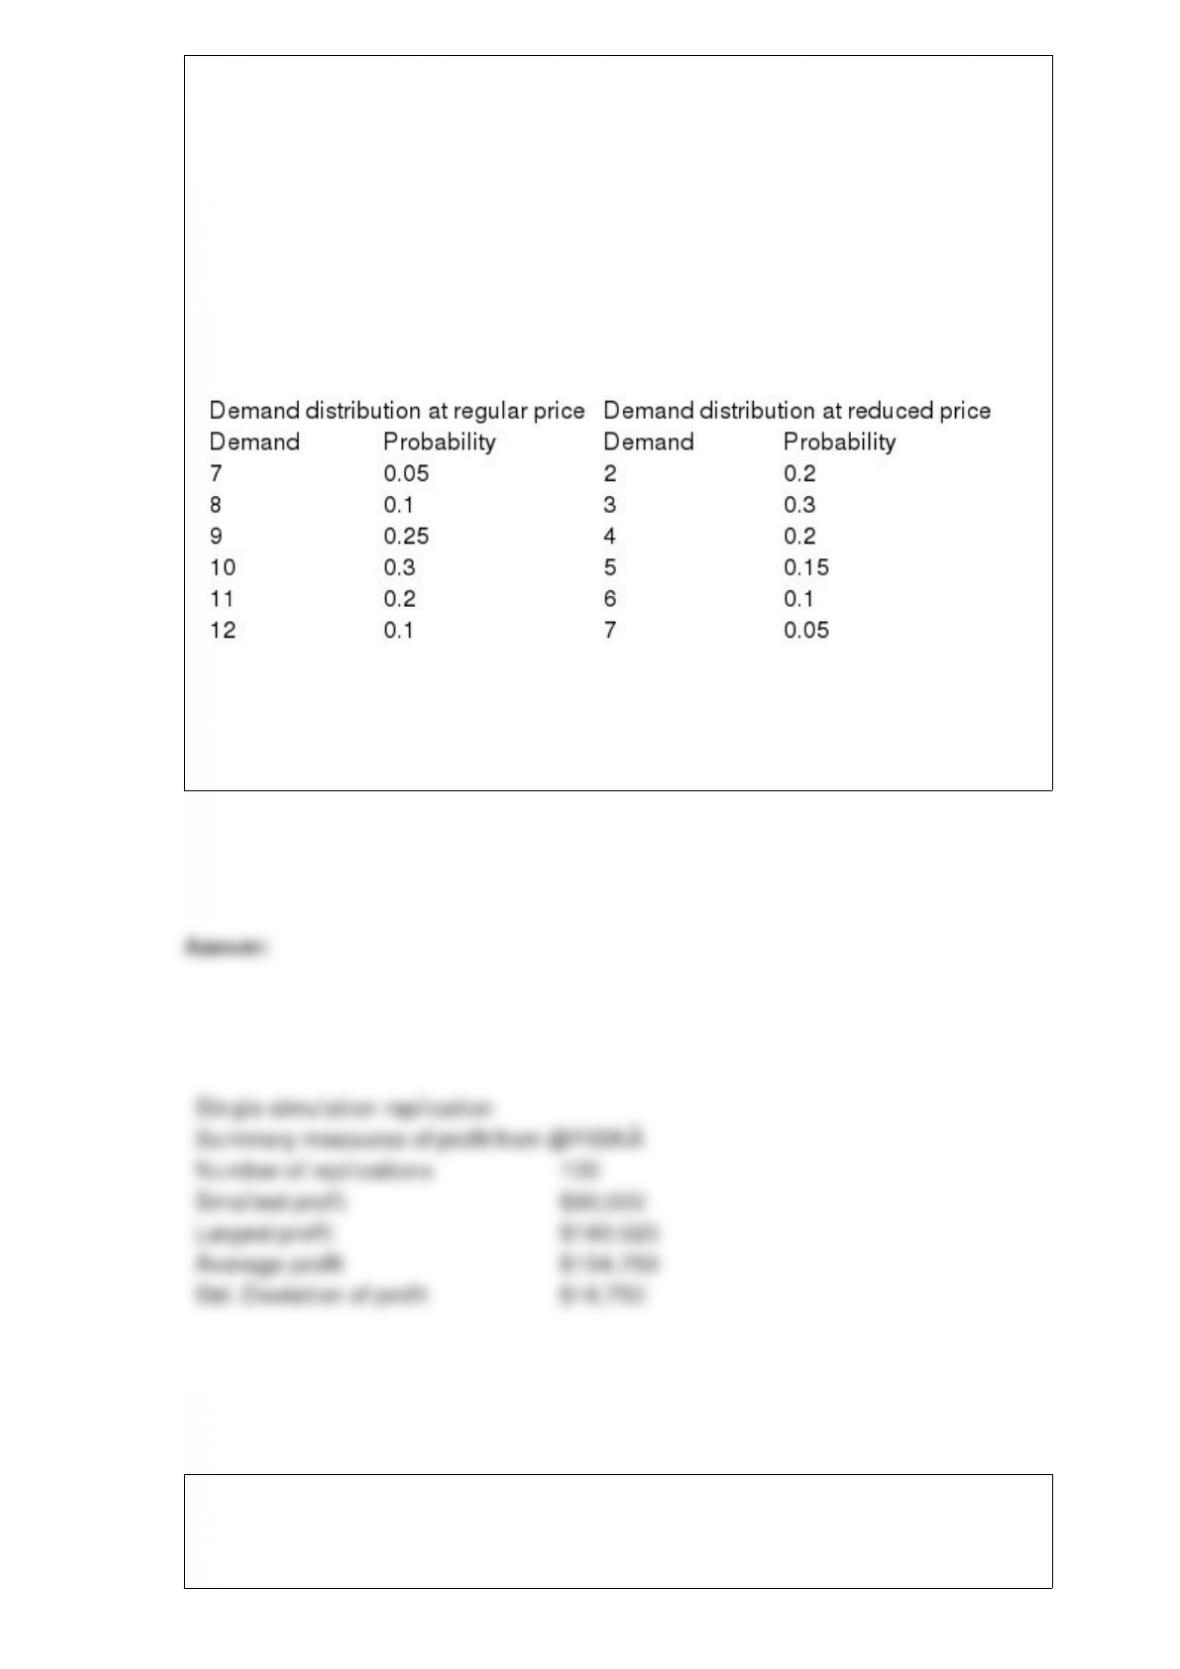
a week left until the semifinals, which are then followed in a couple of days by the
finals. Each sweatshirt costs $12 to produce and sells for $24. However, in three weeks,
any leftover sweatshirts will be put on sale for half price, $12. The supplier assumes
that the demand (in thousands) for his sweatshirts during the next three weeks, when
interest is at its highest, follows the probability distribution shown in the table below.
The residual demand, after the sweatshirts have been put on sale, also has the
probability distribution shown in the table below. The supplier realizes that every
sweatshirt sold, even at the sale price, yields a profit. However, he also realizes that any
sweatshirts produced but not sold must be thrown away, resulting in a $12 loss per
sweatshirt.
NARREND
Use @Risk simulation add-in to analyze the sweatshirt sales. Do this for the discrete
distributions given in the problem.
The solution procedure that was introduced in the book for decision trees is called the:
a. folding diagram

b. single-stage method
c. risk profile method
d. precision tree method
e. folding back on the tree
The theorem that states that the sampling distribution of the sample mean is
approximately normal when the sample size n is reasonably large is known as the:
a. central limit theorem
b. central tendency theorem
c. simple random sample theorem
d. point estimate theorem
An informal test for normality that utilizes a scatterplot and looks for clustering around
a 45line is known as a(n):
a. Lilliefors test
b. empirical cumulative distribution function
c. p-test
d. quantile-quantile plot

A minimum cost network flow model (MCNFM) has the following advantage relative
to the special case of a simple transportation model:
a. a MCNFM does not require capacity restrictions on the arcs of the network
b. the flows in a general MCNFM don”t all necessarily have to be from supply locations
to demand locations
c. a MCNFM is generally easier to formulate and solve
d. All of these options
In a transshipment problem, shipments
a. can occur between any two nodes (suppliers, demanders, and transshipment
locations)
b. cannot occur between two supply locations
c. cannot occur between two demand locations
d. cannot occur between a transshipment location and a demand location
e. cannot occur between a supply location and a demand location

In decision trees, time:
a. is constant
b. proceeds from bottom to top
c. proceeds from top to bottom
d. proceeds from right to left
e. proceeds from left to right
Which of the following might not be appropriately modeled with a normal distribution?
a. The daily low temperature in Anchorage, Alaska
b. The returns on a stock
c. The daily change in inventory at a computer manufacturer
d. The salaries of employees at a large company
NARRBEGIN: SA_107_109
A large auto dealership is interested in determining the number of cars that will be sold
in a given quarter. The management of the dealership believes that a relationship can be
found between the number of cars sold (Y), the advertised price ( ) and the current
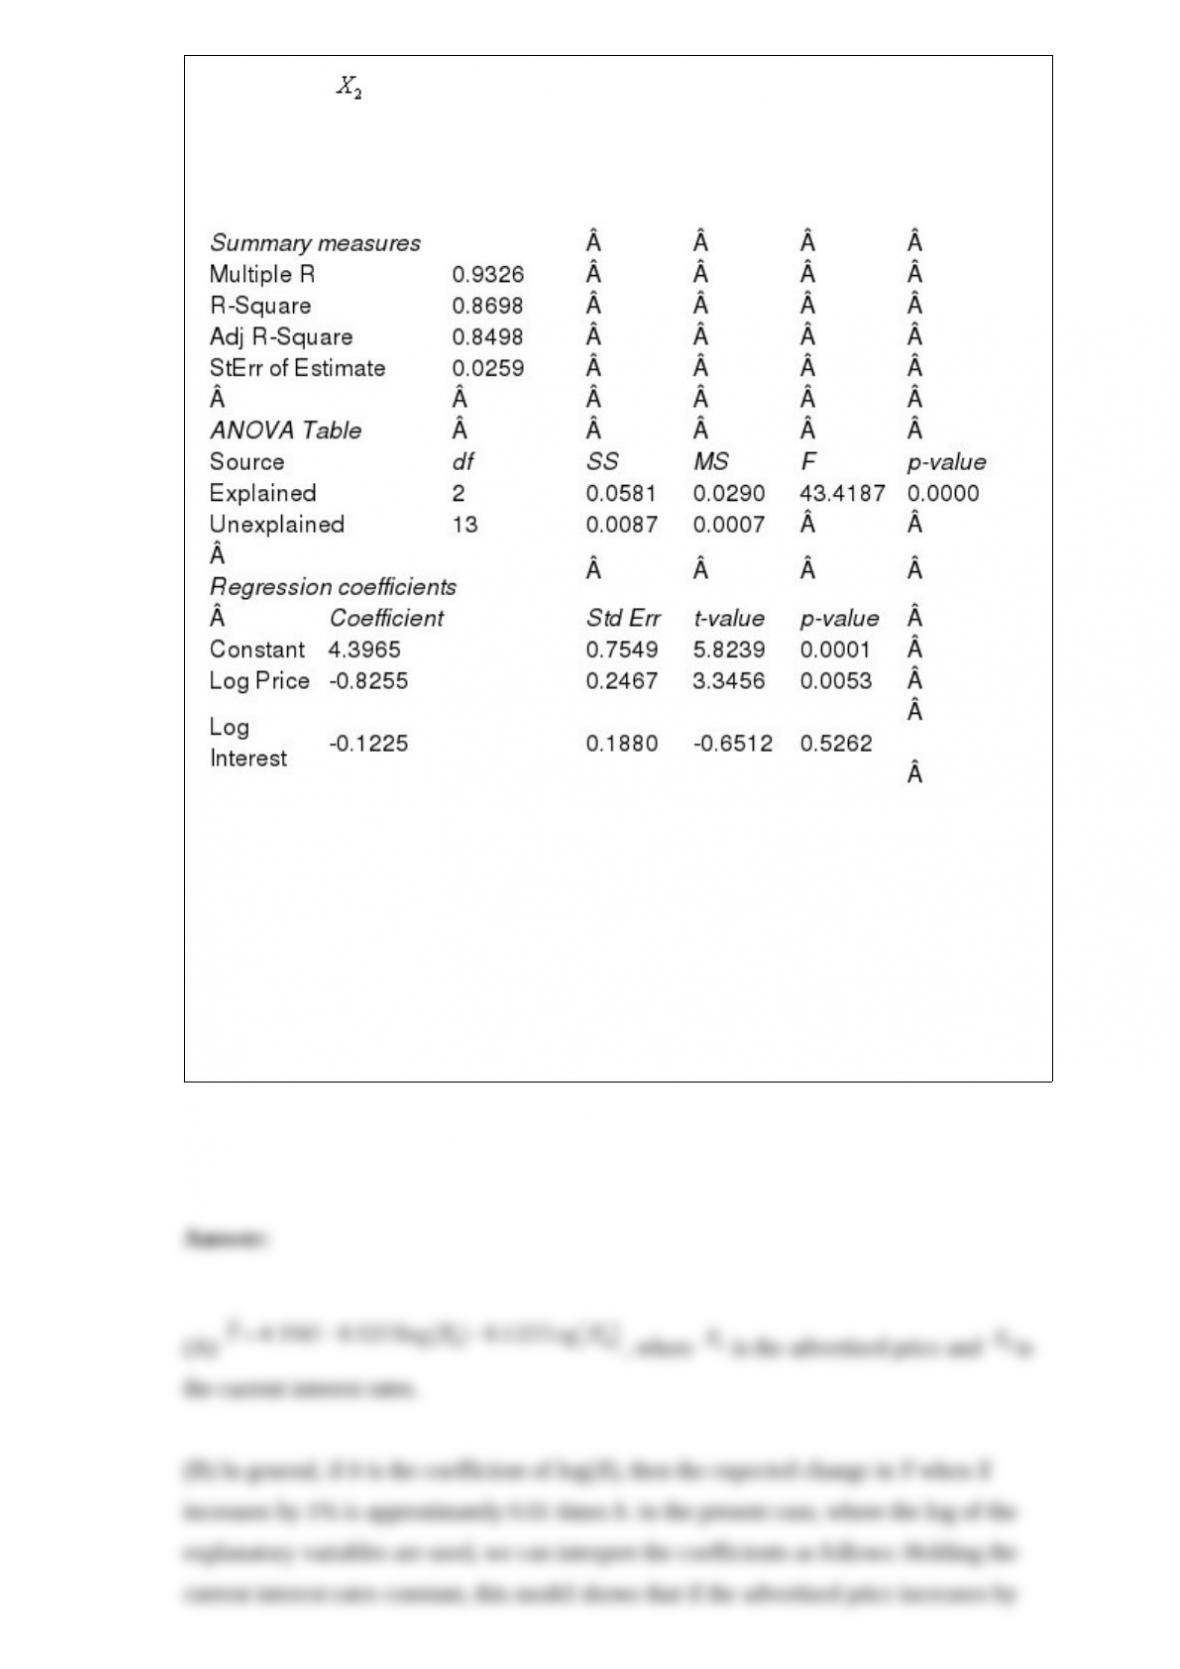
interest rates ( ). Their past experience shows that they tend to have better luck using
a non-linear relationship. Below is the output from a regression analysis using the
natural logarithm of the variables in the model.
NARREND
(A) Use the information above to estimate the regression model.
(B) Interpret each of the estimated regression coefficients of the regression model in
(A).
(C) Does using a non-linear model seem to be a good choice in this example? Explain
your answer.

Generally speaking, if two variables are unrelated (as one increases, the other shows no
pattern), the covariance will be
a. a large positive number
b. a large negative number
c. a positive or negative number close to zero
d. a positive or negative number close to +1 or -1
Another term for constant error variance is:
a. homoscedasticity
b. heteroscedasticity
c. Autocorrelation
d. multicollinearity

Perhaps the simplest and one of the most frequently used extrapolation methods is the:
a. moving average
b. linear trend
c. exponential trend
d. causal model
If a teacher is trying to prove that new method of teaching economics is more effective
than traditional one, he/she will conduct a:
a. one-tailed test
b. two-tailed test
c. point estimate of the population parameter
d. confidence interval
The probability of an event and the probability of its complement always sum to:

a. 1
b. 0
c. any value between 0 and 1
d. any positive value
Which of the following is Excel add-in for performing what-if analyses?
a. PrecisionTree
b. TopRank
c. Solver
d. @Risk
e. StatTools
NARRBEGIN: SA_69_72
A recent MBA graduate is considering an offer of employment at a biotech company,
where she has been offered stock options as part of her compensation package. The
options give her the right, but not the obligation, to buy 2500 shares of stock either one
year from now or two years from now at a price of $50, which is the current market
price of the stock. If the price of the stock has risen above $50 at either time, she can

buy 2500 shares at $50 and then immediately sell at the current price, thereby making a
risk-free profit. On the other hand, if the price of the stock has dropped below $50, she
will not exercise the option because it is “out of the money” and she would loose
money. Based on historical market information, she estimates that the stock price in the
first year will either go up by 25% from its current price, with probability of 0.55, or it
will go down by 15%, with probability of 0.45. In either case, she can exercise the
options or wait to see what will happen in the second year. If she decides to wait, the in
the second year, the stock price will again go up or down by the same amounts and with
the same probabilities, starting from either the “up” or “down” price at the end of the
first year.
NARREND
(A) Construct a decision tree to help her model her option decision making. Make sure
to label all decision and chance nodes and include appropriate costs, payoffs and
probabilities.
(B) What is the optimal decision making policy regarding the options in all possible
scenarios over the next two years?
(C) What is the expected value of the stock options? Ignore the time value of money
(assume no discounting of future payoffs)
(D) If her estimates of the increases/decreases or probabilities are inaccurate, could the
options have a negative EMV?

Which of the following best describes the concept of marginal probability?
a. It is a measure of the likelihood that a particular event will occur, regardless of
whether another event occurs.

b. It is a measure of the likelihood that a particular event will occur, given that another
event has already occurred.
c. It is a measure of the likelihood of the simultaneous occurrence of two or more
events.
d. None of the above.
The _____ can be used to test for autocorrelation.
a. regression coefficient
b. correlation coefficient
c. Durbin-Watson statistic
d. F-test or t-test
Some important characteristics of probability distributions in general include the
following distinctions:
a. Discrete versus continuous
b. Symmetric versus skewed
c. Bounded versus unbounded

d. Positive (or nonnegative) versus unrestricted
e. All of these options
Which of the following @RISK functions can be used to find the probability of a
particular value in an output distribution?
a. RISKMIN
b. RISKMAX
c. RISKPERCENTILE
d. RISKTARGET
e. None of these options
Researchers may gain insight into the characteristics of a population by examining a
a. mathematical model describing the population
b. sample of the population
c. description of the population
d. replica
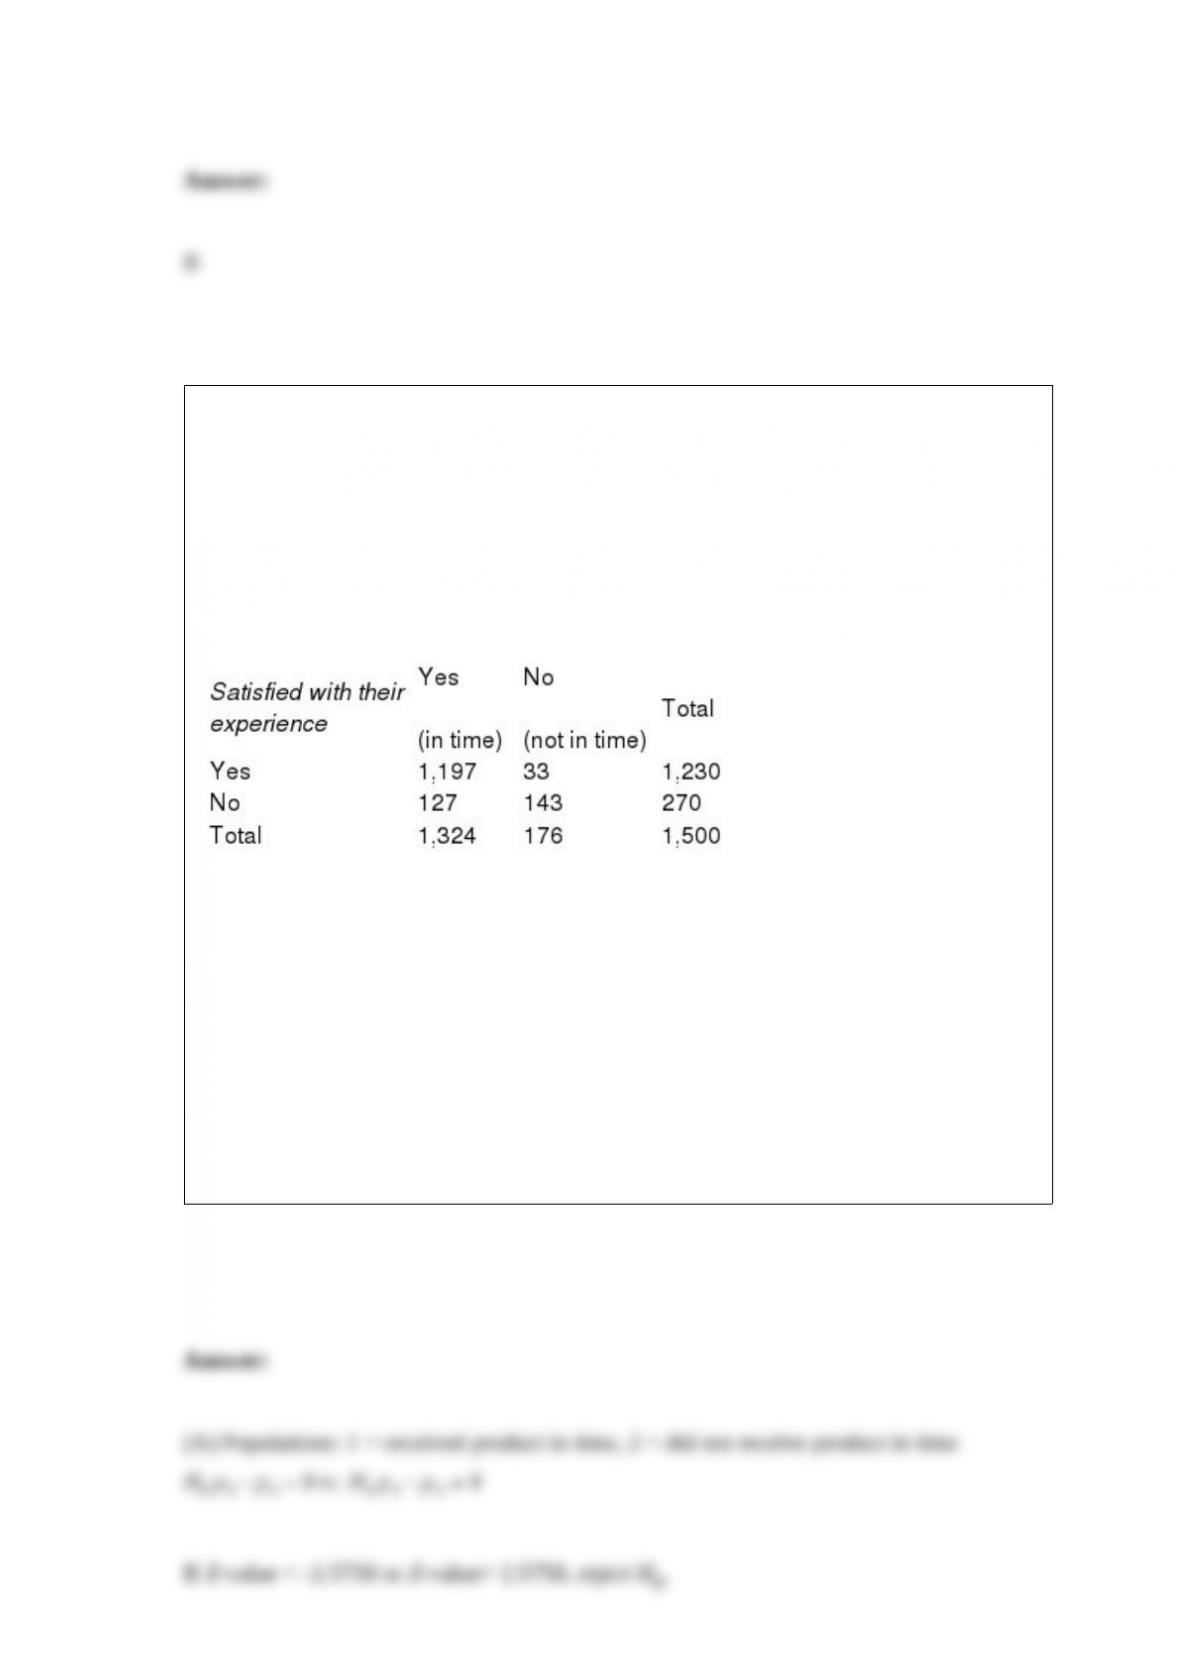
NARRBEGIN: SA_110_112
In a survey of 1,500 customers who did holiday shopping on line during the 2000
holiday season, 270 indicated that they were not satisfied with their experience. Of the
customers that were not satisfied, 143 indicated that they did not receive the products in
time for the holidays, while 1,197 of the customers that were satisfied with their
experience indicated that they did receive the products in time for the holidays. The
following complete summary of results were reported:
NARREND
(A) Is there a significant difference in satisfaction between those who received their
products in time for the holidays, and those who did not receive their products in time
for the holidays? Test at the 0.01 level of significance.
(B) Find the p-value associated with the test in Question 110 and interpret its meaning.
(C) Based on the results of (A) and (B), if you were the marketing director of a
company selling products online, what would you do to improve the satisfaction of the
customers?
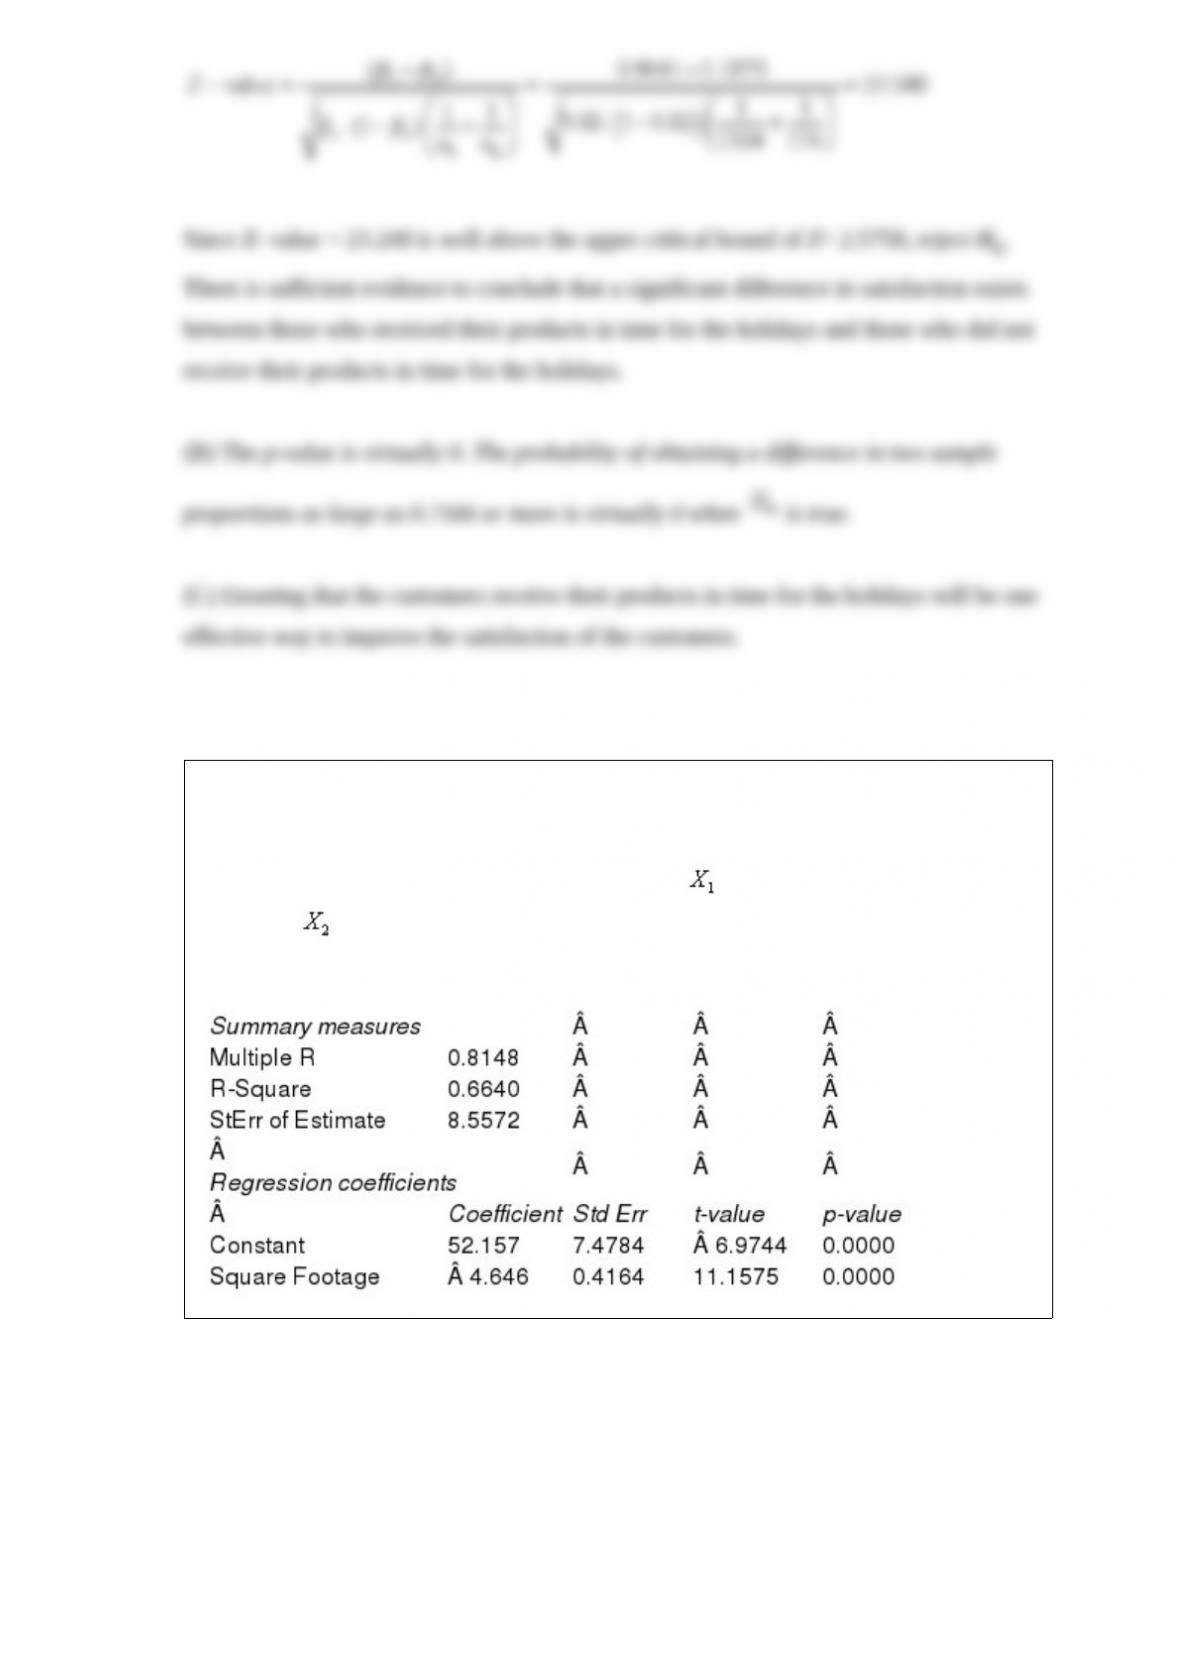
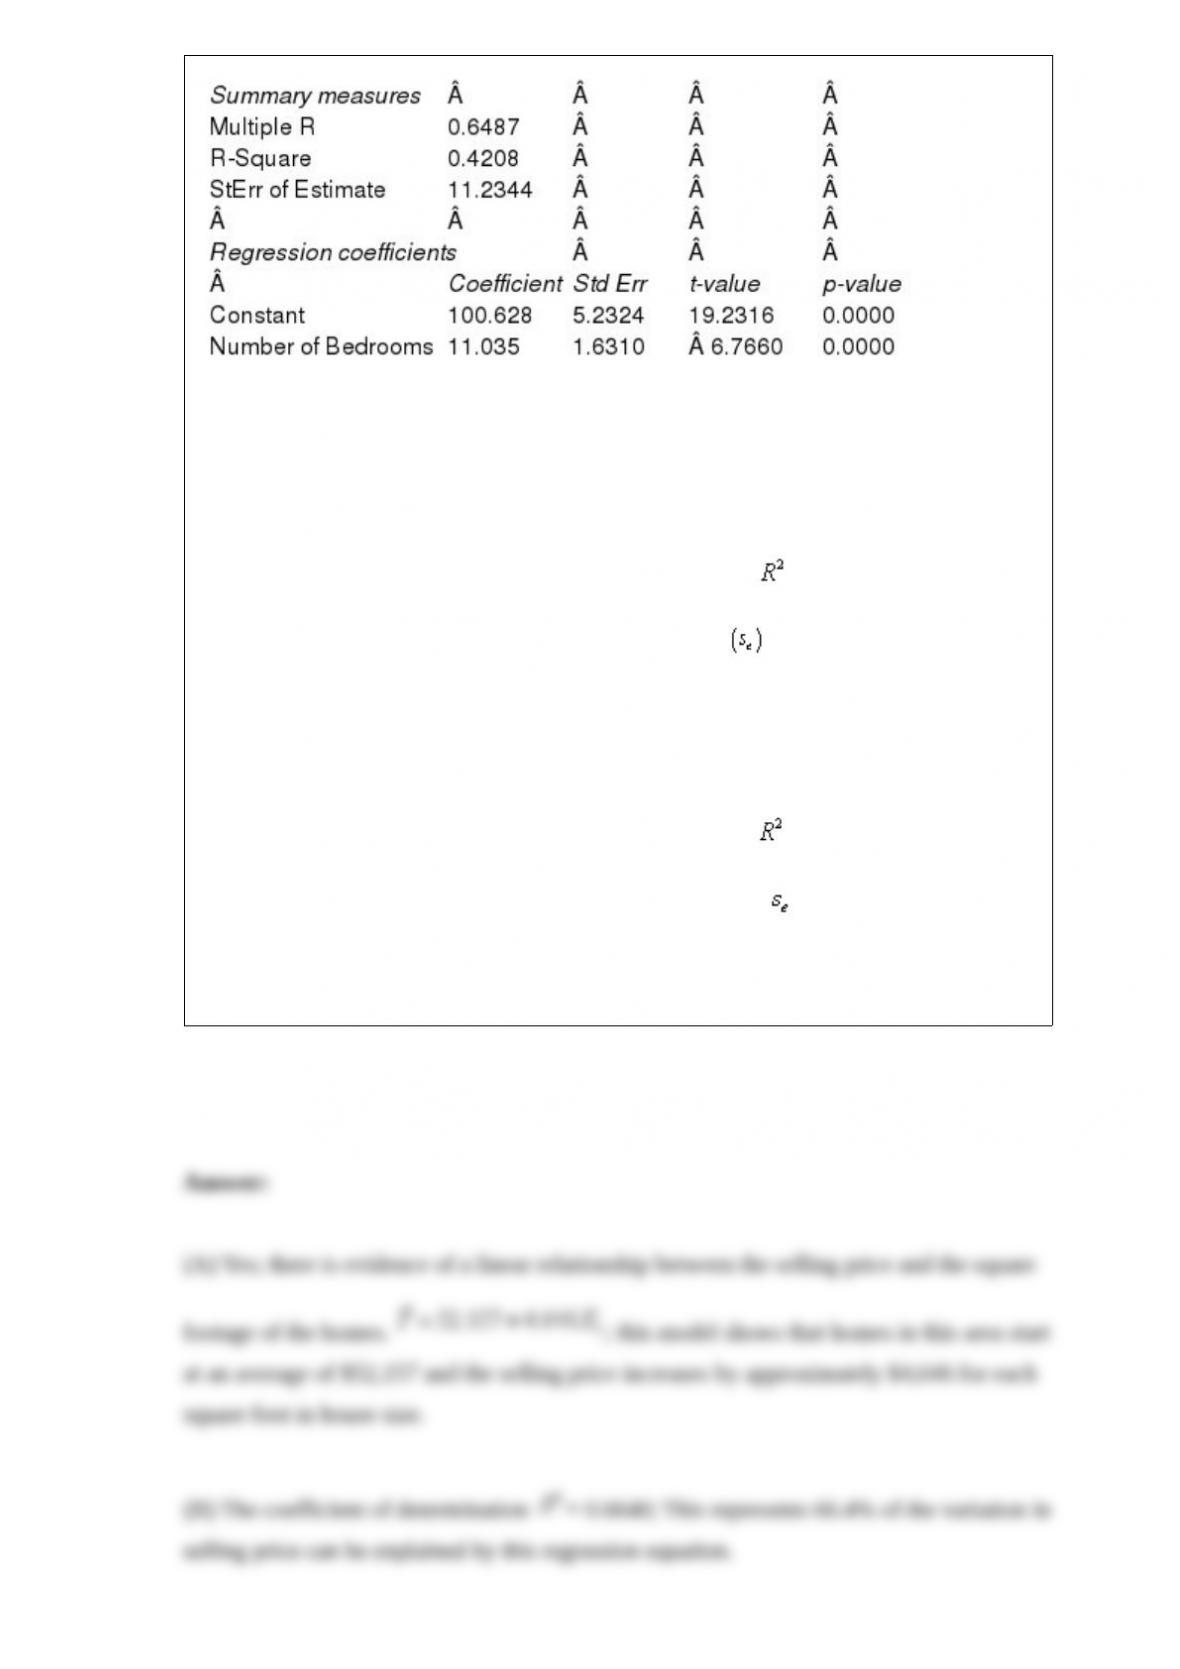
NARRBEGIN: SA_91_97
The information below represents the relationship between the selling price (Y, in
$1000) of a home, the square footage of the home ( ), and the number of bedrooms in
the home ( ). The data represents 65 homes sold in a particular area of a city and was
analyzed using simple linear regression for each independent variable.
NARREND
(A) Is there evidence of a linear relationship between the selling price and the square
footage of the homes? If so, interpret the least squares line and characterize the
relationship (i.e., positive, negative, strong, weak, etc.).
(B) Identify and interpret the coefficient of determination ( ) for the model in (A).
(C) Identify and interpret the standard error of estimate for the model in (A).
(D) Is there evidence of a linear relationship between the selling price and number of
bedrooms of the homes? If so, interpret the least squares line and characterize the
relationship (i.e., positive, negative, strong, weak, etc.).
(E) Identify and interpret the coefficient of determination ( ) for the model in (D).
(F) Identify and interpret the standard error of the estimate ( ) for the model in (C).
(G) Which of the two variables, the square footage or the number of bedrooms, is the
relationship with home selling price stronger? Justify your choice.

In a simple linear regression problem, if the standard error of estimate = 15 and n =
8, then the sum of squares for error, SSE, is 1,350.

Consider the frame of 50 full-time employees of Computer Technologies, Inc (CTI).
CTI’s human resources manager has collected annual salary figures for all employees
and she has calculated a mean of $47,723, a median of $41,082 and a standard
deviation of $24,167. A simple random sample of 10 employees is presented below
(salary is in $1,000’s). Compute the mean, median, and standard deviation for the
sample and compare these statistics with the measures for the entire company.
Shadow prices are associated with nonbinding constraints, and show the change in the
optimal objective function value when the right side of the constraint equation changes
by one unit.
NARRBEGIN: SA_79_90
The service manager for a new appliances store reviewed sales records of the past 20
sales of new microwaves to determine the number of warranty repairs he will be called
on to perform in the next 90 days. Corporate reports indicate that the probability any

one of their new microwaves needs a warranty repair in the first 90 days is 0.05. The
manager assumes that calls for warranty repair are independent of one another and is
interested in predicting the number of warranty repairs he will be called on to perform
in the next 90 days for this batch of 20 new microwaves sold.
NARREND
What is the probability that at most two of the 20 new microwaves sold will require a
warranty repair in the first 90 days?
Much of the study of probabilistic inventory models, queuing models, and reliability
models relies heavily on the Poisson and Exponential distributions.
The median is one of the most frequently used measures of variability.
In a multiple regression problem involving 30 observations and four explanatory

variables, SST = 800 and SSE = 240. The value of the F-statistic for testing the
significance of this model is 14.583.
NARRBEGIN: SA_113_117
A television network earns an average of $1.6 million each season from a hit program
and loses an average of $400,000 each season on a program that turns out to be a flop,
and of all programs picked up by this network in recent years, 25% turn out to be hits
and 75% turn out to be flops.
NARREND
What should the network do? What is their expected profit?
NARRBEGIN: SA_71_75
Wendy’s fast-food restaurant sells hamburgers and chicken sandwiches. On a typical
weekday, the demand for hamburgers is normally distributed with a mean of 450 and
standard deviation of 80 and the demand for chicken sandwiches is normally distributed
with a mean of 120 and standard deviation of 30. Use this information to answer the
following questions.
NARREND
How many hamburgers must the restaurant stock to be 99% sure of not running out on a
given day?

Algebraic models, by means of algebraic equations and inequalities, specify a set of
relationships in a very precise way. Their main drawback is that they require an ability
to work with abstract mathematical symbols.
NARRBEGIN: SA_91_102
Western Chassis produces high-quality polished steel and aluminum sheeting and two
lines of industrial chassis for the rack mounting of Internet routers, modems, and other
telecommunications equipment. The contribution margin (contribution toward profit)
for steel sheeting is $0.40 per pound and for aluminum sheeting is $0.60 per pound.
Western earns $12 contribution on the sale of a Standard chassis rack and $15
contribution on a Deluxe chassis rack. During the next production cycle, Western can
buy and use up to 25,800 pounds of raw unfinished steel either in sheeting or in chassis.
Similarly, 20,400 pounds of aluminum are available. One standard chassis rack requires
16 pounds of steel and 8 pounds of aluminum. A Deluxe chassis rack requires 12
pounds of each metal. The output of metal sheeting is restricted only by the capacity of
the polisher. For the next production cycle, the polisher can handle any mix of the two
metals up to 4,000 pounds of metal sheeting. Chassis manufacture can be restricted by
either metal stamping or assembly operations; no polishing is required. During the cycle
no more than 2,500 total chassis can be stamped, and there will be 920 hours of
assembly time available. The assembly time required is 24 minutes for the Standard
chassis rack and 36 minutes for the Deluxe chassis rack. Finally, market conditions
limit the number of Standard chassis racks sold to no more than 1,200 Standard and no
more than 1,000 Deluxe. Any quantities of metal sheeting can be sold.
NARREND
What is the objective function in this problem?
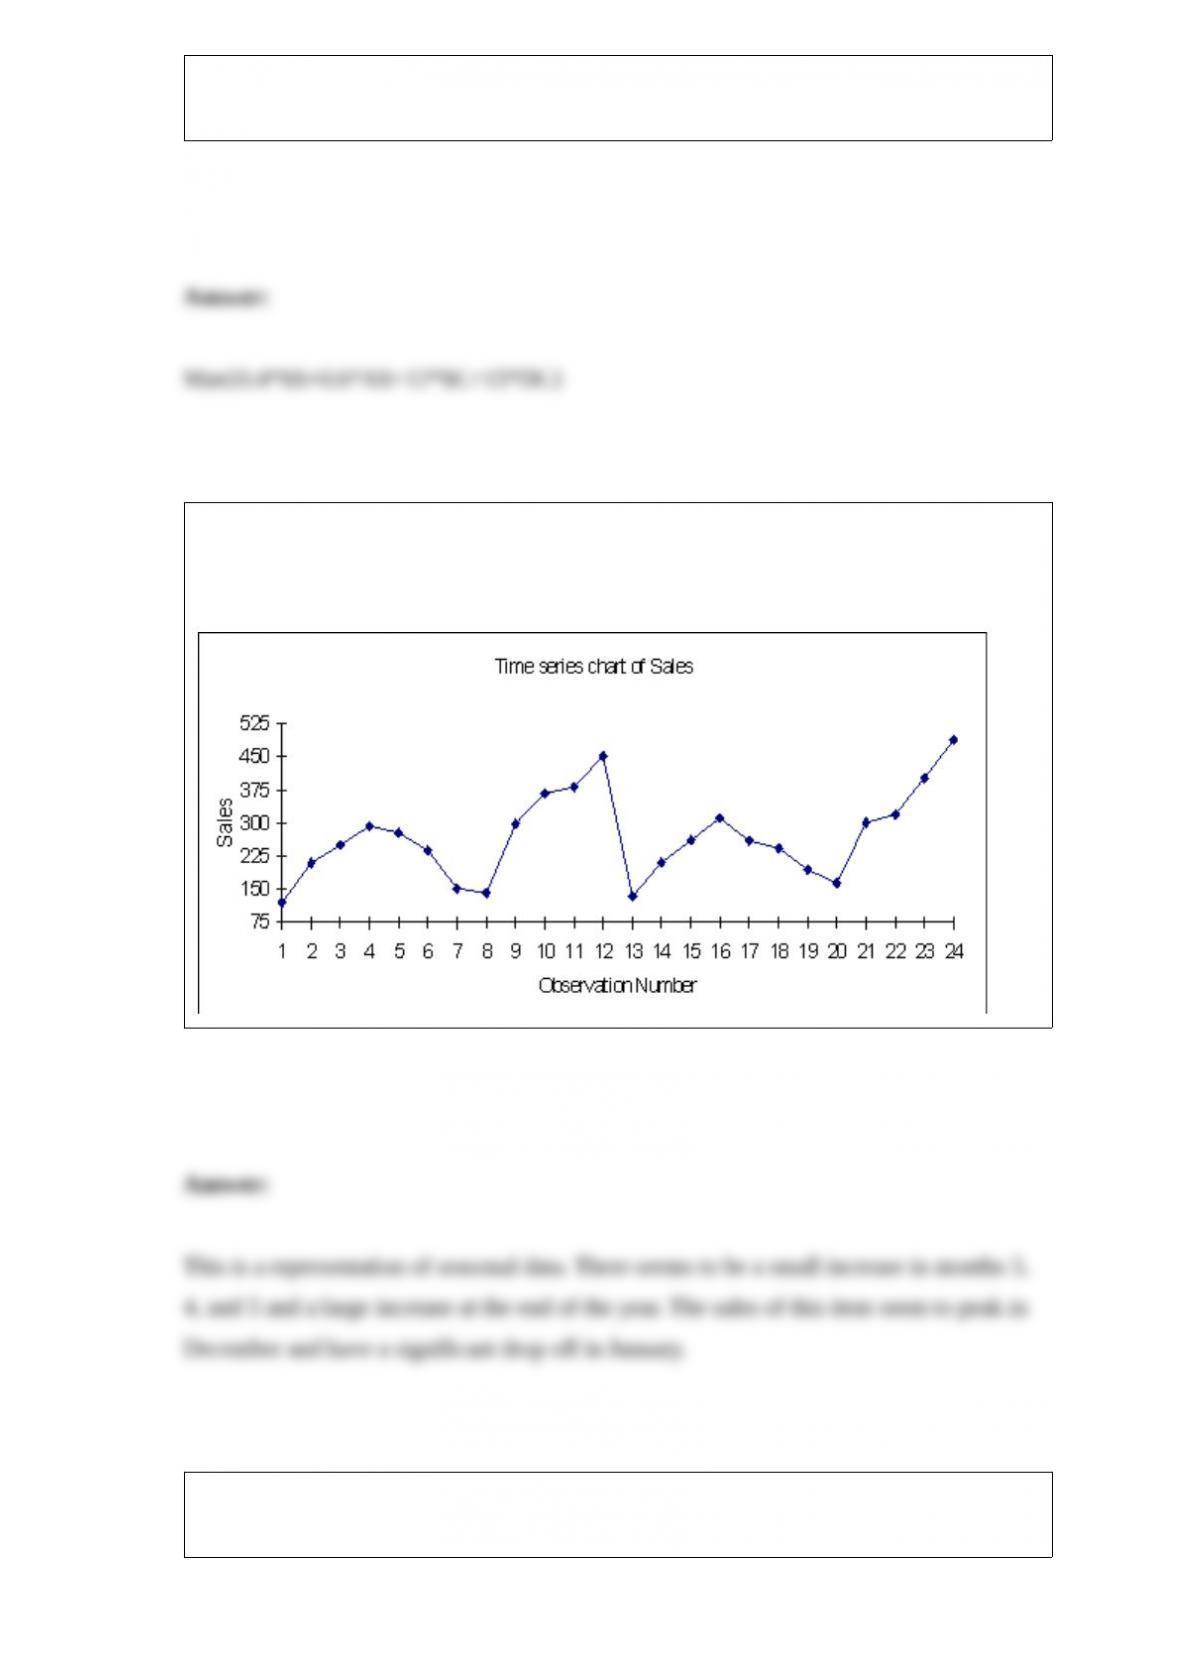
The data below represents monthly sales for two years of beanbag animals at a local
retail store (Month 1 represents January and Month 12 represents December). Given the
time series plot below, do you see any obvious patterns in the data? Explain.
Side-by-side boxplots allow you to quickly see how two or more categories of a
numerical variable compare

NARRBEGIN: SA_79_90
The service manager for a new appliances store reviewed sales records of the past 20
sales of new microwaves to determine the number of warranty repairs he will be called
on to perform in the next 90 days. Corporate reports indicate that the probability any
one of their new microwaves needs a warranty repair in the first 90 days is 0.05. The
manager assumes that calls for warranty repair are independent of one another and is
interested in predicting the number of warranty repairs he will be called on to perform
in the next 90 days for this batch of 20 new microwaves sold.
NARREND
What is the expected number of the new microwaves sold that will require a warranty
repair in the first 90 days?
NARRBEGIN: SA_95_100
A recent survey in Michigan revealed that 60% of the vehicles traveling on highways,
where speed limits are posted at 70 miles per hour, were exceeding the limit. Suppose
you randomly record the speeds of ten vehicles traveling on US 131 where the speed
limit is 70 miles per hour. Let X denote the number of vehicles that were exceeding the
limit.
NARREND
Describe the probability distribution of X.

In transportation problems, the three sets of input numbers that are required are
capacities, demands and flows.
If P(A and B) = 1, then A and B must be collectively exhaustive.
NARRBEGIN: SA_112_114
The number of arrivals at a local gas station between 3:00 and 5:00 P.M. has a Poisson
distribution with a mean of 12.
NARREND
Find the probability that the number of arrivals between 3:00 and 5:00 P.M. is at least
10.