Unlock document.
This document is partially blurred.
Unlock all pages and 1 million more documents.
Get Access

Four different shapes of histograms are commonly observed: symmetric, positively
skewed, negatively skewed, and bimodal.
NARRBEGIN: SA_79_81
In an effort to provide more consistent customer service, the manager of a local
fast-food restaurant would like to know the dispersion of customer service times about
their average value for the facility's drive-up window. The table below provides
summary measures for the customer service times (in minutes) for a sample of 50
customers collected over the past week.
NARREND
Interpret the variance and standard deviation of this sample.

When we sample less than 5% of the population, the finite population correction factor;
fpc = , is used to modify the formula for the standard error of the
sample mean.
NARRBEGIN: SA_79_90
The service manager for a new appliances store reviewed sales records of the past 20
sales of new microwaves to determine the number of warranty repairs he will be called
on to perform in the next 90 days. Corporate reports indicate that the probability any
one of their new microwaves needs a warranty repair in the first 90 days is 0.05. The
manager assumes that calls for warranty repair are independent of one another and is
interested in predicting the number of warranty repairs he will be called on to perform
in the next 90 days for this batch of 20 new microwaves sold.
NARREND
What is the probability that exactly two of the 20 new microwaves sold will require a
warranty repair in the first 90 days?
NARRBEGIN: SA_74_75
Statistics professor has just given a final examination in his statistical inference course.
He is particularly interested in learning how his class of 40 students performed on this
exam. The scores are shown below.

77 81 74 77 79 73 80 85 86 73
83 84 81 73 75 91 76 77 95 76
90 85 92 84 81 64 75 90 78 78
82 78 86 86 82 70 76 78 72 93
NARREND
What are the mean and median scores on this exam?
For a risk averse decision maker, the certainty equivalent is less than the expected
monetary value (EMV).
NARRBEGIN: SA_104_112
Mrs. Rich has just bought a new $30,000 car. As a reasonably safe driver, she believes
that there is only a 5% chance of being in an accident in the forthcoming year. If she is
involved in an accident, the damage to her new car depends on the severity of the
accident. The probability distribution for the range of possible accidents and the
corresponding damage amounts (in dollars) are shown in the table below. Mrs. Rich is
trying to decide whether she is willing to pay $170 each year for collision insurance
with a $300 deductible. Note that with this type of insurance, she pays the first $300 in
damages if she causes an accident, and the insurance company pays the remainder.
Distribution of Accident Types and Corresponding Damage Amounts

NARREND
Formulate a payoff table that specifies the cost (in dollars) associated with each
possible decision and type of accident.
NARRBEGIN: SA_84_90
A sporting goods store sells two competing brands of softball bats. Let and be
the numbers of the two brands sold on a typical day at the store. Based on the store
historical data, the conditional probability distribution of given is assessed and
provided in the table below. The marginal distribution of is also given in the bottom
row of the table.
Sales of Brand 1, Given sales of Brand 2

NARREND
What is the probability of observing the sale of at least one brand 1 bat on a given day
at this sporting goods store?
The feasible region in a graphical solution of a linear programming problem will appear
as some type of polygon, with lines forming all sides.
The expected value of perfect information (EVPI) is the difference between the EMV

with perfect information and the EMV with no additional information.
Uncertain timing and the events that follow in process modeling can be modeled using
IF statements.
If the span of a moving average is large " say, 12 months " then few observations go
into each average, and extreme values have relatively large effect on the forecasts.
A test for independence is applied to a contingency table with 4 rows and 4 columns.
The degrees of freedom for this chi-square test must equal 9.
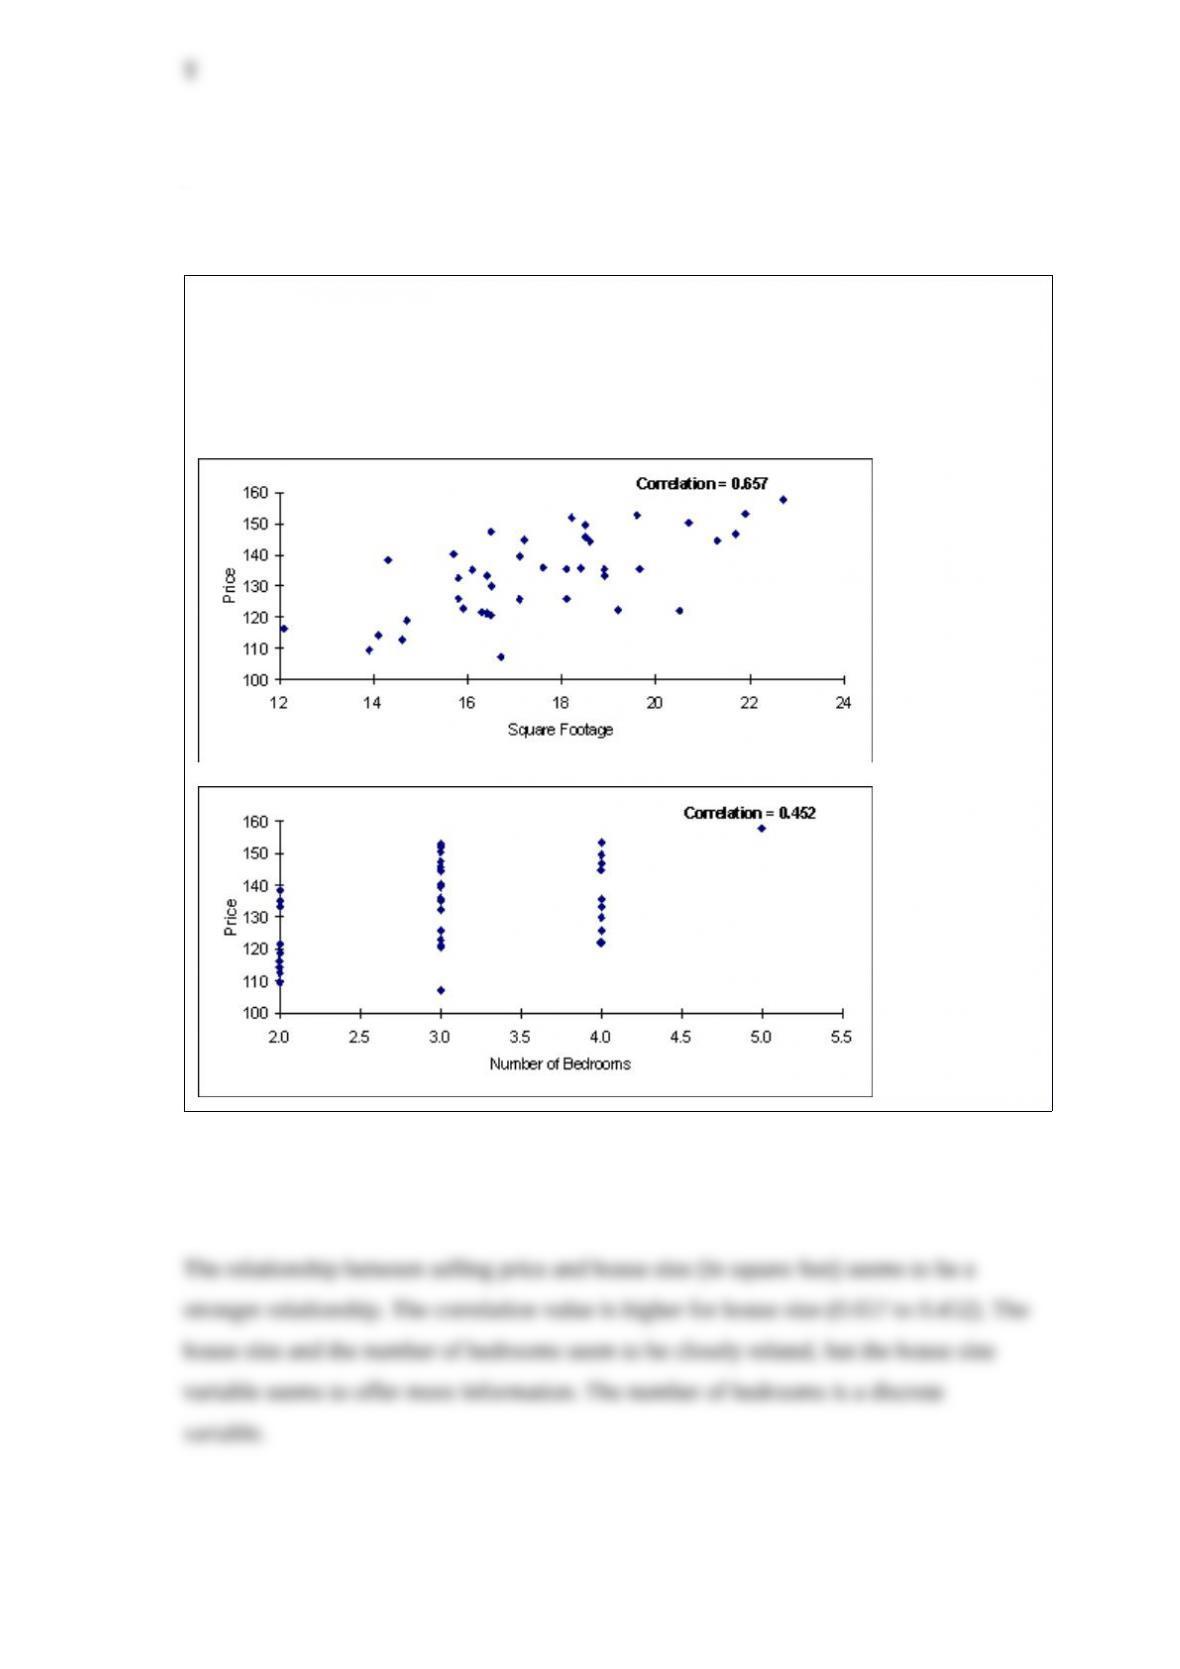
There are two scatterplots shown below. The first chart shows the relationship between
the size of the home and the selling price. The second chart examines the relationship
between the number of bedrooms in the home and its selling price. Which of these two
variables (the size of the home or the number of bedrooms) seems to have the stronger
relationship with the home's selling price? Justify your answer.


