
In an ANOVA test, the alternative hypothesis is that at least one population mean is
different from the others.
If the sample is a good representation of the population, what percentage of the students
in the population should we expect to spend the weekend studying and do poorly on the
final exam?
NARRBEGIN: SA_79_82
The Waco Tire Company (WTC) is considering expanding production to meet possible
increases in demand. WTC’s alternatives are to construct a new plant, expand the
existing plant, or do nothing in the short run. It will cost them $1 million to build a new
facility and $600,000 to expand their existing facility. The market for this particular
product may expand, remain stable, or contract. ETC’s marketing department estimates
the probabilities of these market outcomes as 0.30, 0.45, and 0.25, respectively. The
expected revenue for each alternative is presented in the table below.
NARREND
Generate a risk profile for each of WTC’s possible decisions in this problem.
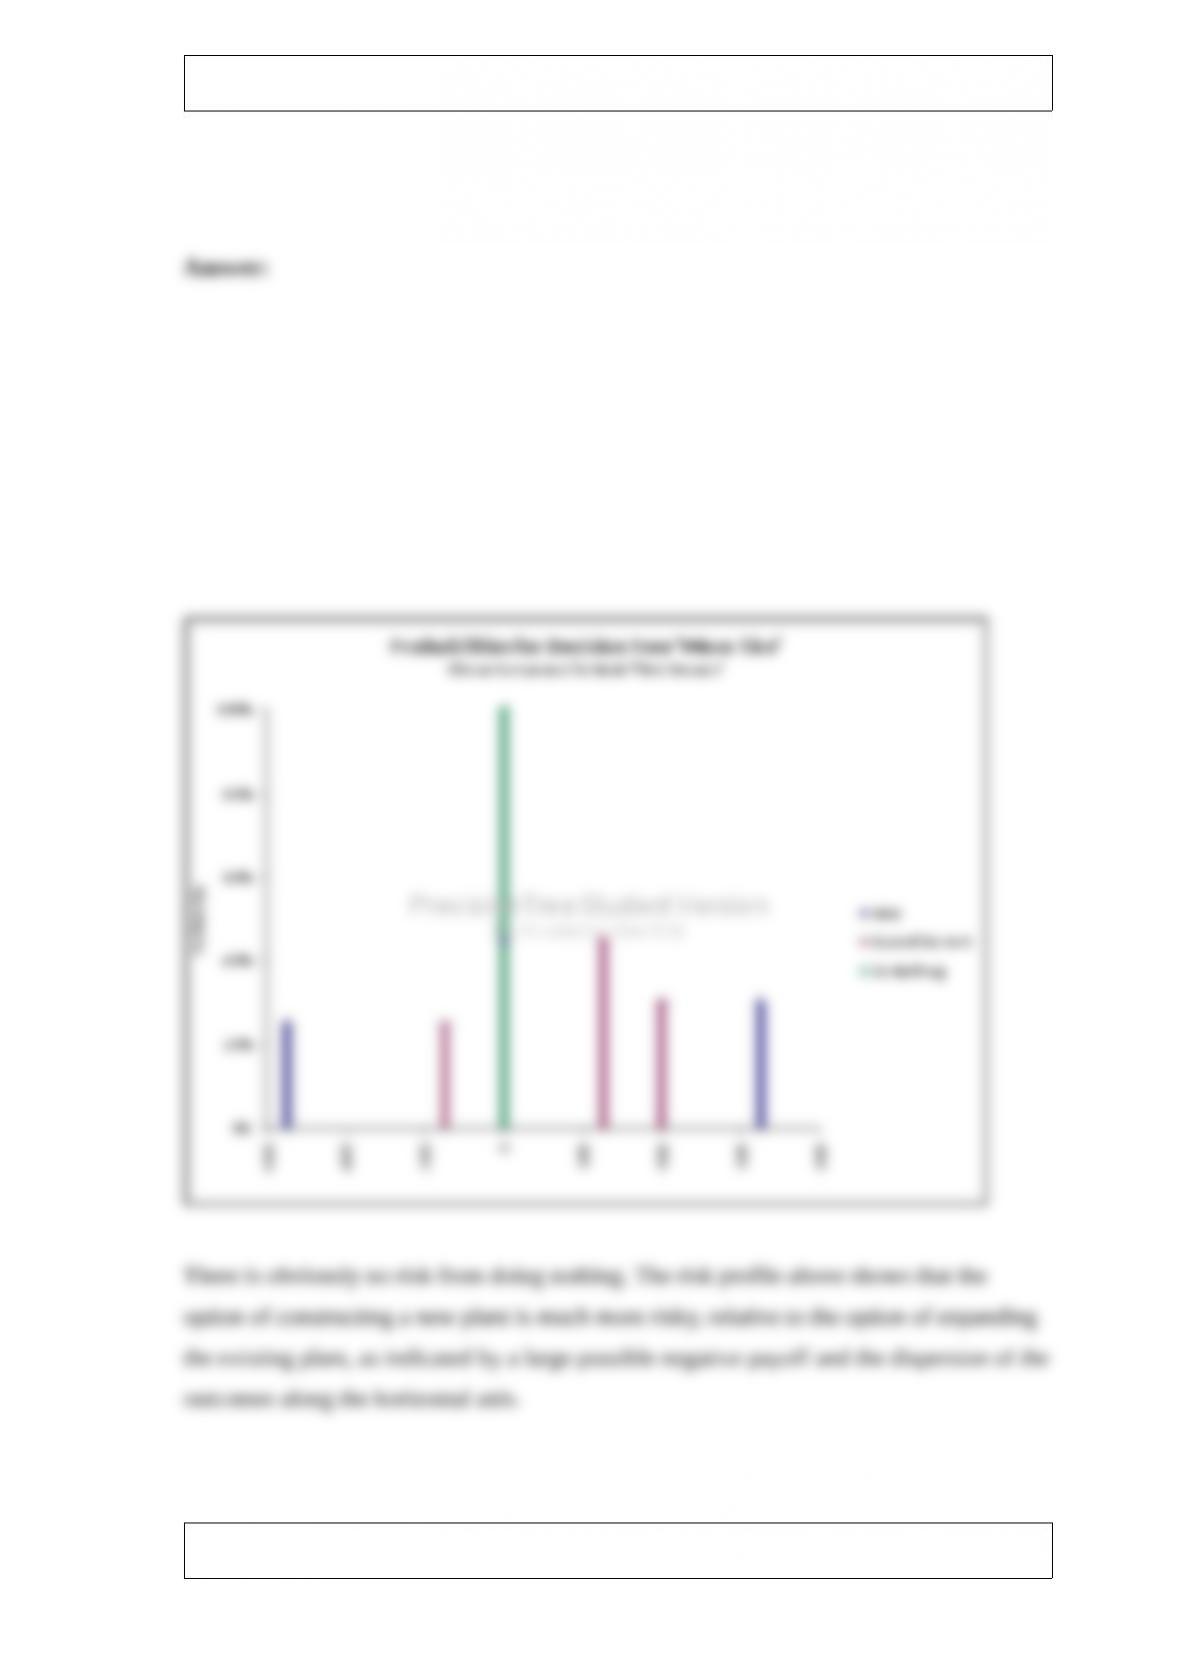
Characterize the differences in risk for the different options.
In regression analysis, homoscedasticity refers to constant error variance.

Data can be categorized as cross-sectional or time series.
NARRBEGIN: SA_79_90
The service manager for a new appliances store reviewed sales records of the past 20
sales of new microwaves to determine the number of warranty repairs he will be called
on to perform in the next 90 days. Corporate reports indicate that the probability any
one of their new microwaves needs a warranty repair in the first 90 days is 0.05. The
manager assumes that calls for warranty repair are independent of one another and is
interested in predicting the number of warranty repairs he will be called on to perform
in the next 90 days for this batch of 20 new microwaves sold.
NARREND
What type of probability distribution will most likely be used to analyze warranty repair
needs on new microwaves in this situation?

What happens to the revenue when the optimal plan changes to the one given in
Question 118?
The total area under the normal distribution curve is equal to one.
NARRBEGIN: SA_121_124
A continuous random variable X has the probability density function: f(x) = 2 , 0
NARREND
What is the distribution of X and what are the parameters?
NARRBEGIN: SA_108_112
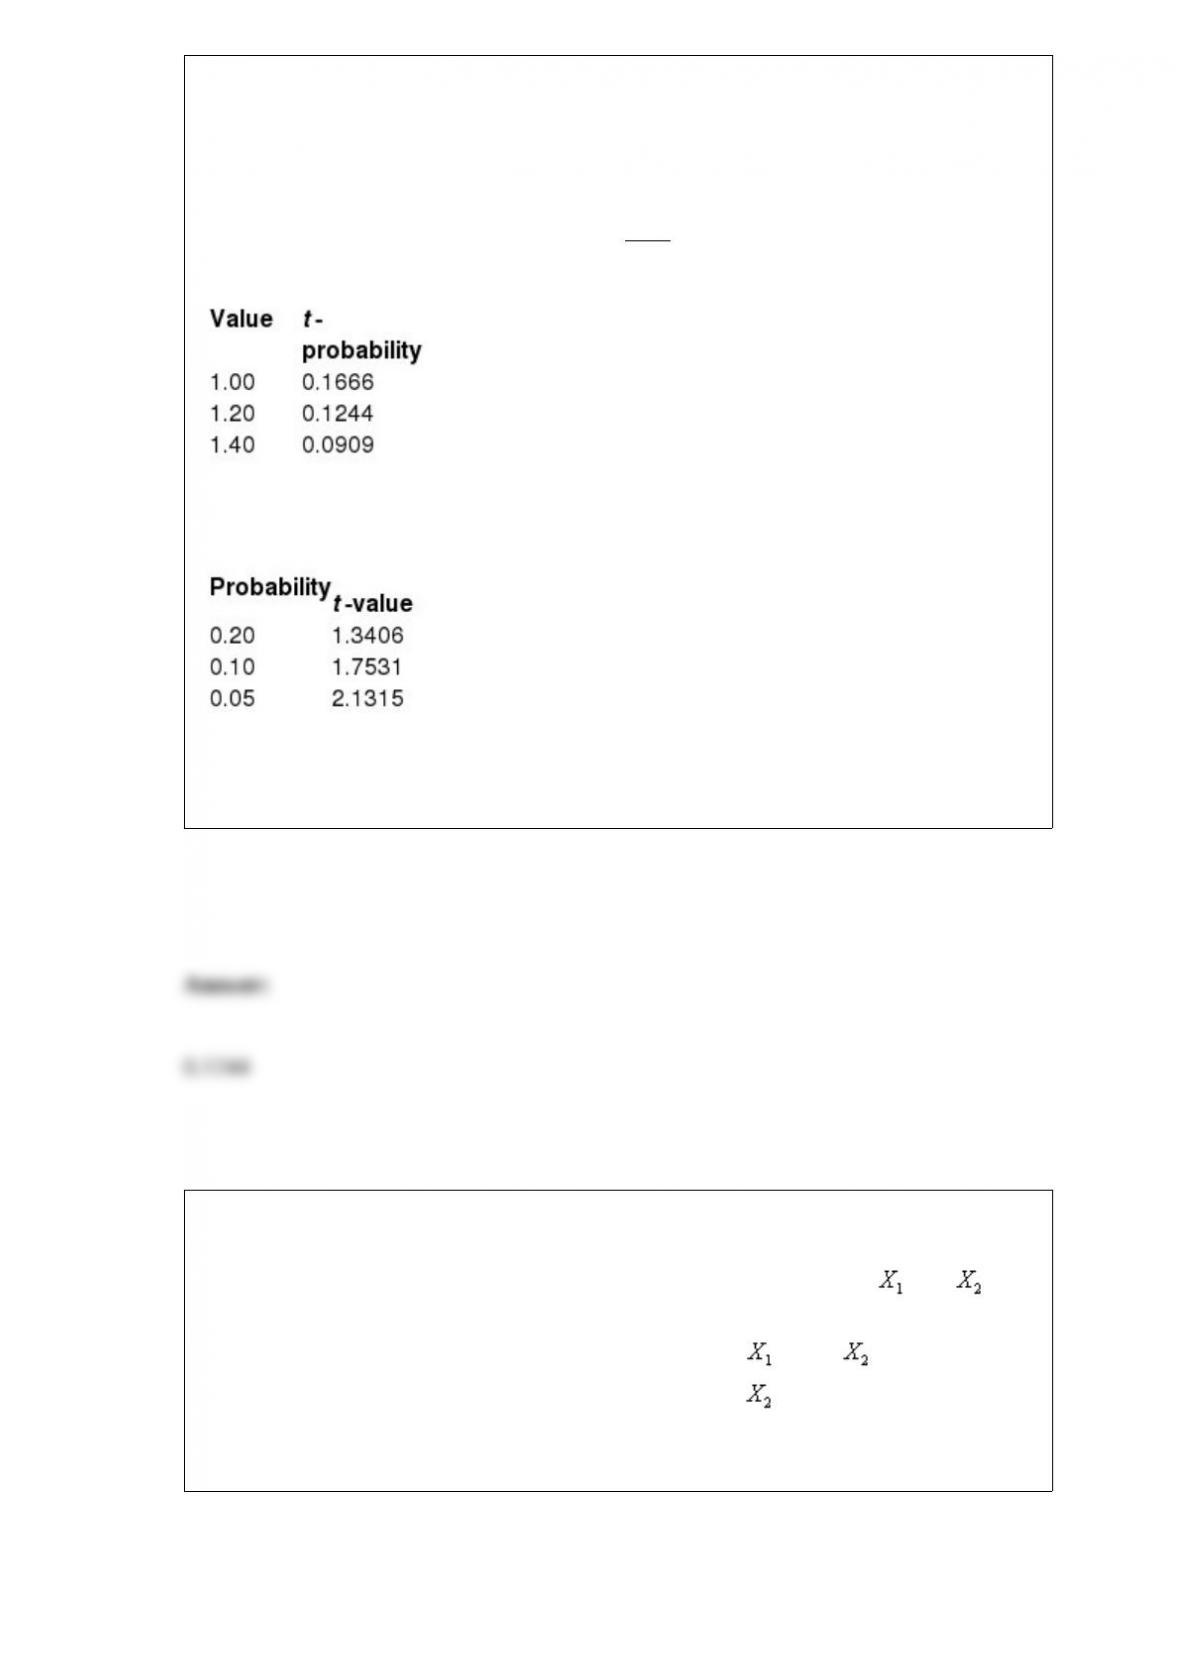
The following values have been calculated using the TDIST and TINV functions in
Excel. These values come from a t- distribution with 15 degrees of freedom.
These values represent the probability to the right of the given positive values.
These values represent the positive t- value for a given probability in both tails (sum of
both tails).
NARREND
What is the probability of a t-value larger than 1.20?
NARRBEGIN: SA_84_90
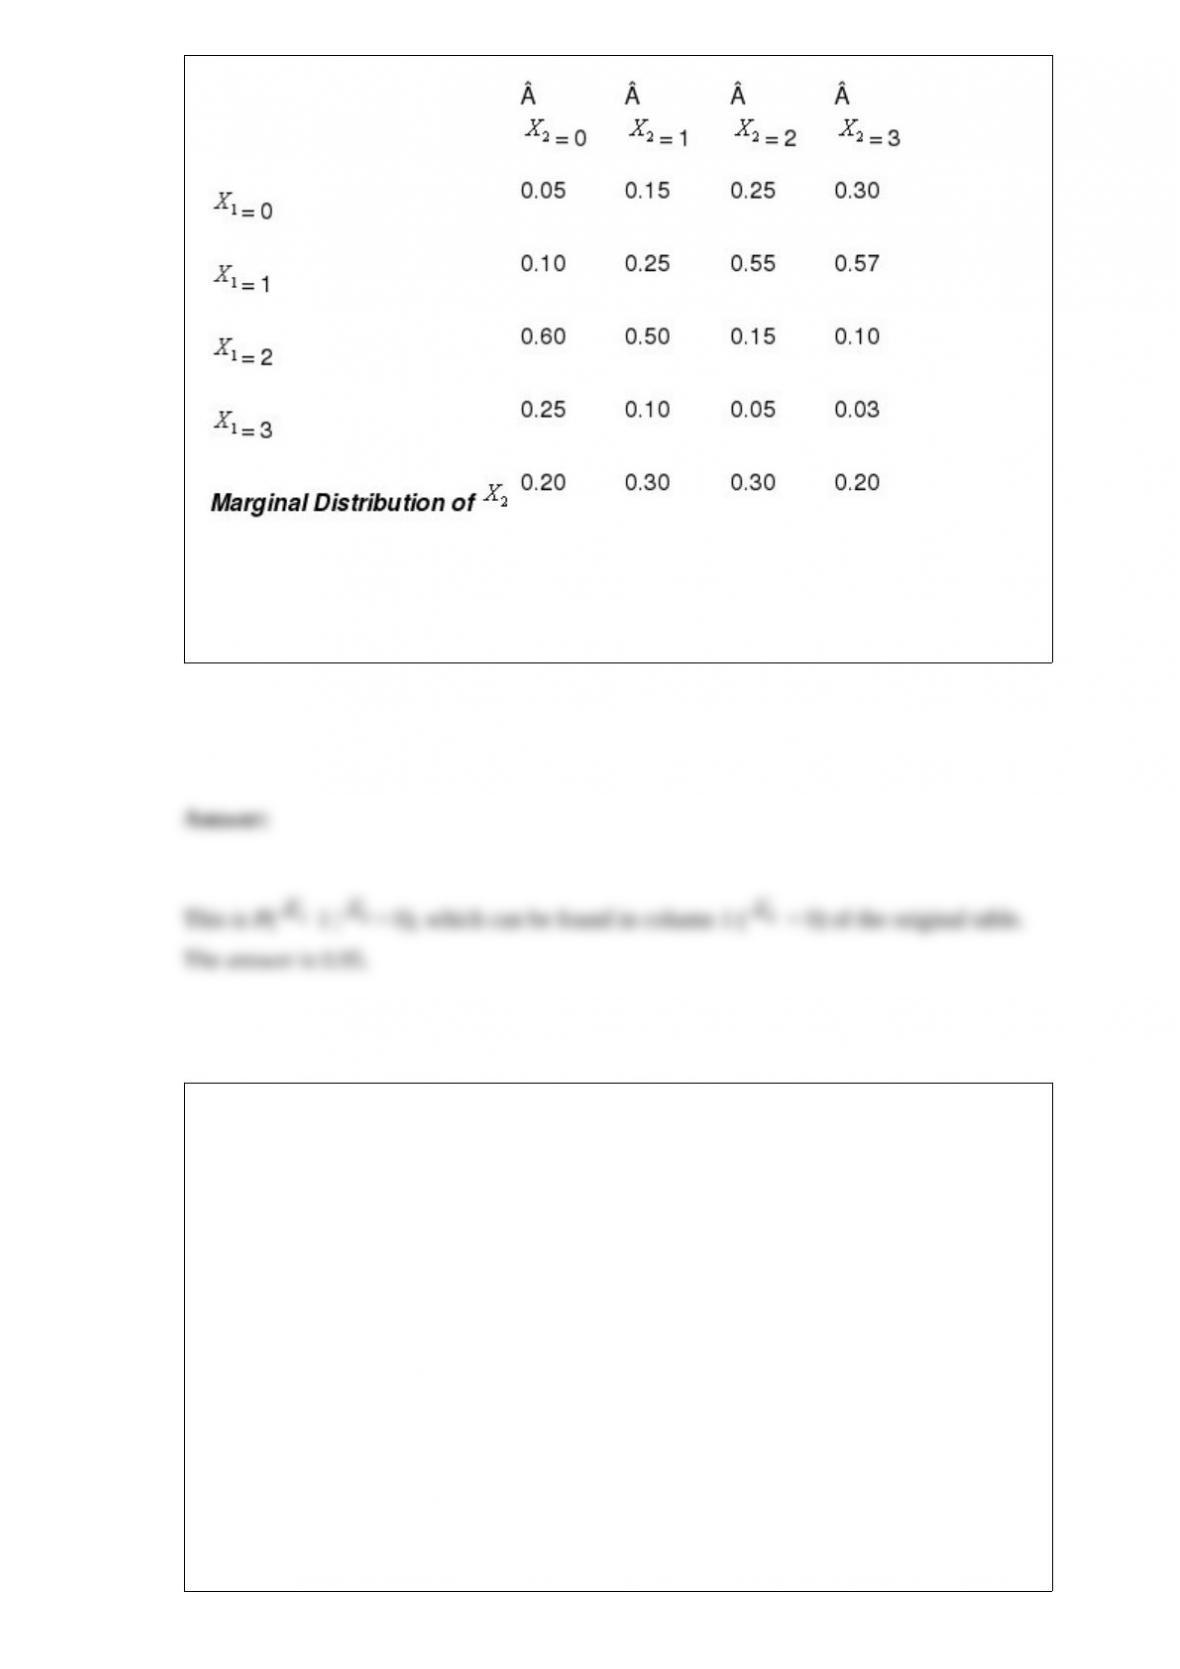
A sporting goods store sells two competing brands of softball bats. Let and be
the numbers of the two brands sold on a typical day at the store. Based on the store
historical data, the conditional probability distribution of given is assessed and
provided in the table below. The marginal distribution of is also given in the bottom
row of the table.
Sales of Brand 1, Given sales of Brand 2
NARREND
Given that no brand 2 bats are sold on a given day, what is the probability of observing
the sale of at least one brand 1 bicycle at this sporting goods store?
NARRBEGIN: SA_56_61
A popular retail store knows that the distribution of purchase amounts by its customers
is approximately normal with a mean of $30 and a standard deviation of $9. Below you
will find normal probability and percentile calculations related to the customer purchase
amounts.
Probability Calculations
P(Sales < $ 15.00) = 0.048, P(Sales < $ 20.00) = 0.133,
P(Sales < $ 25.00) = 0.289, P(Sales < $ 35.00) = 0.711
Percentiles Calculations
1st Percentile = $9.06, 5th Percentile = $15.20,
95th Percentile = $44.80, 99th Percentile = $50.94
NARREND

What is the probability that a randomly selected customer will spend between $20 and
$35?
A sample of size 20 is selected at random from a population of size N. If the finite
population correction factor is 0.9418, then N must be 169.
Integer programming (IP) models are optimization models in which all of the variables
must be integers.
NARRBEGIN: SA_47_49
Below you will find current annual salary data and related information for 30
employees at Gamma Technologies, Inc. These data include each selected employees
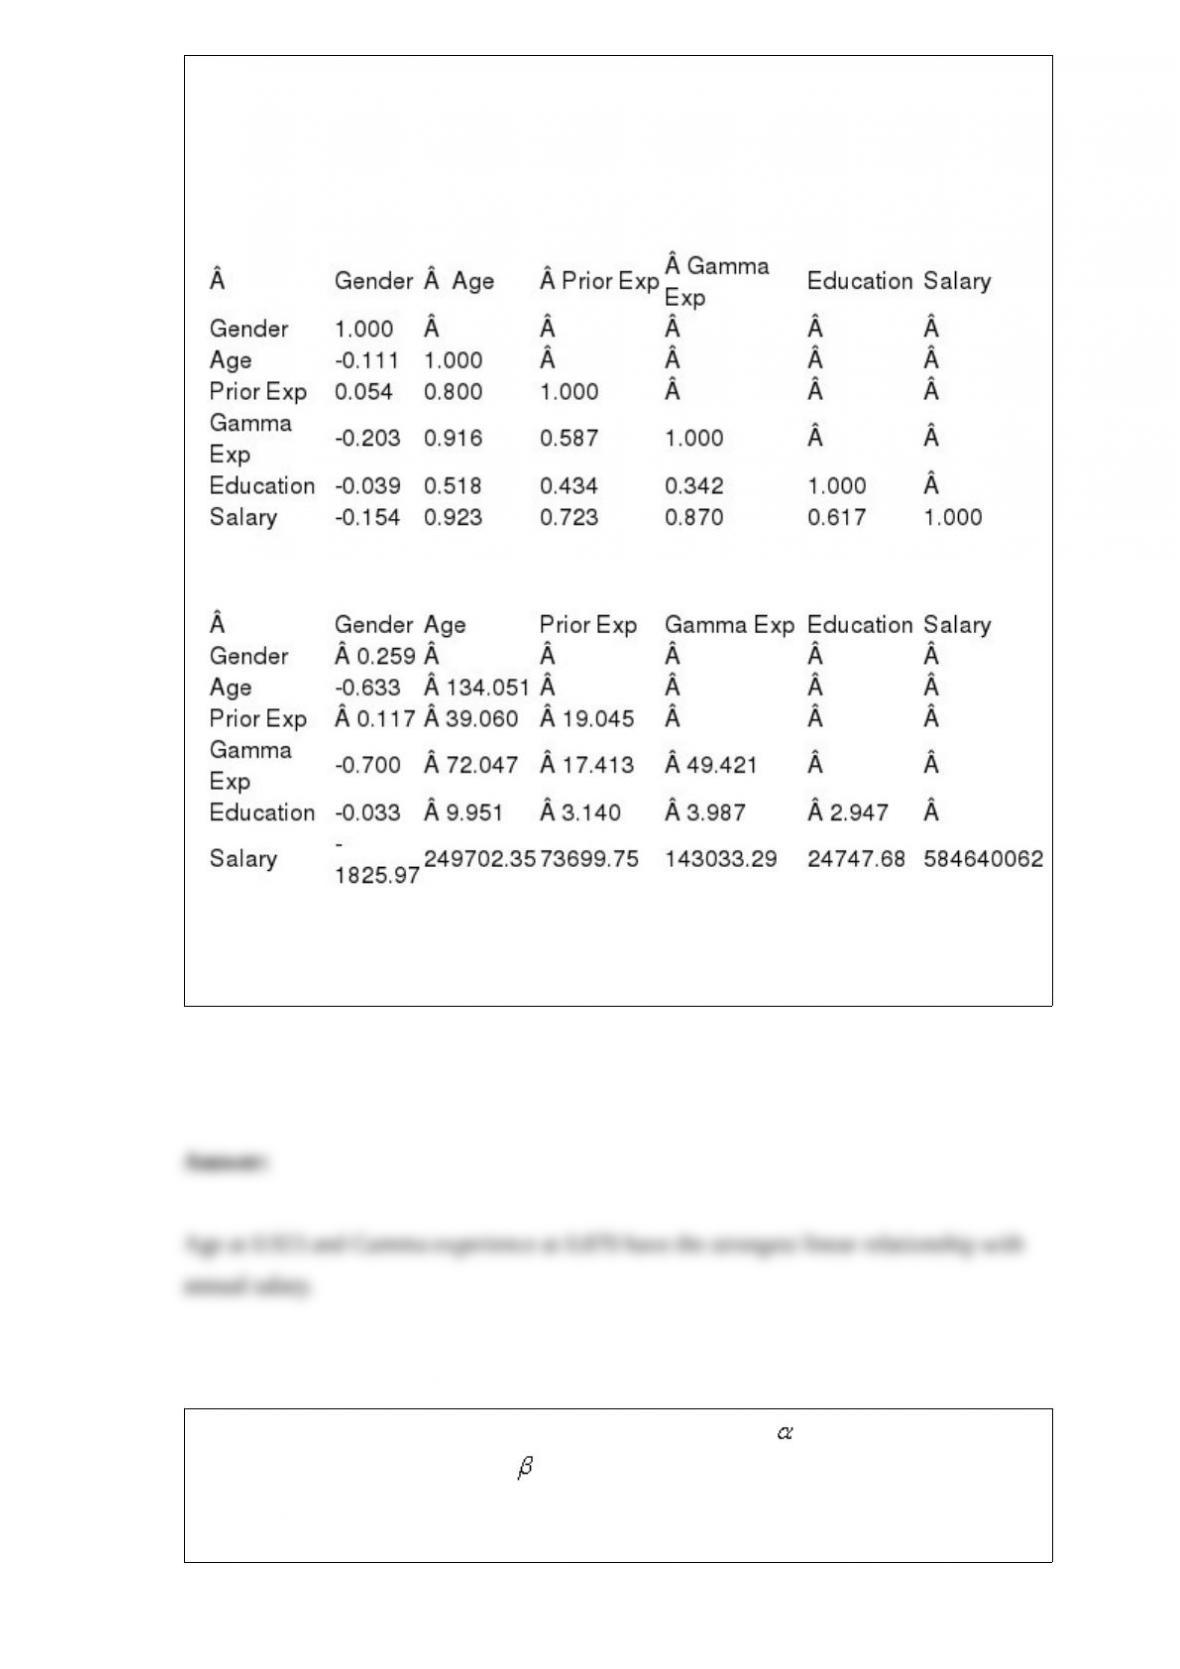
gender (1 for female; 0 for male), age, number of years of relevant work experience
prior to employment at Gamma, number of years of employment at Gamma, the
number of years of post-secondary education, and annual salary. The tables of
correlations and covariances are presented below.
Table of Correlations
Table of Covariances (variances on the diagonal)
NARREND
Which two variables have the strongest linear relationship with annual salary?
If we use a value close to 1 for the level smoothing constant and a value close to 0
for the trend smoothing constant in Holt’s exponential smoothing model, then we
expect the model to respond very quickly to changes in the level, but very slowly to
changes in the trend.

Cross-sectional data are usually data gathered from approximately the same period of
time from a cross-sectional of a population.
If a random series has too few runs, then it is zigzagging too often.