
The expected value of perfect information (EVPI) is the most the decision maker would
be willing to pay for the sample information.
In transportation problems, shipping costs are often nonlinear due to quantity discounts.
The F-test of the analysis of variance requires that the populations are normally
distributed with equal variances.
NARRBEGIN: SA_84_86
An oil company produces oil at two wells. Well 1 can produce up to 150,000 barrels per
day, and well 2 can produce up to 200,000 barrels per day. It is possible to ship oil
directly from the wells to customers in Los Angeles and New York. Alternatively, the
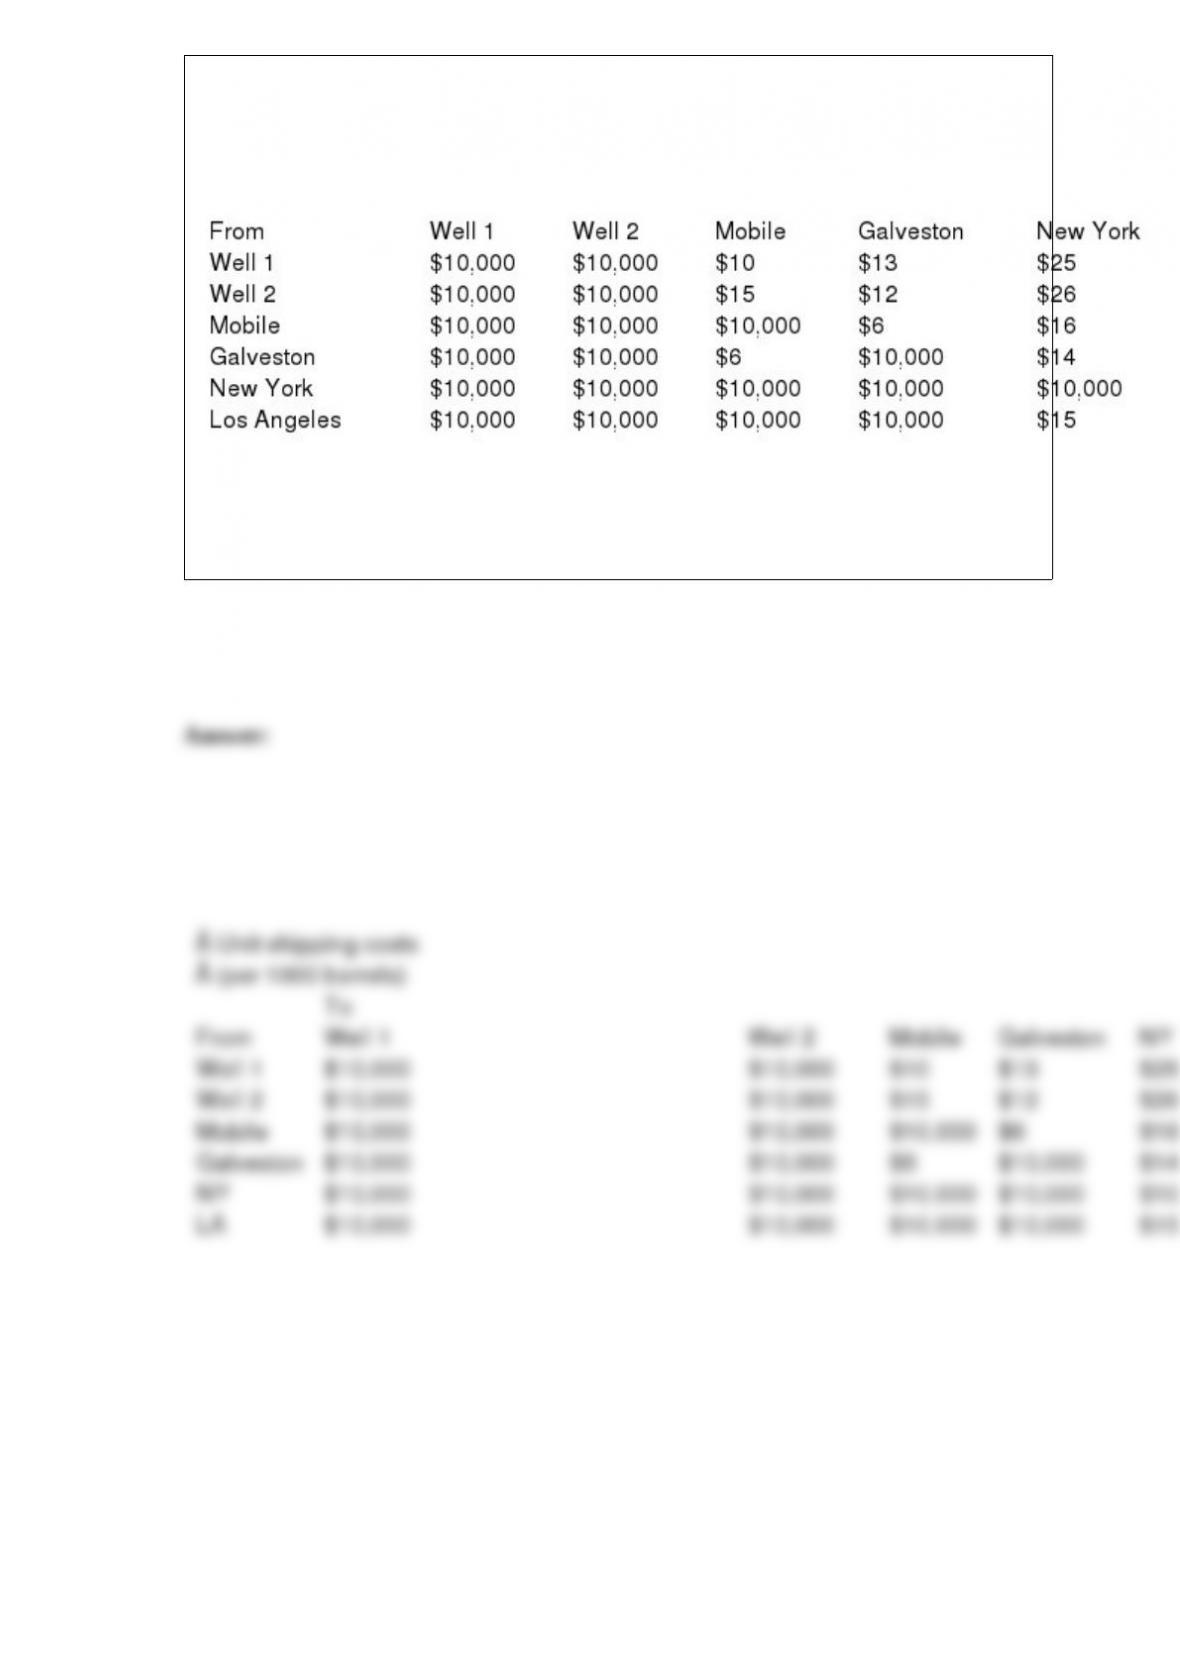
company could transport oil to the ports of Mobile and Galveston and then ship it by
tanker to New York or Los Angeles. Los Angeles requires 160,000 barrels per day, and
New York requires 140,000 barrels per day. The costs (in dollars) of shipping 1000
barrels between various locations are shown below:
NARREND
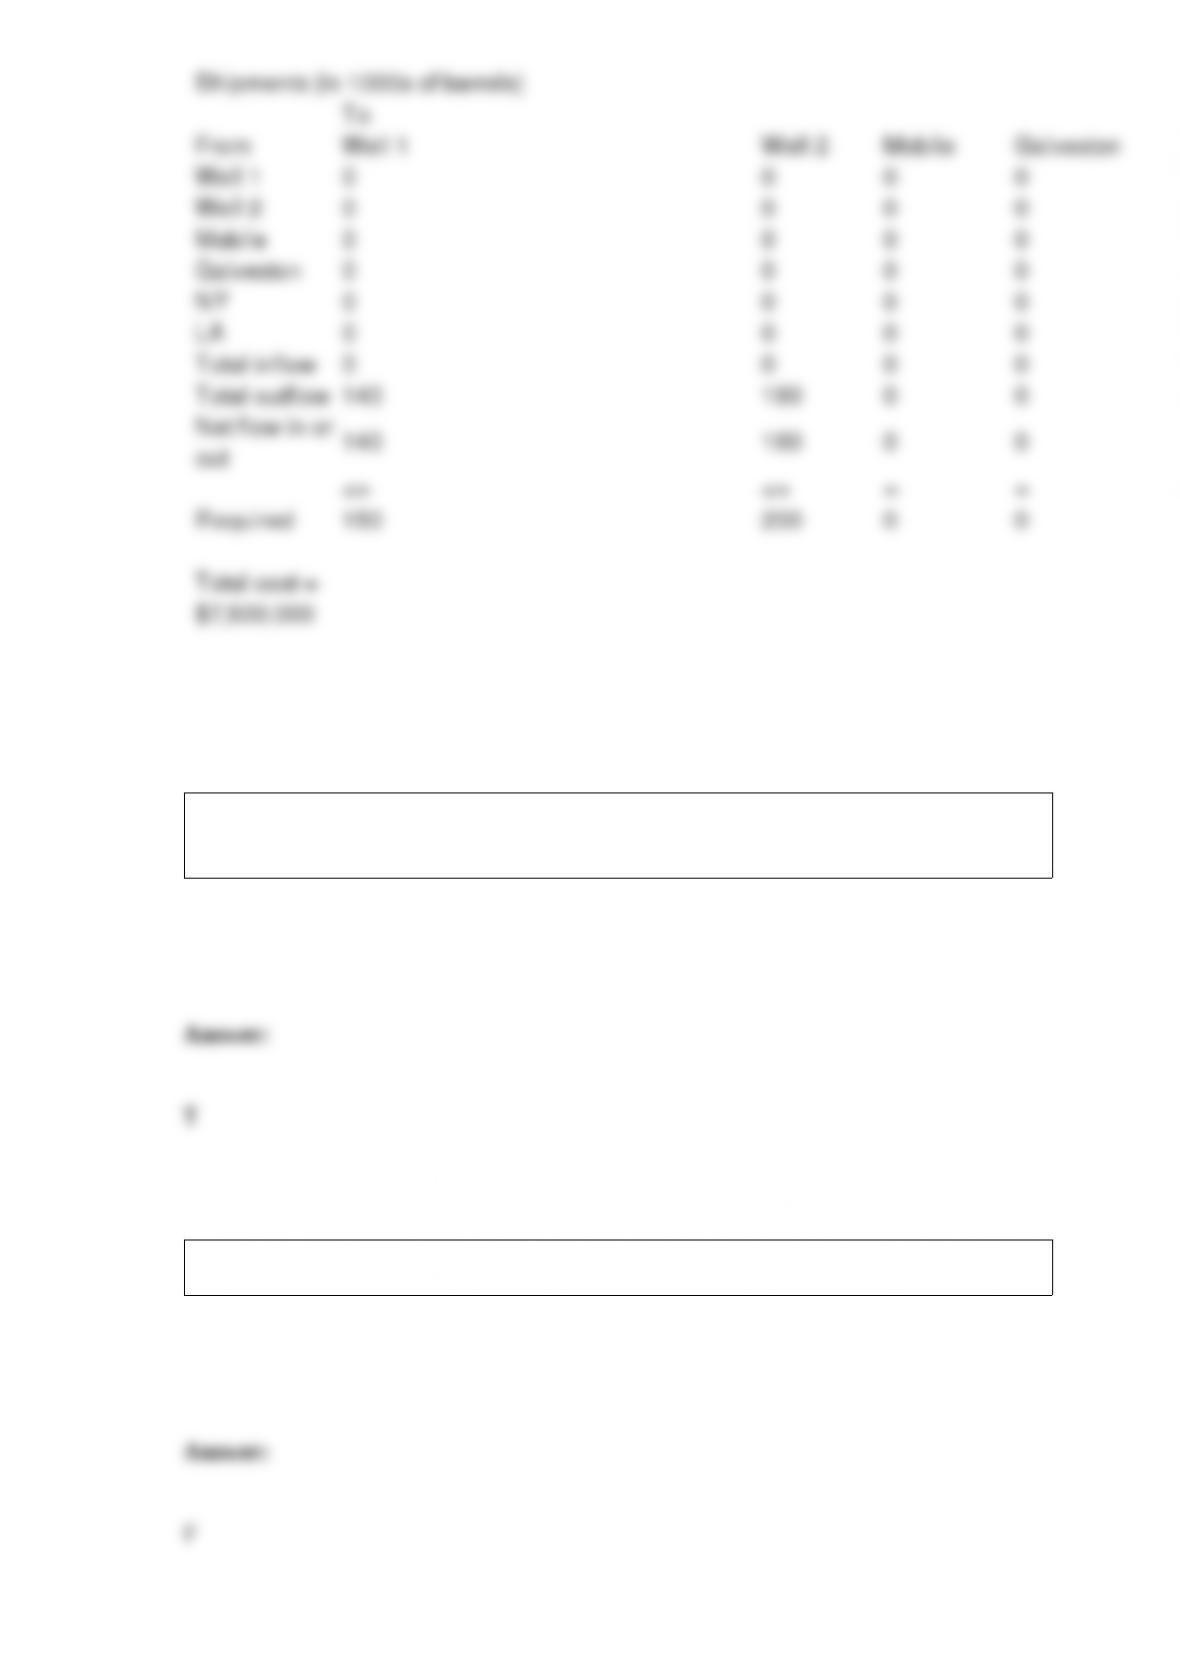
Determine how to minimize the transportation cost in meeting the oil demands of Los
Angeles and New York.
If the regression equation includes anything other than a constant plus the sum of
products of constants and variables, the model will not be linear
The multiplication rule for two events A and B is: P(A and B) = P(A|B)P(A).

The time series component that reflects a long-term, relatively smooth pattern or
direction exhibited by a time series over a long time period, is called seasonal.
If a time series exhibits an exponential trend, then a plot of its logarithm should be
approximately linear.
Simple random sampling can result in under-representation or over-representation of
certain segments of the population. This is one of several reasons that simple random
samples are almost never used in real applications.
In every regression study there is a single variable that we are trying to explain or
predict. This is called the response variable or dependent variable.
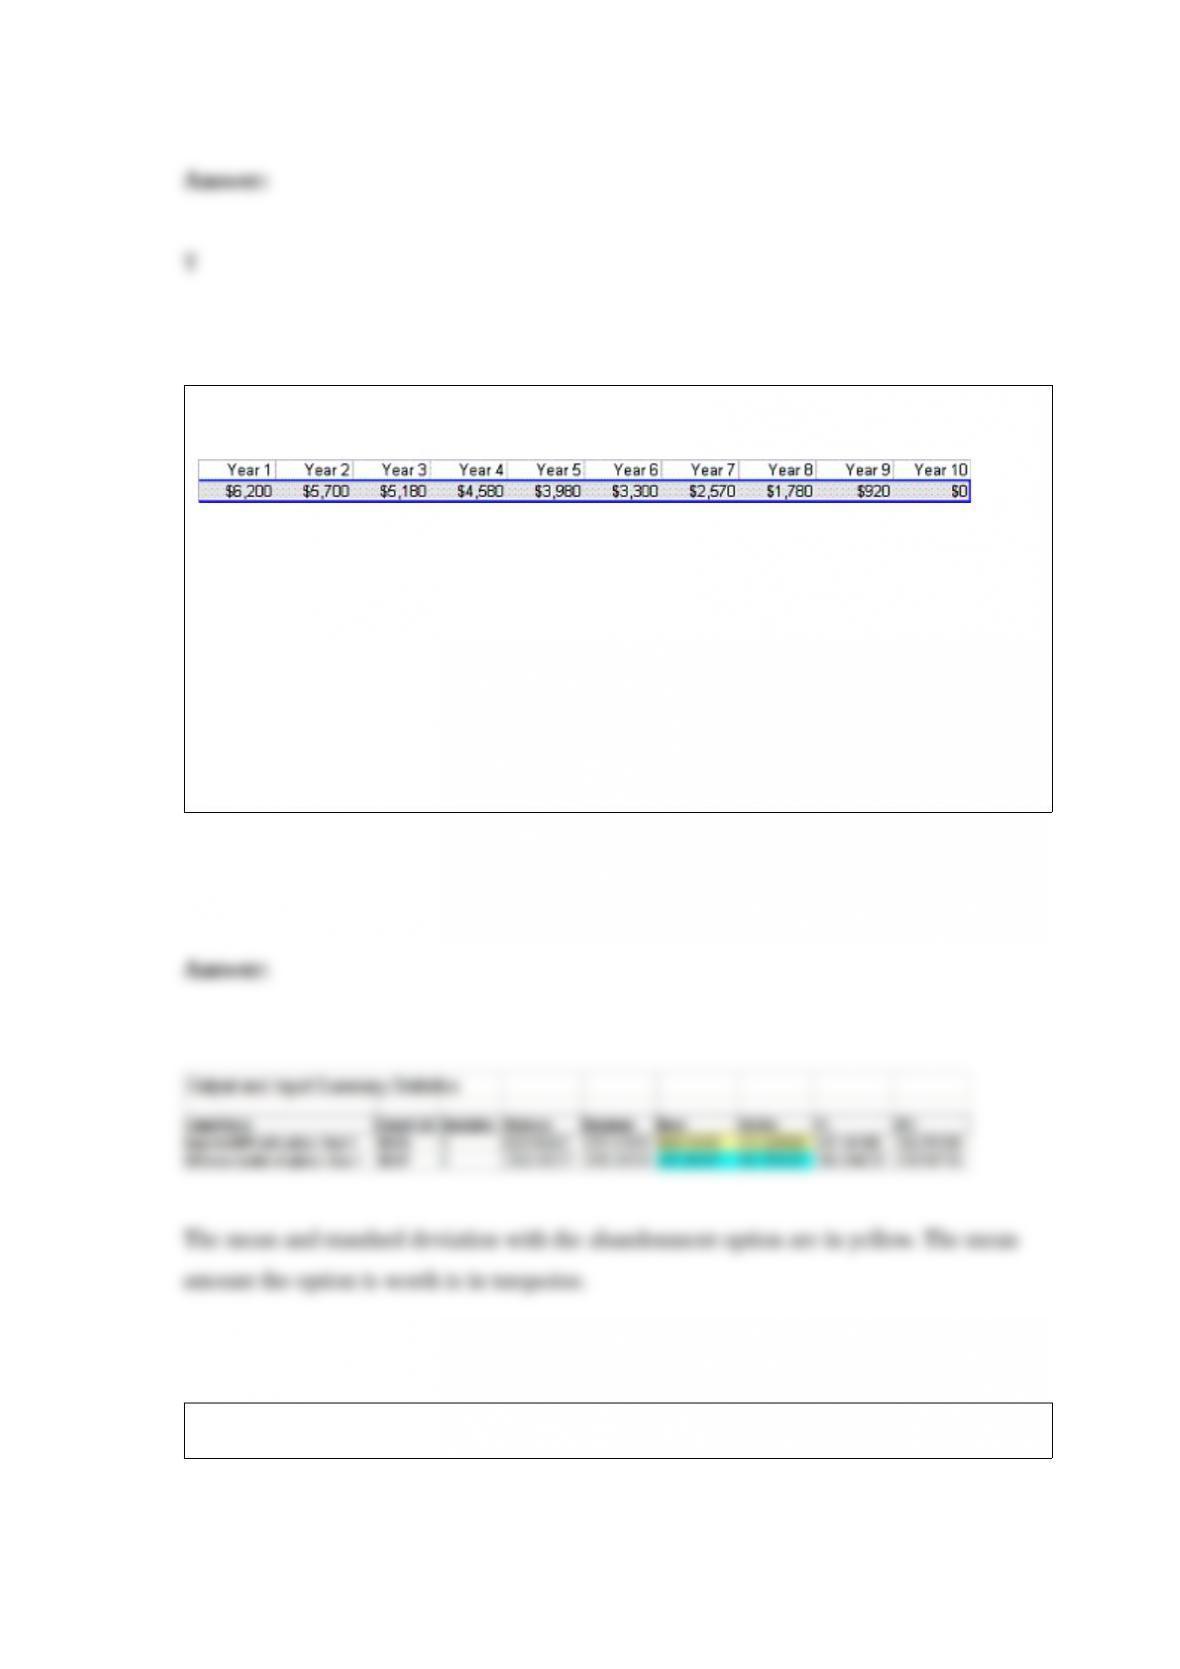
Now assume that the project has an abandonment option. At the end of each year you
can abandon the project for the values given below:
For example, suppose that year 1 cash flow is $400. Then at the end of year 1, you
expect cash flow for each remaining year to be $400. This has an NPV of less than
$6200, so you should abandon the project and collect $6200 at the end of year 1.
Estimate the mean and standard deviation of the project with the abandonment option.
How much would you pay for the abandonment option? (Hint: You can abandon a
project at most once. Thus in year 5, for example, you abandon only if the sum of future
expected NPVs is less than the year 5 abandonment value and the project has not yet
been abandoned. Also, once you abandon the project, the actual cash flows for future
years will 0. So the future cash flows after abandonment should disappear.)
Using the standard normal curve, the Z– score representing the 10th percentile is 1.28.

NARRBEGIN: SA_91_102
Western Chassis produces high-quality polished steel and aluminum sheeting and two
lines of industrial chassis for the rack mounting of Internet routers, modems, and other
telecommunications equipment. The contribution margin (contribution toward profit)
for steel sheeting is $0.40 per pound and for aluminum sheeting is $0.60 per pound.
Western earns $12 contribution on the sale of a Standard chassis rack and $15
contribution on a Deluxe chassis rack. During the next production cycle, Western can
buy and use up to 25,800 pounds of raw unfinished steel either in sheeting or in chassis.
Similarly, 20,400 pounds of aluminum are available. One standard chassis rack requires
16 pounds of steel and 8 pounds of aluminum. A Deluxe chassis rack requires 12
pounds of each metal. The output of metal sheeting is restricted only by the capacity of
the polisher. For the next production cycle, the polisher can handle any mix of the two
metals up to 4,000 pounds of metal sheeting. Chassis manufacture can be restricted by
either metal stamping or assembly operations; no polishing is required. During the cycle
no more than 2,500 total chassis can be stamped, and there will be 920 hours of
assembly time available. The assembly time required is 24 minutes for the Standard
chassis rack and 36 minutes for the Deluxe chassis rack. Finally, market conditions
limit the number of Standard chassis racks sold to no more than 1,200 Standard and no
more than 1,000 Deluxe. Any quantities of metal sheeting can be sold.
NARREND
What are the constraints in this problem?
A correlation matrix must always be symmetric, so that the correlations above the
diagonal are a mirror image of those below it.

If the sample is a good representation of the population, what percentage of those who
spent the weekend studying should we expect to do poorly on the final exam?
The sampling distribution of any point estimate (such as the sample mean or
proportion) is the distribution of the point estimates we would obtain from all possible
samples of a given size drawn from the population.
NARRBEGIN: SA_86_89
A buyer for a large sporting goods store chain must place orders for professional
footballs with the football manufacturer six months prior to the time the footballs will
be sold in the stores. The buyer must decide in November how many footballs to order
for sale during the upcoming late summer and fall months. Assume that each football
costs the chain $45. Furthermore, assume that each pair can be sold for a retail price of
$90. If the footballs are still on the shelves after next Christmas, they can be discounted
and sold for $35 each. The probability distribution of consumer demand for these
footballs (in hundreds) during the upcoming season has been assessed by the market
research specialists and is presented below. Finally, assume that the sporting goods store
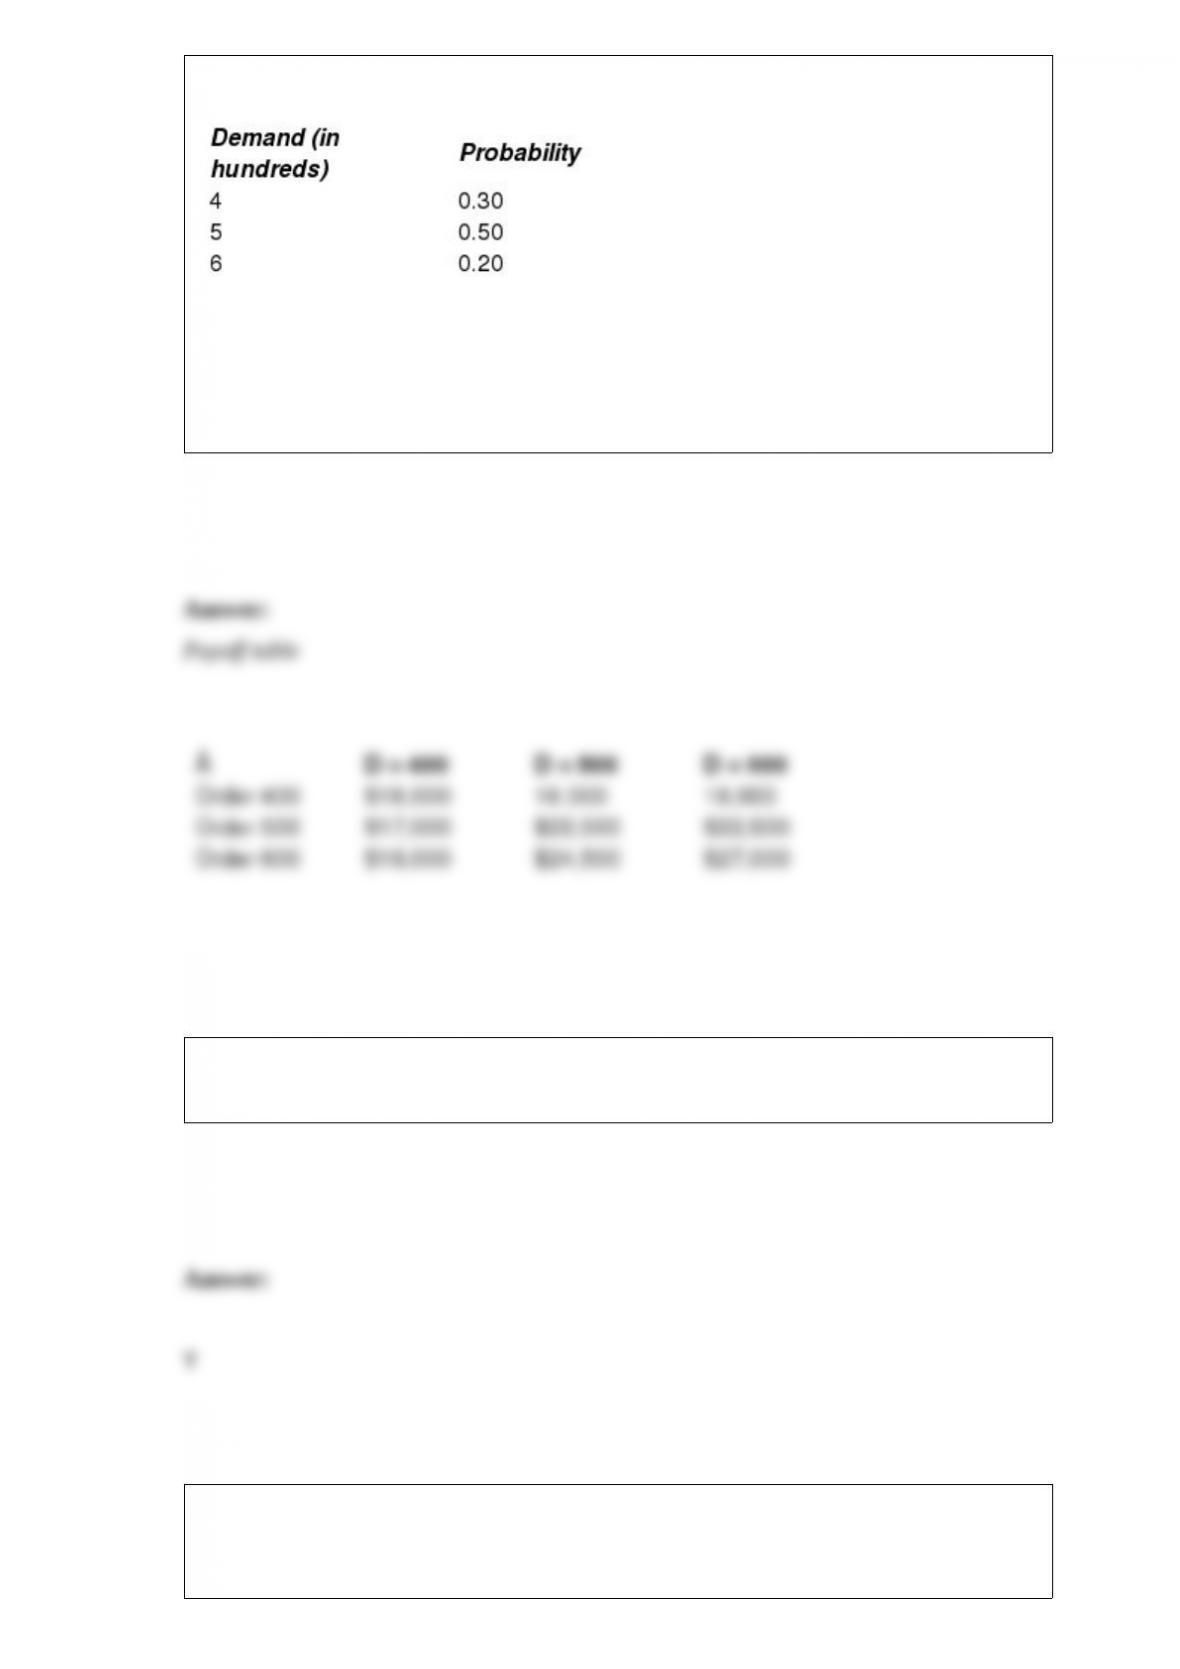
chain must purchase the footballs in lots of 100 units.
NARREND
Formulate a payoff table that specifies the contribution to profit (in dollars) from the
sales of footballs by this chain for each possible purchase decision (in hundreds of
pairs) and each outcome with respect to consumer demand.
Econometric forecasting models, also called causal models, use regression to forecast a
time series variable by using other explanatory time series variables.
In blending problems, if a quality constraint involves a quotient, then the problem will
be nonlinear.