
If a model contains uncertain outputs, it can be very misleading to build a deterministic
model by using the means of the inputs to predict an output. This is called the:
a. Law of Large Numbers.
b. Flaw of Averages
c. Law of Inevitable Disappointment
d. Central Limit Theorem
The null and alternative hypotheses divide all possibilities into:
a. two sets that overlap
b. two non-overlapping sets
c. two sets that may or may not overlap
d. as many sets as necessary to cover all possibilities
Related to sensitivity analysis in linear programming, when the profit increases with a
unit increase in a resource, this change in profit is referred to as the:
a. add-in price
b. sensitivity price
c. shadow price
d. additional profit
NARRBEGIN: SA_110_113
The station manager of a local television station is interested in predicting the amount
of television (in hours) that people will watch in the viewing area. The explanatory
variables are: age (in years), education (highest level obtained, in years) and
family size (number of family members in household). The multiple regression output
is shown below:
NARREND
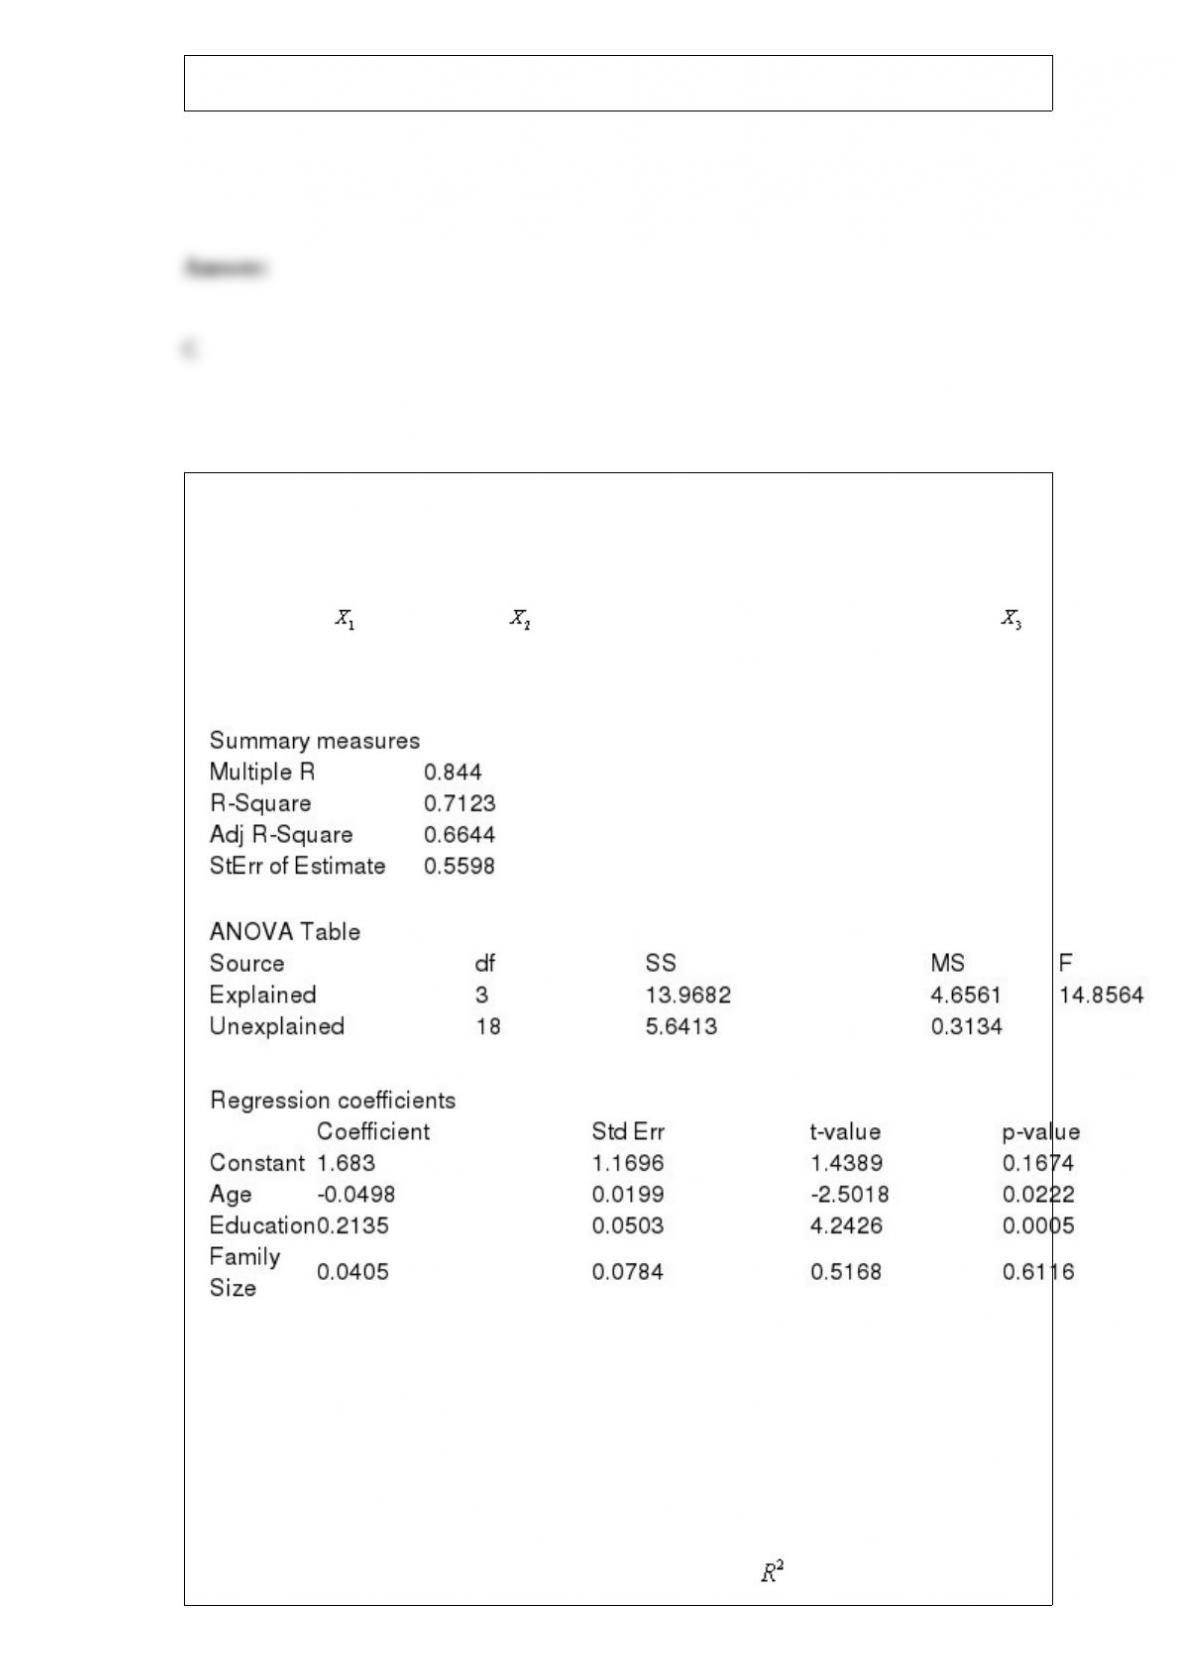
(A) Use the information above to estimate the linear regression model.
(B) Interpret each of the estimated regression coefficients of the regression model in
(A).
(C) Identify and interpret the coefficient of determination ( ) for the model in (A).
(D) Identify and interpret the standard error of the estimate for the model in (A).
NARRBEGIN: SA_86_90
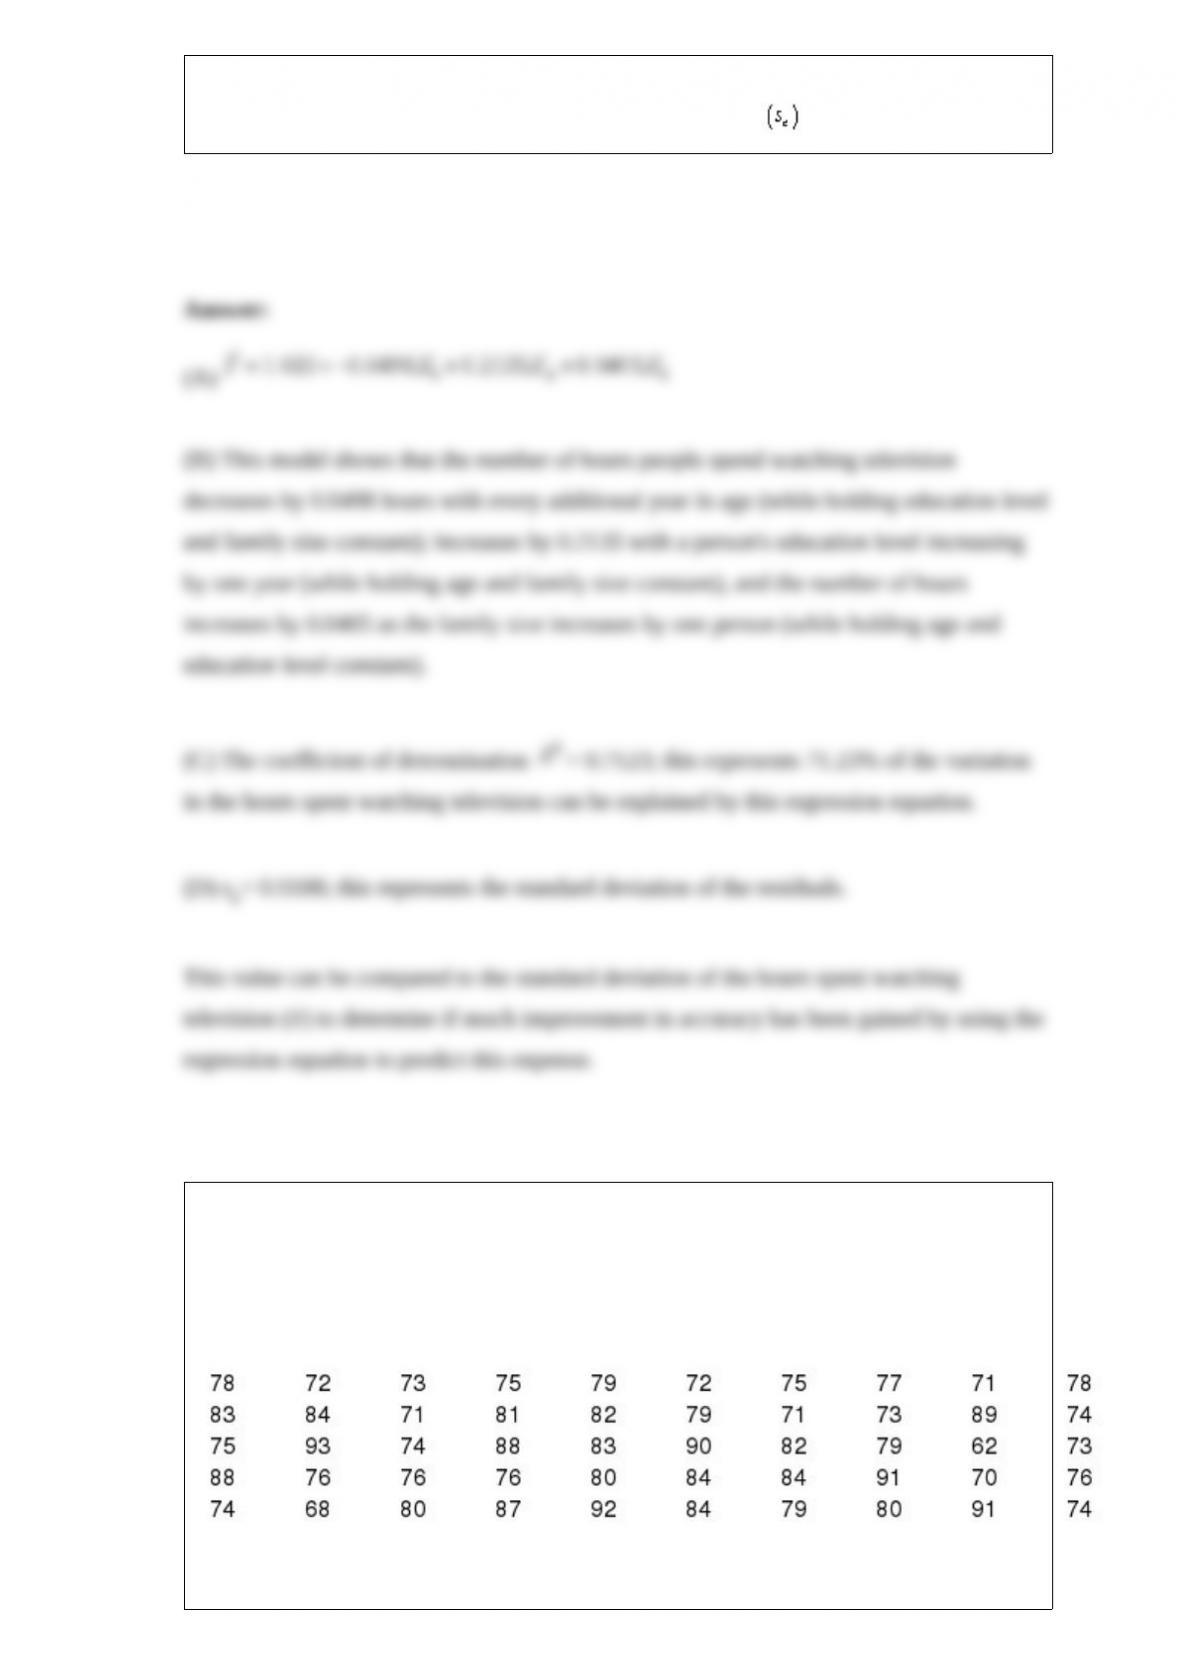
A statistics professor has just given the final examination in his introductory statistics
course. In particular, he is interested in learning how his class of 50 students performed
on this exam. The data are shown below.
NARREND
(A) Using these 50 students as the frame, use Excel to generate a simple random sample
of size 10 from this frame.
(B) Compute the mean scores in the frame and the simple random sample you
generated in (A).
(C) Compare the mean scores you computed in (B). Is your simple random sample a
good representative of the frame? Why or why not?
(D) Using these 50 students as the frame, use Excel to generate a systematic sample of
size 10 from this frame.
(E) Compare the mean scores in the frame with that in the systematic sample in (D).
What do you conclude?
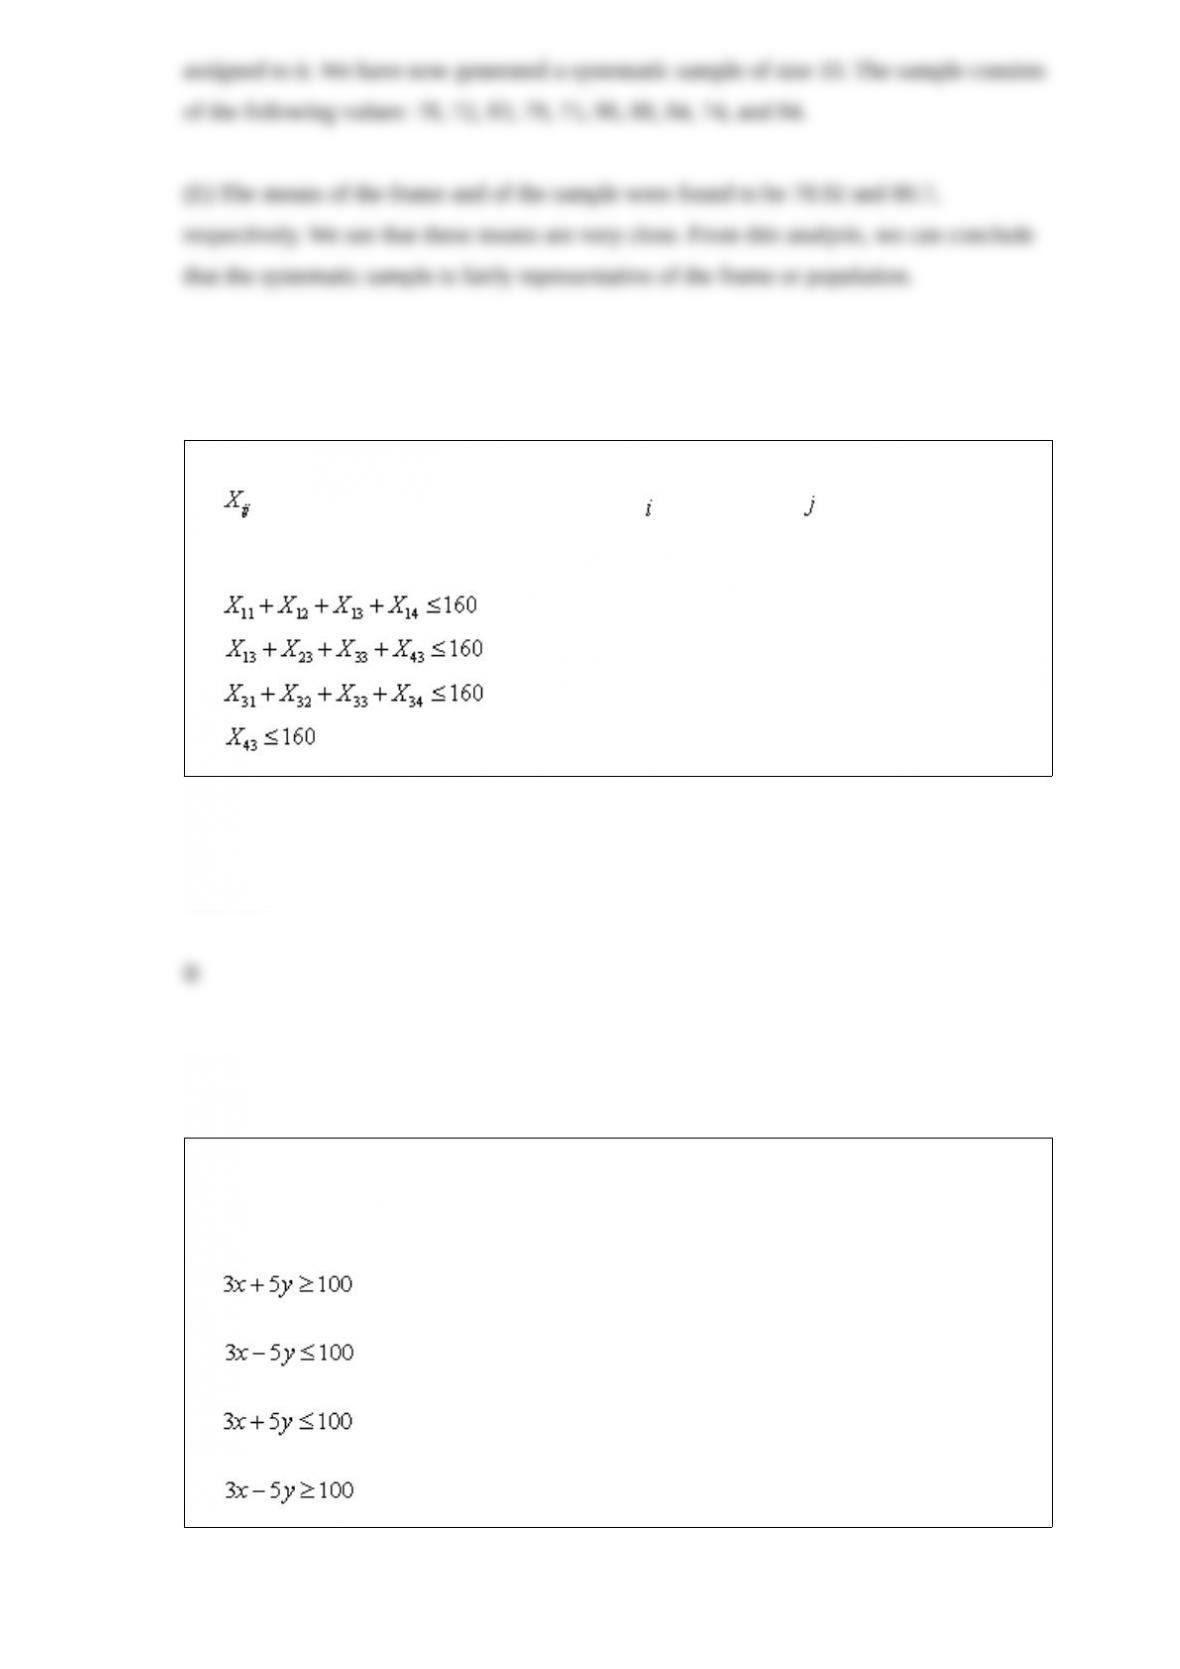
If refers to the number of hours employee works in week , then to indicate that
the number of working hours of 4 employees in week 3 should not exceed 160 hours,
we must have a constraint of the form
a.
b.
c.
d.
If a manufacturing process takes 3 hours per unit of x and 5 hours per unit of y and a
maximum of 100 hours of manufacturing process time are available, then an algebraic
formulation of this constraint is:
a.
b.
c.
d.
NARRBEGIN: SA_93_95
After Michigan State University reached the final four in the 2000 NCAA Basketball
Tournament, a sweatshirt supplier in Lansing is trying to decide how many sweatshirts
to print for the upcoming championships. The final four teams (Michigan State, Florida,
Wisconsin, and North Carolina) have emerged from the quarterfinal round, and there is
a week left until the semifinals, which are then followed in a couple of days by the
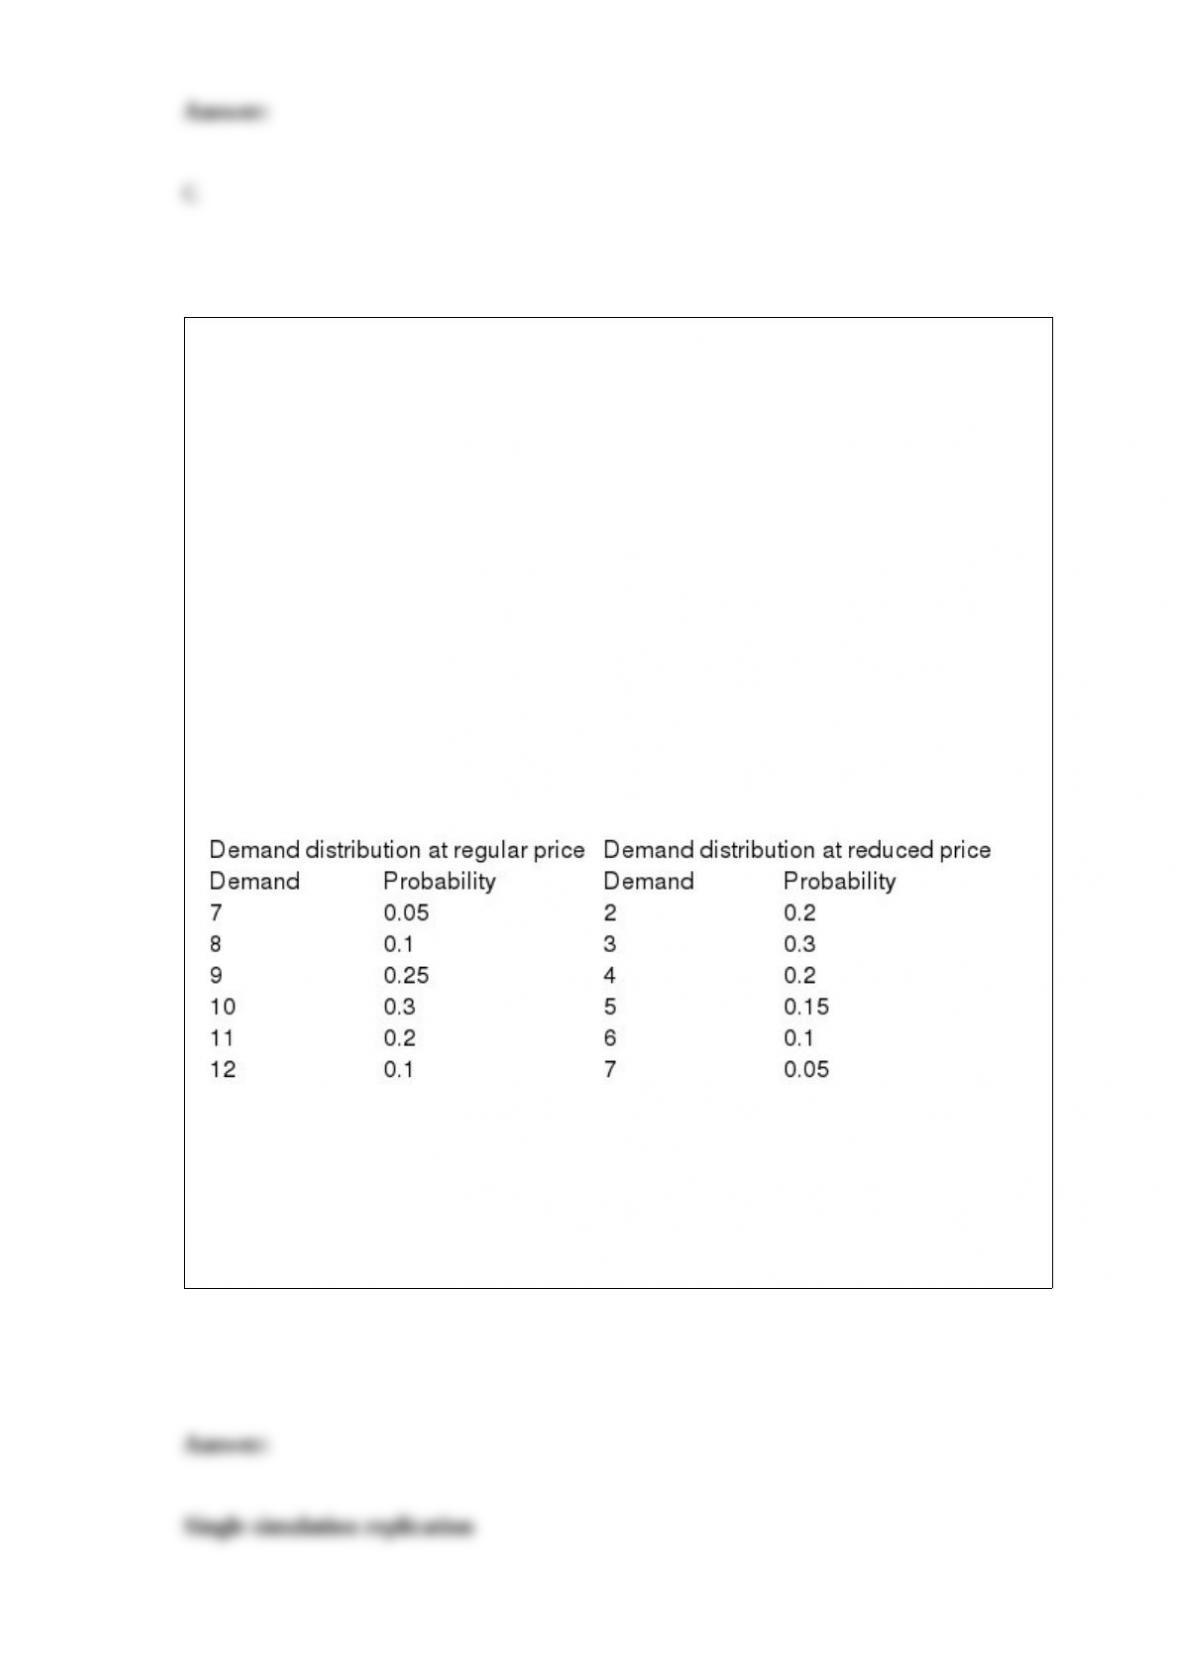
finals. Each sweatshirt costs $12 to produce and sells for $24. However, in three weeks,
any leftover sweatshirts will be put on sale for half price, $12. The supplier assumes
that the demand (in thousands) for his sweatshirts during the next three weeks, when
interest is at its highest, follows the probability distribution shown in the table below.
The residual demand, after the sweatshirts have been put on sale, also has the
probability distribution shown in the table below. The supplier realizes that every
sweatshirt sold, even at the sale price, yields a profit. However, he also realizes that any
sweatshirts produced but not sold must be thrown away, resulting in a $12 loss per
sweatshirt.
NARREND
Use @Risk simulation add-in to analyze the sweatshirt sales. Do this for normal
distributions, where we assume that the regular demand is normally distributed with
mean 10,000 and standard deviation 1500, and that the demand at the reduced price is
normally distributed with mean 5,000 and standard deviation 1500.

NARRBEGIN: SA_74_78
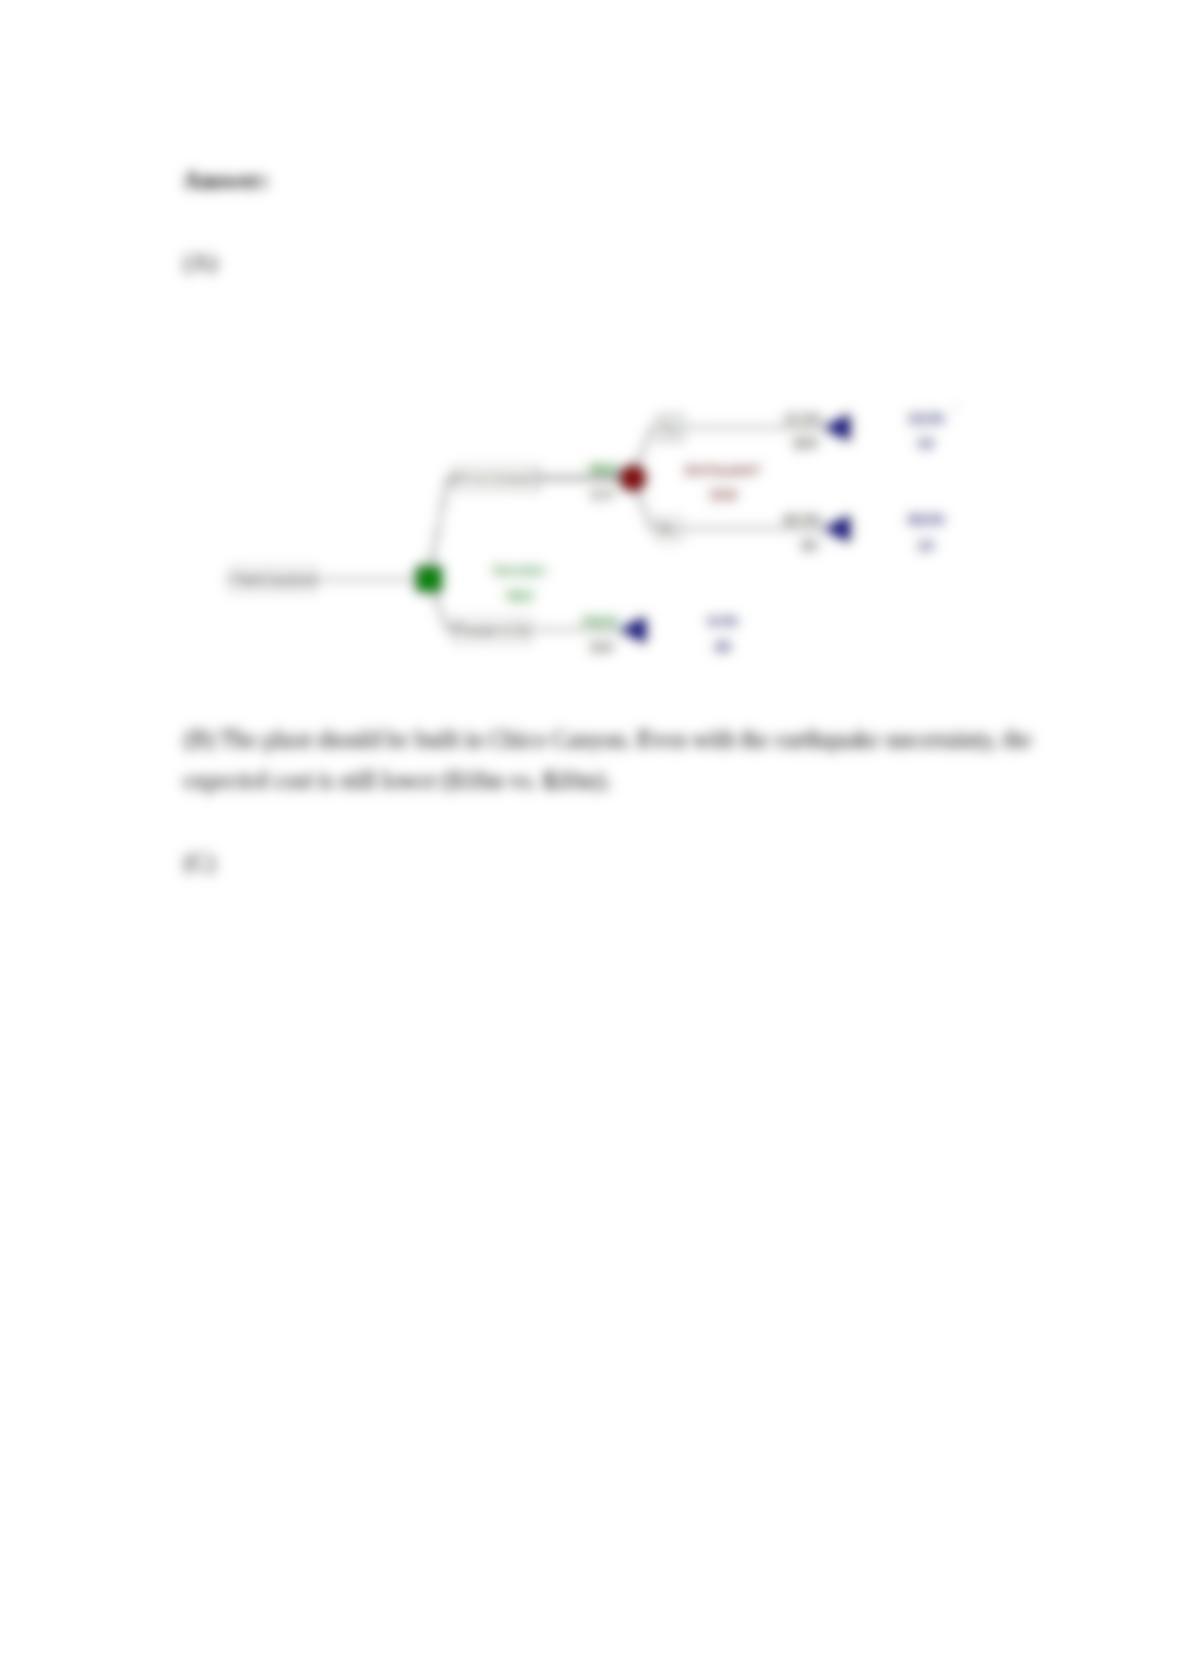
A nuclear power company is deciding whether to build a nuclear plant at Chico Canyon
or at Pleasantville. The cost of building the power plant is $14 million at Chico and $20
million at Pleasantville. If the company builds at Chico, however, and an earthquake
occurs at Chico during the next 5 years, construction will be terminated and the
company will lose $14 million (and will still have to build a power plant at
Pleasantville). Without further information, the company believes there is a 20% chance
that an earthquake will occur at Chico during the next 5 years.
NARREND (A) Construct a decision tree to help the power company decide what to
do. Make sure to label all decision and chance nodes and include appropriate costs,
payoffs and probabilities.
(B) Where should the power company build the plant? What is the expected cost?
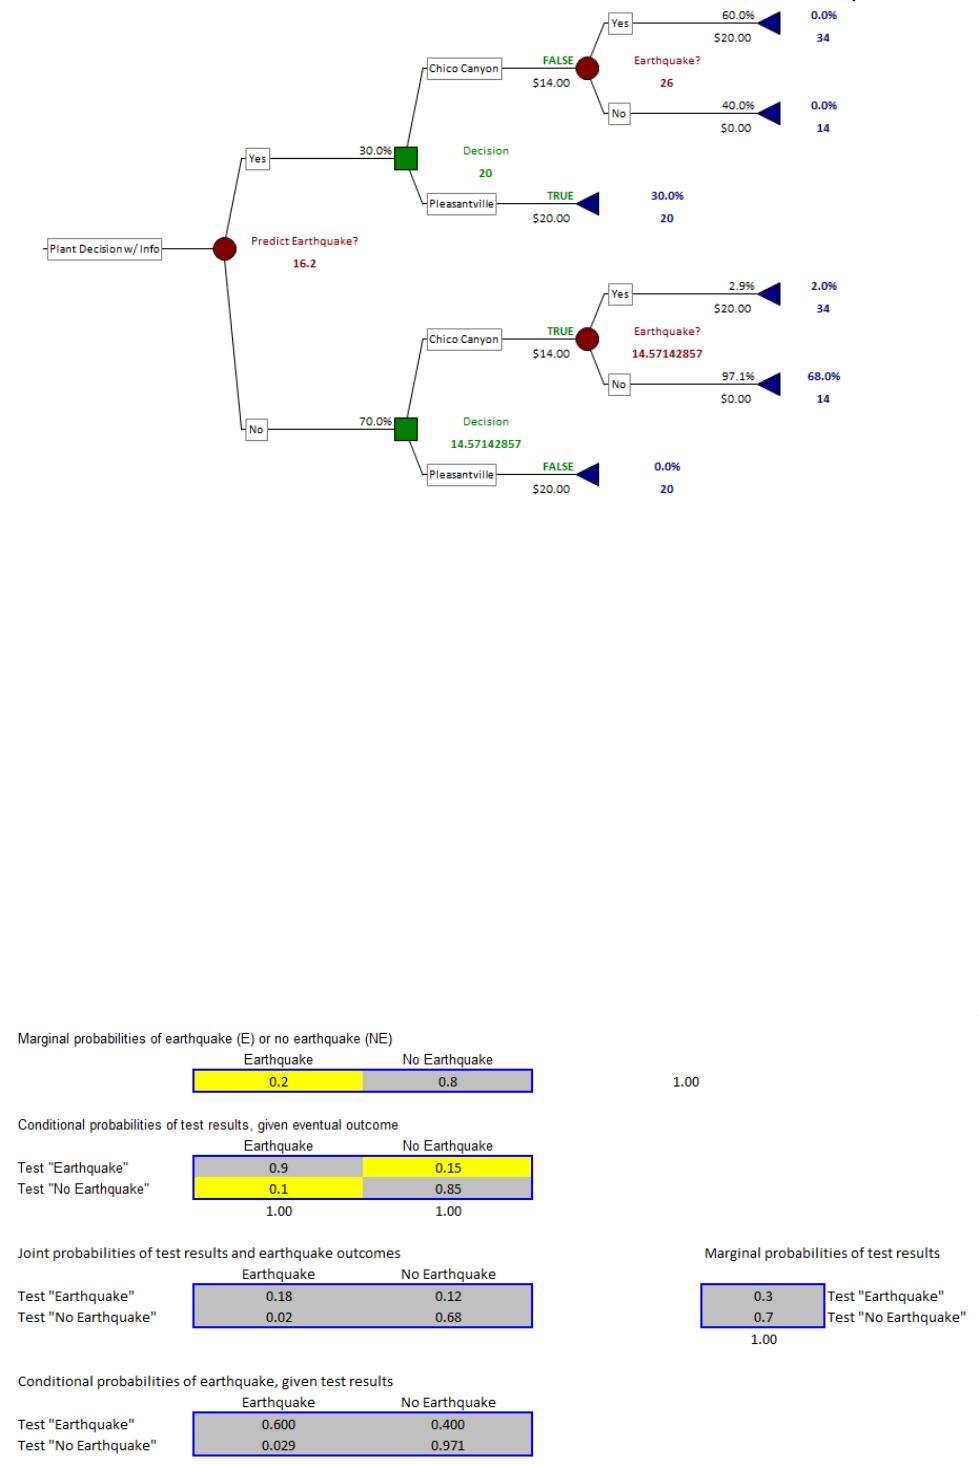
(C) Suppose that a geologist (and his team) can be hired to analyze the fault structure at
Chico Canyon. He will either predict whether an earthquake will occur or not. If the
geologist is perfectly reliable, what is the most the company should be willing to pay
for his services?
(D) Suppose that an actual (not perfectly reliable) geologist can be hired to analyze the
earthquake risk. The geologist’s past record indicates that he will predict an earthquake
on 90% of the occasions for which an earthquake will occur and no earthquake on 85%
of the occasions for which an earthquake will not occur. Given this information, what
are the posterior probabilities that an earthquake will and will not occur, given the
geologists predictions?
(E) Should the company hire the geologist if his fee is $1.5M?

In choosing the “best-fitting” line through a set of points in linear regression, we choose
the one with the:
a. smallest sum of squared residuals
b. largest sum of squared residuals
c. smallest number of outliers
d. largest number of points on the line
e. None of these options
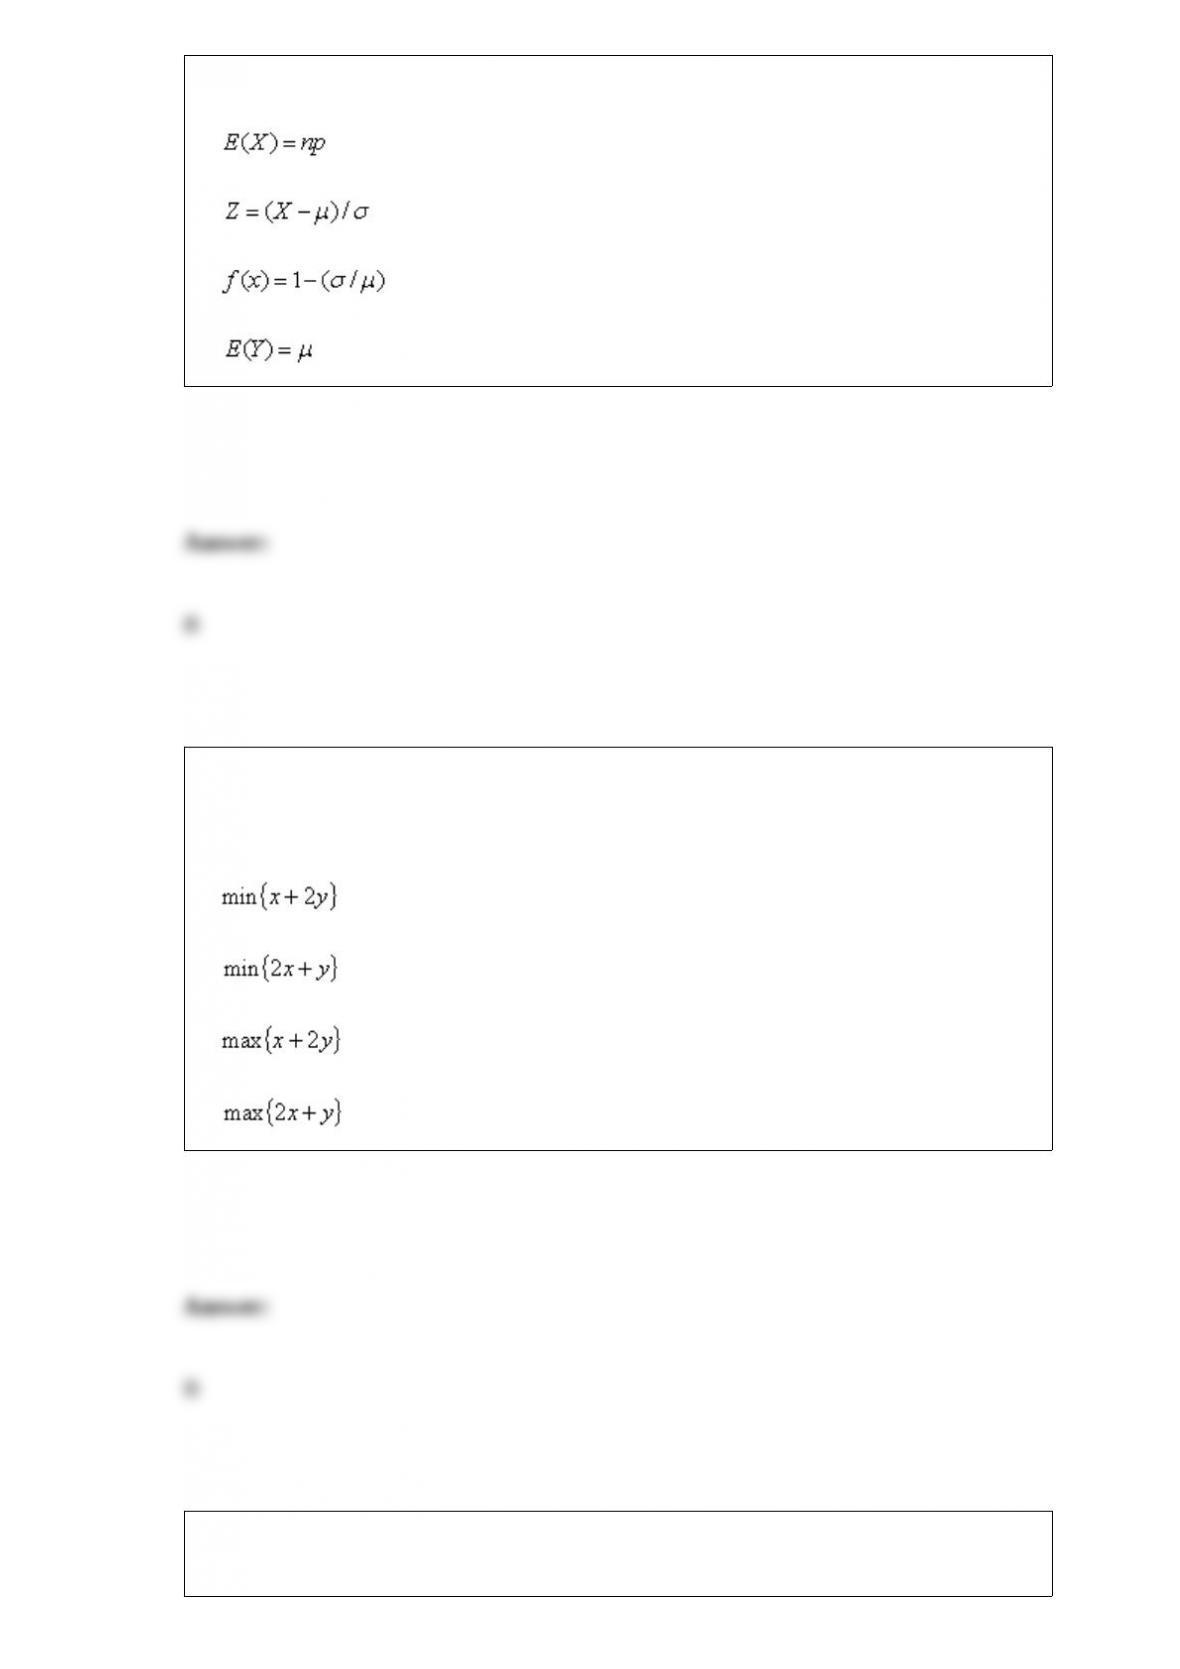
Which of the following equations shows the process of standardizing?
a.
b.
c.
d.
Suppose a liquor store sells beer for a net profit of $1 per unit and wine for a net profit
of $2 per unit. Let x equal the amount of beer sold and y equal the amount of wine sold.
An algebraic formulation of the profit function is:
a.
b.
c.
d.
Which of the following statements is correct regarding the graph of a discrete
probability distribution?

a. It is a series of spikes.
b. The height of each spike is the probability of the corresponding value.
c. There is an empty space between adjacent spikes.
d. All of these options
Age, height, and weight are examples of numerical data.
The solution of a linear programming problem using Microsoft Excel typically involves
the following three stages:
a. formulating the problem, invoking Solver, and sensitivity analysis
b. formulating the problem, graphing the problem, and sensitivity analysis
c. the changing cells, the target cells, and the constraints
d. the inputs, the changing cells, and the outputs

A typical transportation problem requires which of the following sets of input numbers:
a. Capacities, demands and flows
b. Capacities, demands and unit shipping costs
c. Supplies, demands and flows
d. Supplies, demands and arcs
Two independent samples of sizes 50 and 50 are randomly selected from two
populations to test the difference between the population means, . The sampling
distribution of the sample mean difference is:
a. normally distributed
b. approximately normal
c. t – distributed with 98 degrees of freedom
d. chi-squared distributed with 99 degrees of freedom
A judgmental sample is a sample in which the

a. sampling units are chosen using a random number table
b. quality of sampling units judged
c. sampling units are chosen according to the sampler’s judgment
d. sampling units are all biased and vocal about it
With regard to decision making, most individuals are __________________.
a. risk averse
b. risk seekers
c. risk maximizers
d. EMV maximizers
e. None of these options
The appropriate hypothesis test for a regression coefficient is:
a.
b.

c.
d. None of these options
If you increase the confidence level, the confidence interval _____.
a. decreases
b. increases
c. stays the same
d. may increase or decrease, depending on the sample data
A function that associates a numerical value with each possible outcome of an uncertain
event is called a
a. conditional variable
b. random variable
c. population variable
d. sample variable

When using the graphical solution method to solve linear programming problems, the
set of points that satisfy all constraints is called the:
a. optimal region
b. feasible region
c. constrained region
d. logical region
The prototype linear programming problem is to select an optimal mix of products to
produce to maximize profit. This type of problem is referred to as the:
a. product mix problem
b. production problem
c. product/process problem
d. product scheduling problem

The adjusted R2 adjusts R2 for:
a. non-linearity
b. outliers
c. low correlation
d. the number of explanatory variables in a multiple regression model
A histogram that has exactly two peaks is called a
a. unimodal distribution
b. bimodal distribution
c. skewed distribution
d. scatterplot
Suppose that a simple exponential smoothing model is used (with a = 0.30) to forecast
monthly sandwich sales at a local sandwich shop. After June’s demand is observed at
1520 sandwiches, the forecasted demand for July is 1600 sandwiches. At the beginning
of July, what would be the forecasted demand for August?

a. 1520
b. 1544
c. 1550
d. 1600
One important special use of bounded distributions is when the only possible values
are:
a. less than zero.
b. uniformly distributed around the mean.
c. skewed to the right.
d. nonnegative.
The key to using stratified sampling is:
a. identifying the strata
b. selecting the appropriate strata
c. defining the strata

d. randomizing the strata
The smoothing constants in exponential smoothing models are effectively a way to
assign different weights to past levels, trends and cycles in the data.
NARRBEGIN: SA_88_91
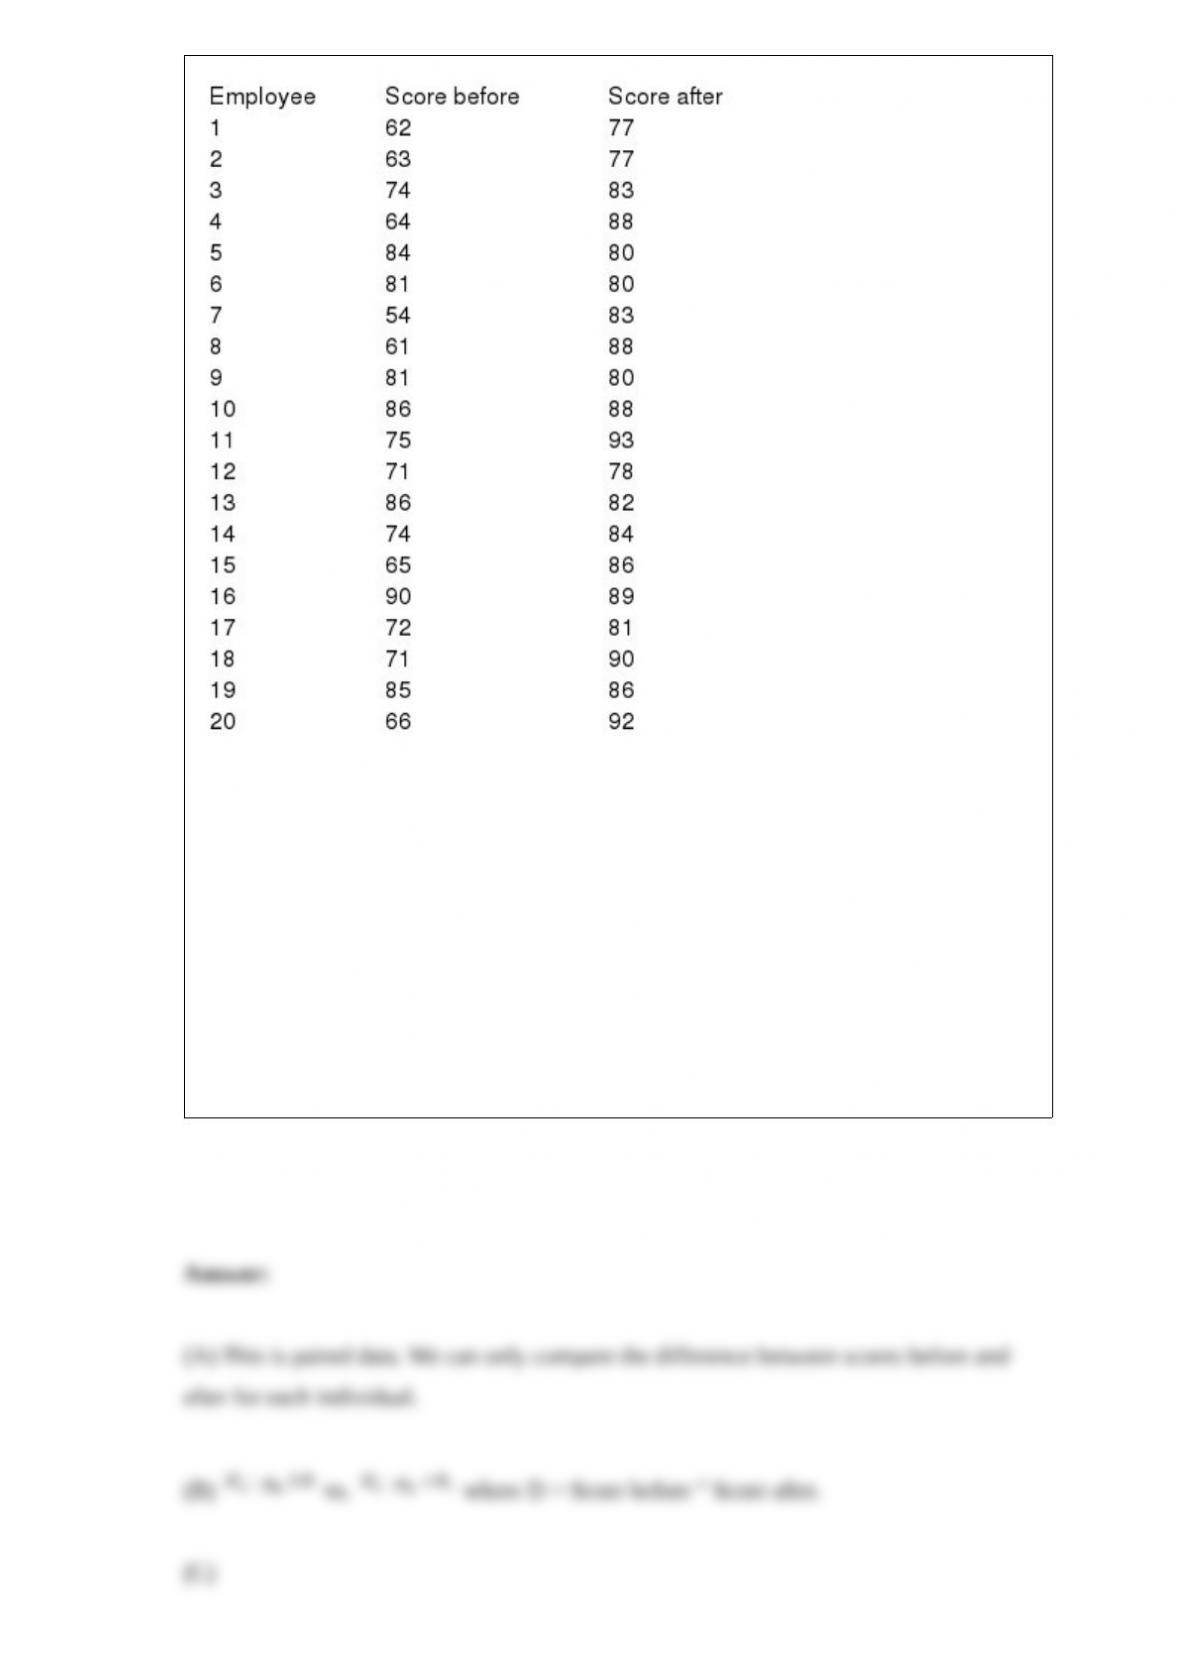
The manager of a consulting firm in Lansing, Michigan, is trying to assess the
effectiveness of computer skills training given to all new entry-level professionals. In
an effort to make such an assessment, he administers a computer skills test immediately
before and after the training program to each of 20 randomly chosen employees. The
pre-training and post-training scores of these 20 individuals are shown in the table
below.
NARREND
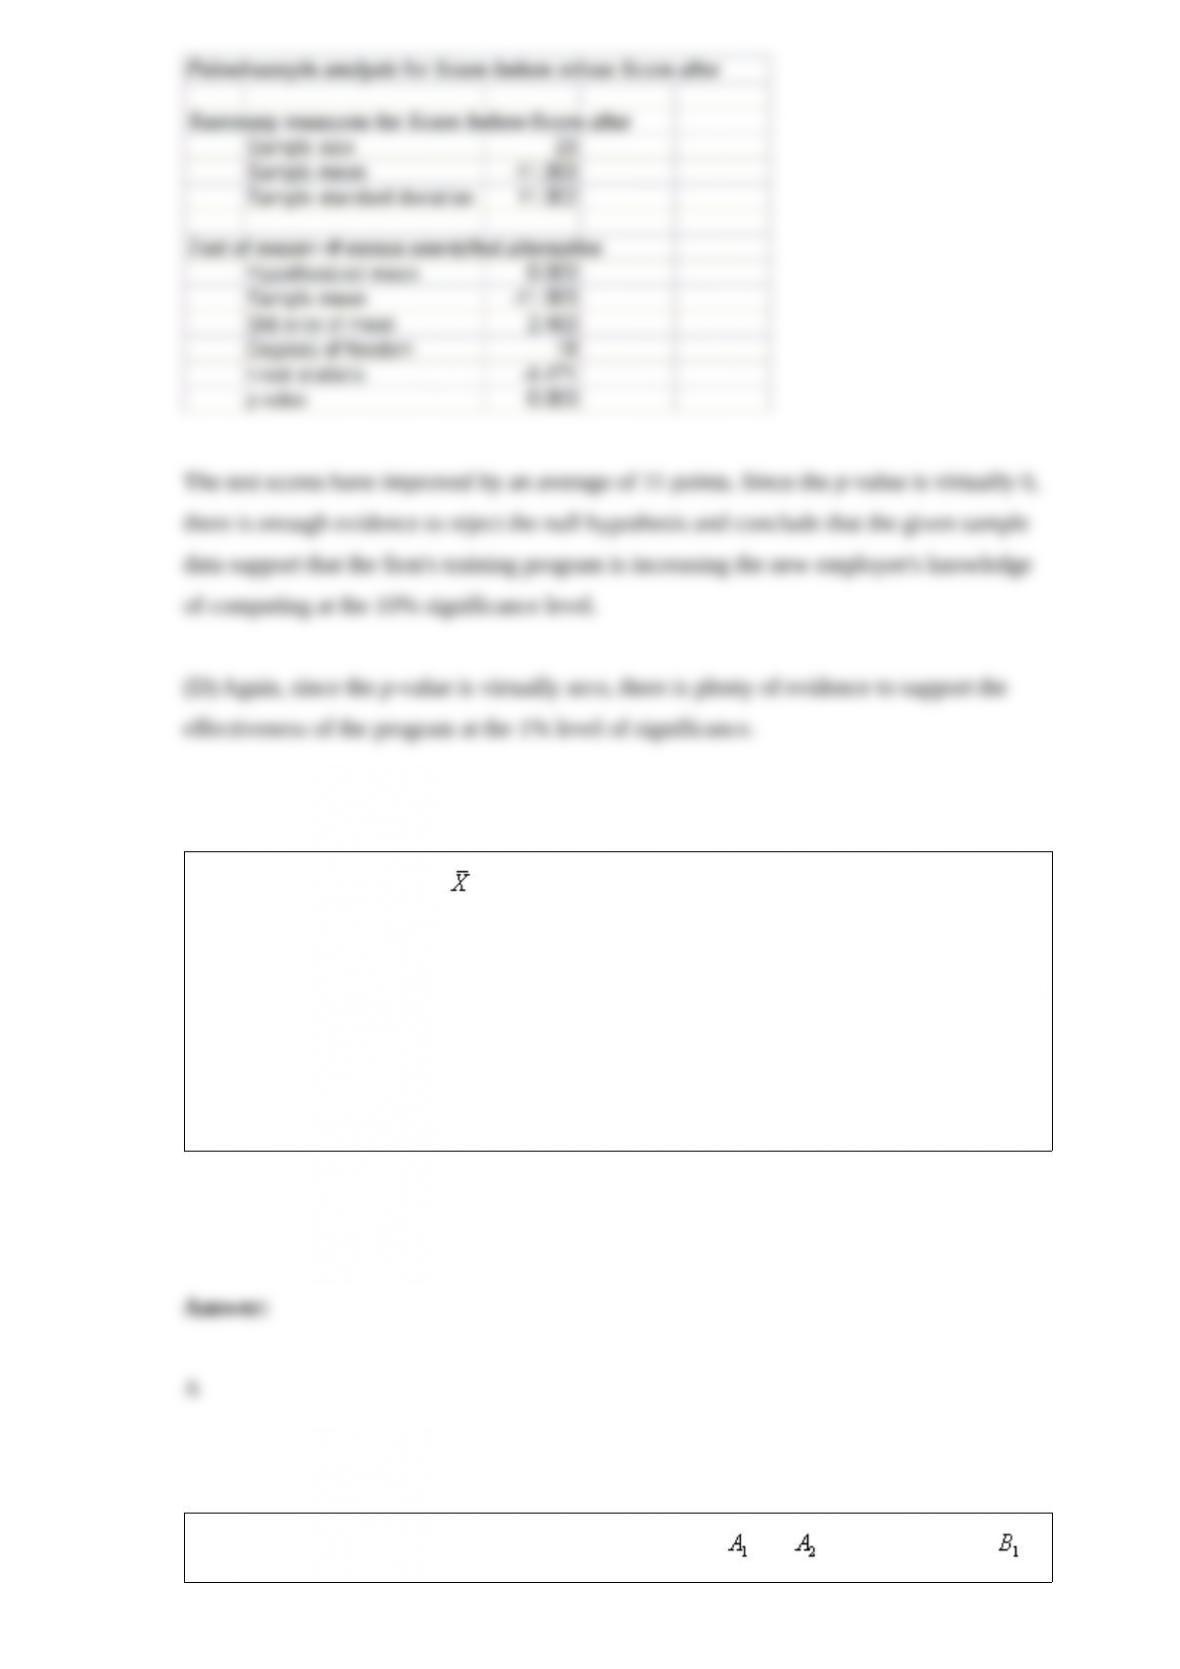
(A) Is this two-sample data or paired data. Explain your answer.
(B) Specify an appropriate hypothesis test.
(C) Using a 10% level of significance, do the given sample data support that the firm’s
training programs is effective in increasing the new employee’s computer skills?
(D) Using a 1% level of significance, do the given sample data support that the firm’s
training programs is effective in increasing the new employee’s working knowledge of
computing ?
The standard deviation of is usually called the
a. standard error of the mean
b. standard error of the sample
c. standard error of the population
d. randomized standard error
The joint probabilities shown in a table with two rows, and and two columns,
and , are as follows: P( and ) = .10, P( and ) = .30, P( and ) = .05,
and P( and ) = .55. Then P( | ), calculated up to two decimals, is
a. .33
b. .35
c. .65
d. .67
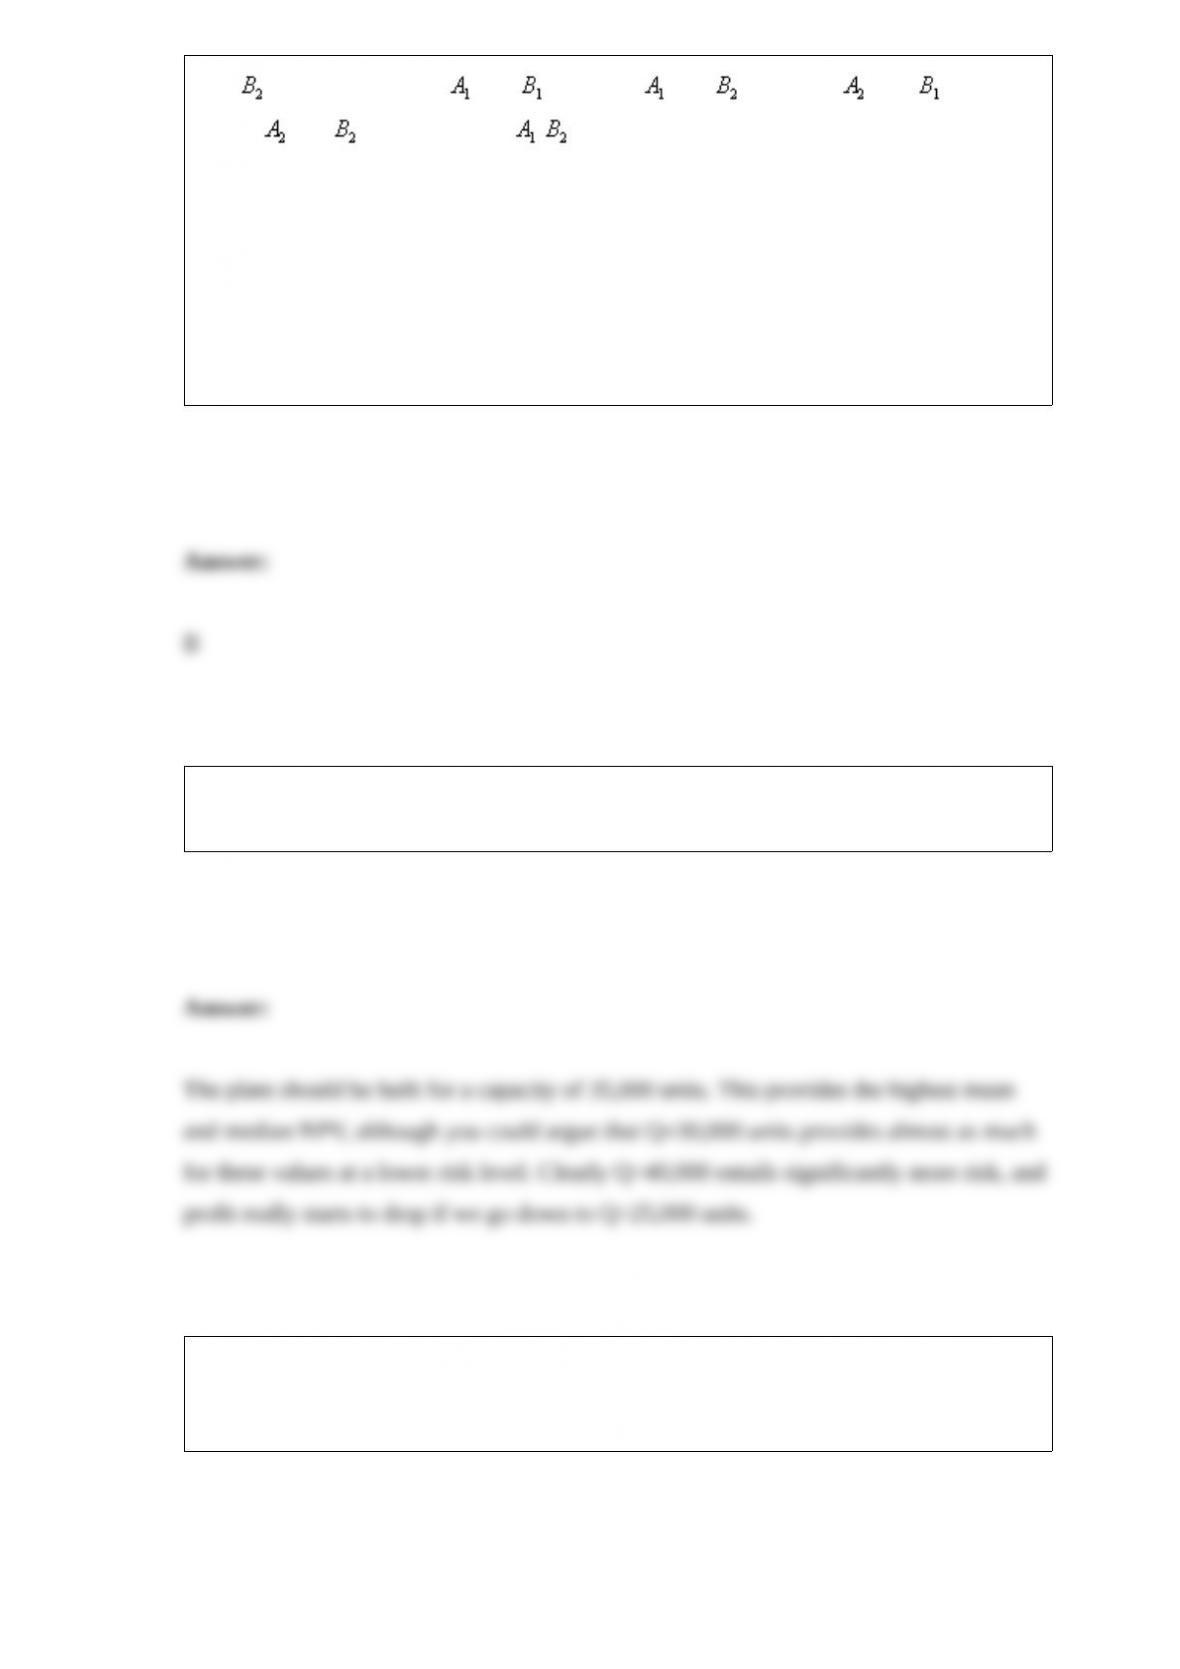
Considering your answers for Questions 78 through 83, please state how many units of
capacity you think the plant should be built for and explain why.
Different random numbers generated by the computer are probabilistically dependent.
This implies that when we generate a random number in a particular cell, it has some
effect on the values of any other random numbers generated in the spreadsheet.
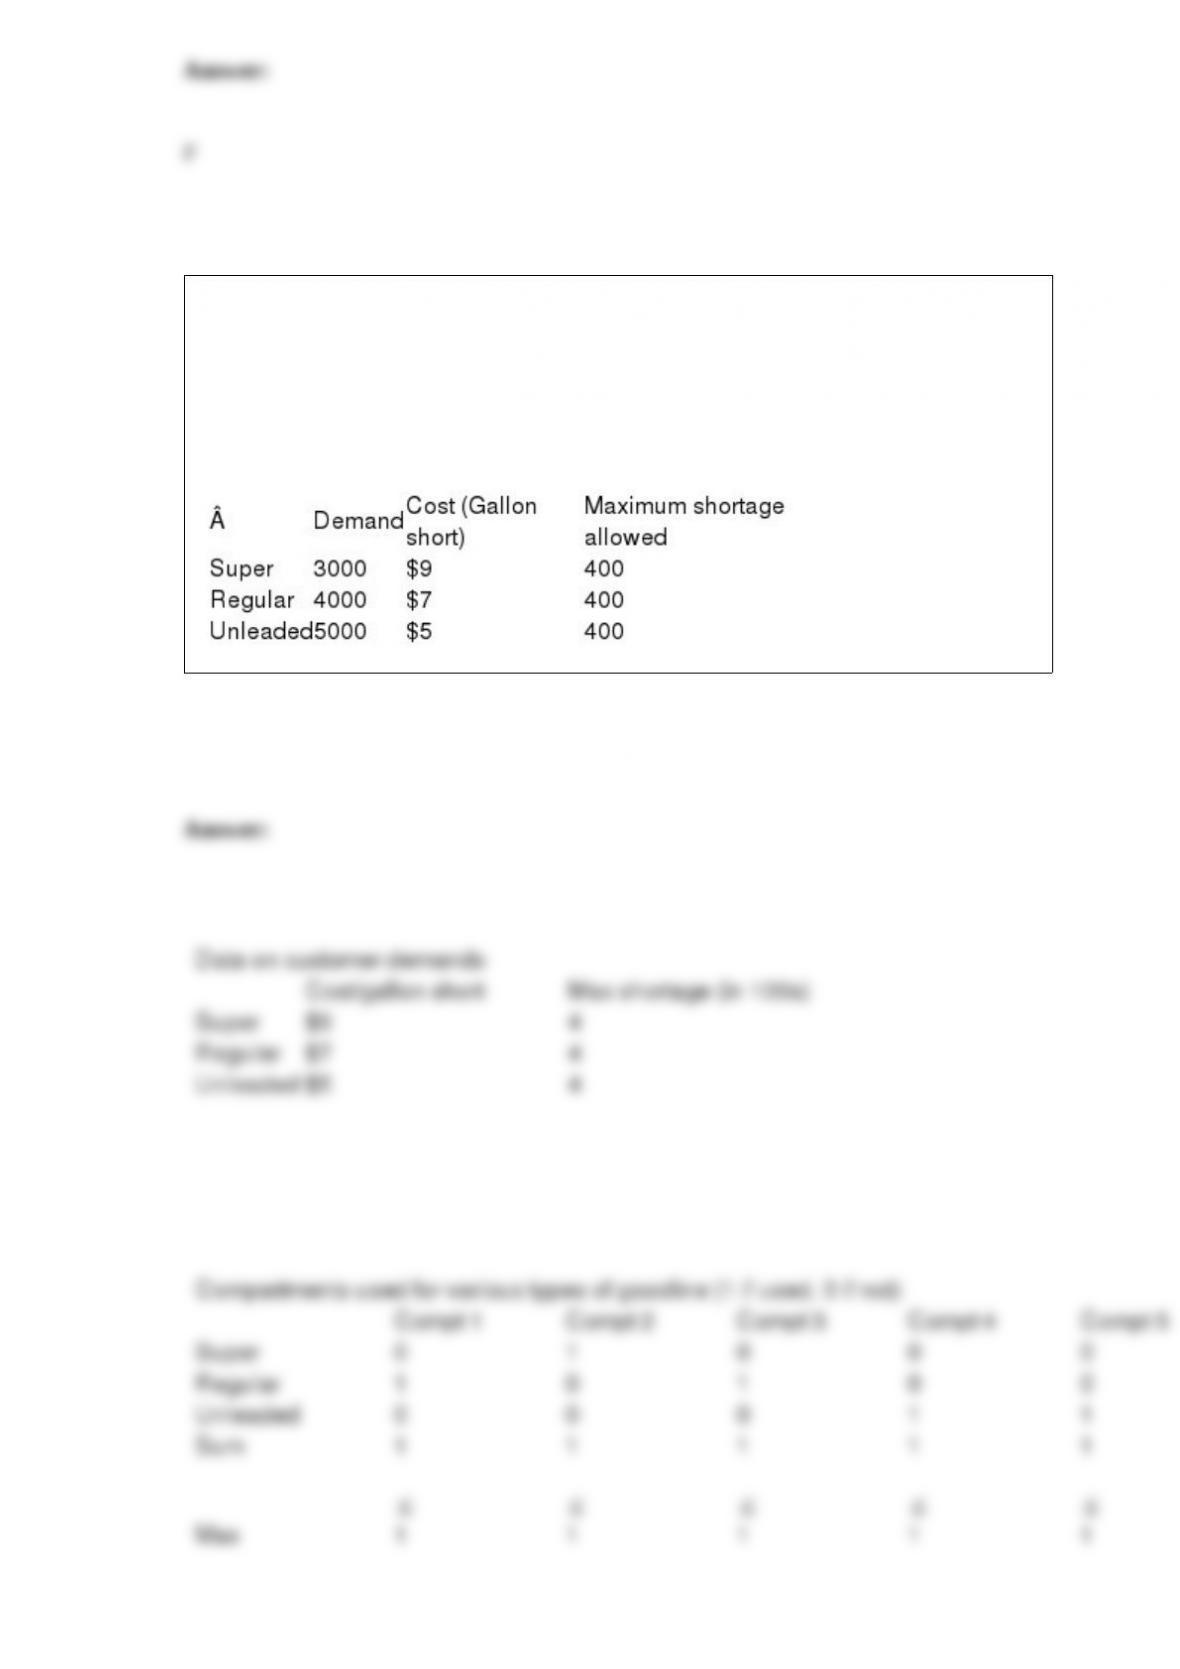
An oil delivery truck contains five compartments, holding up to 2800, 2900, 1200,
1800, and 3200 gallons of fuel, respectively. The company must deliver three types of
fuel (super, regular, and unleaded) to a customer. The demands, penalty per gallon
short, and the maximum allowed shortage are shown in the table below. Each
compartment of the truck can carry only one type of gasoline. Determine how to load
the truck in a way that minimizes shortage costs.

The seasonal component of a time series is more likely to exhibit the relatively steady
growth of a variable, such as the population of Egypt from 35 million in 1960 to 75
million in 2005.
NARRBEGIN: SA_104_112
Mrs. Rich has just bought a new $30,000 car. As a reasonably safe driver, she believes
that there is only a 5% chance of being in an accident in the forthcoming year. If she is
involved in an accident, the damage to her new car depends on the severity of the
accident. The probability distribution for the range of possible accidents and the
corresponding damage amounts (in dollars) are shown in the table below. Mrs. Rich is
trying to decide whether she is willing to pay $170 each year for collision insurance
with a $300 deductible. Note that with this type of insurance, she pays the first $300 in
damages if she causes an accident, and the insurance company pays the remainder.
Distribution of Accident Types and Corresponding Damage Amounts
NARREND
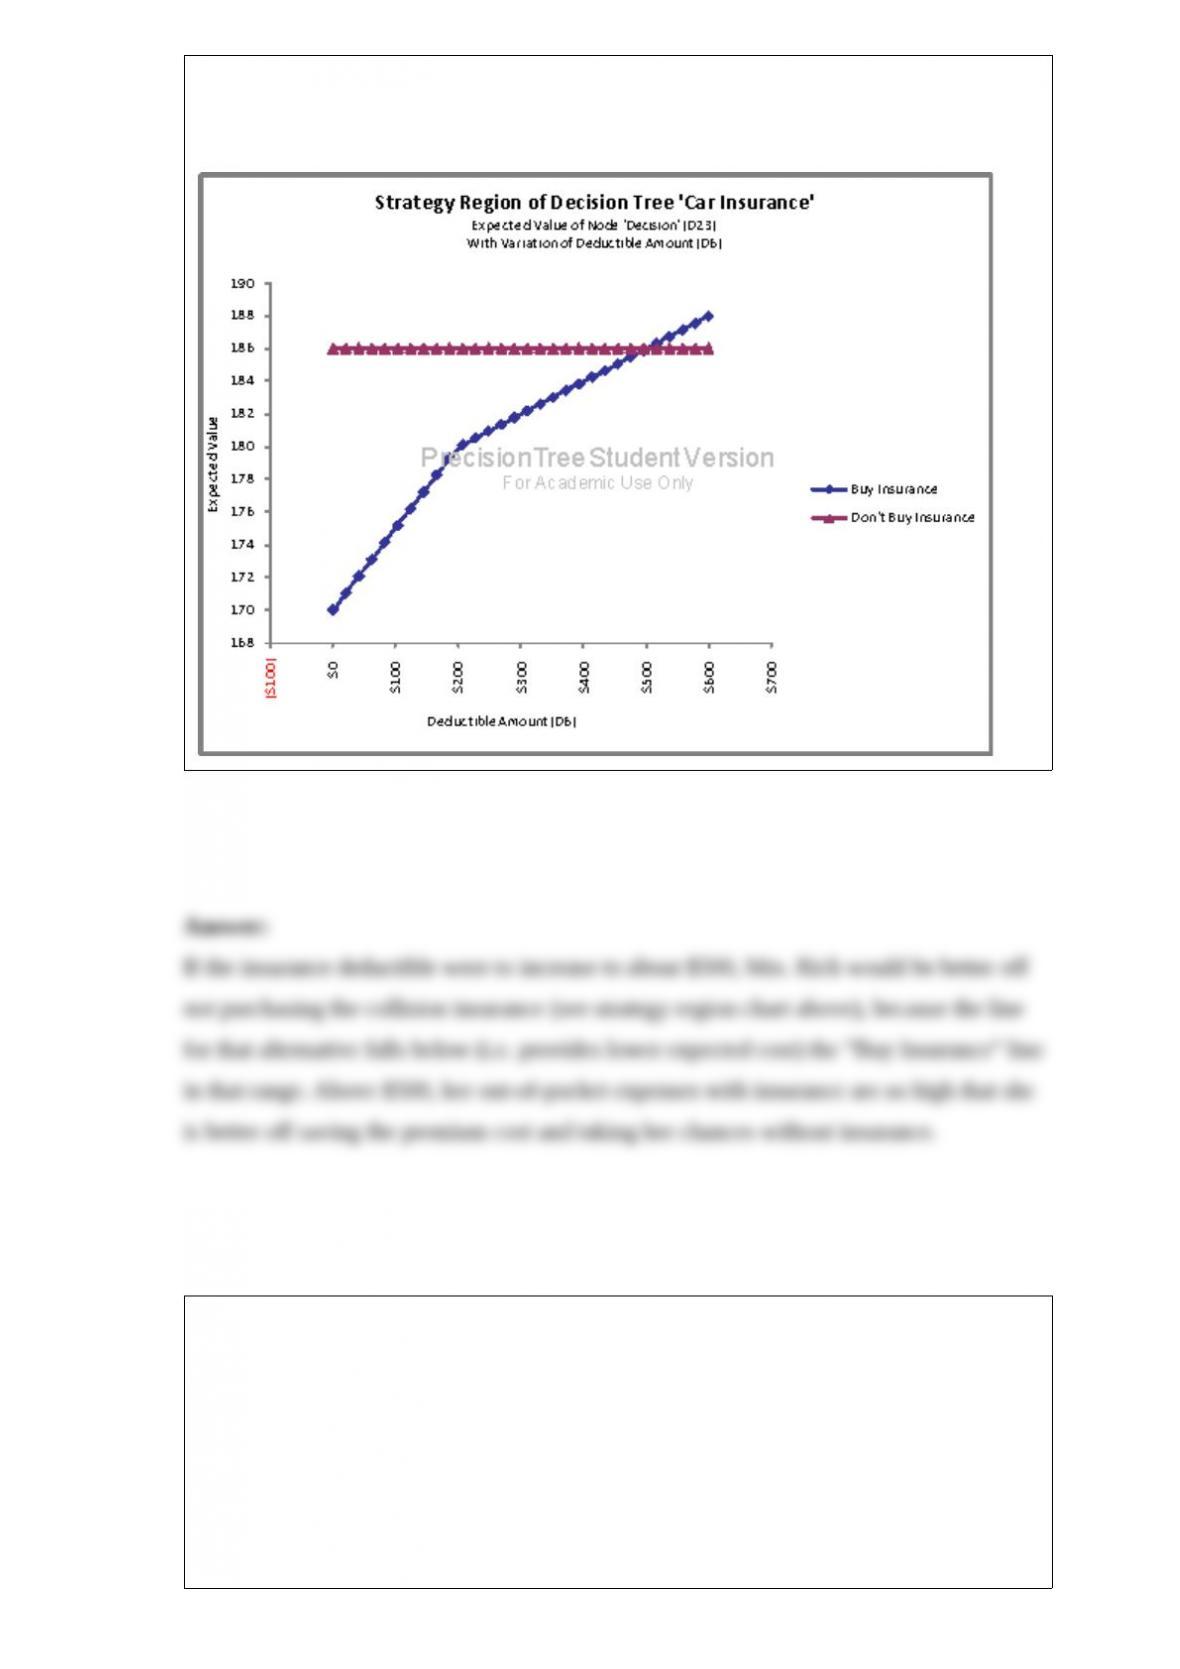
What impact, if any, does the insurance deductible amount have on her decision?
Briefly explain your answer
NARRBEGIN: SA_71_75
Wendy’s fast-food restaurant sells hamburgers and chicken sandwiches. On a typical
weekday, the demand for hamburgers is normally distributed with a mean of 450 and
standard deviation of 80 and the demand for chicken sandwiches is normally distributed
with a mean of 120 and standard deviation of 30. Use this information to answer the
following questions.
NARREND

If the restaurant stocks 600 hamburgers and 150 chicken sandwiches for a given day,
what is the probability that it will run out of hamburgers or chicken sandwiches (or
both) that day? Assume that the demands for hamburgers and chicken sandwiches are
probabilistically independent.
An interaction variable is the product of an explanatory variable and the dependent
variable.
If P(A and B) = 0, then A and B must be collectively exhaustive.

If the objective function has the equation , then the slope of the objective
function line is 2:
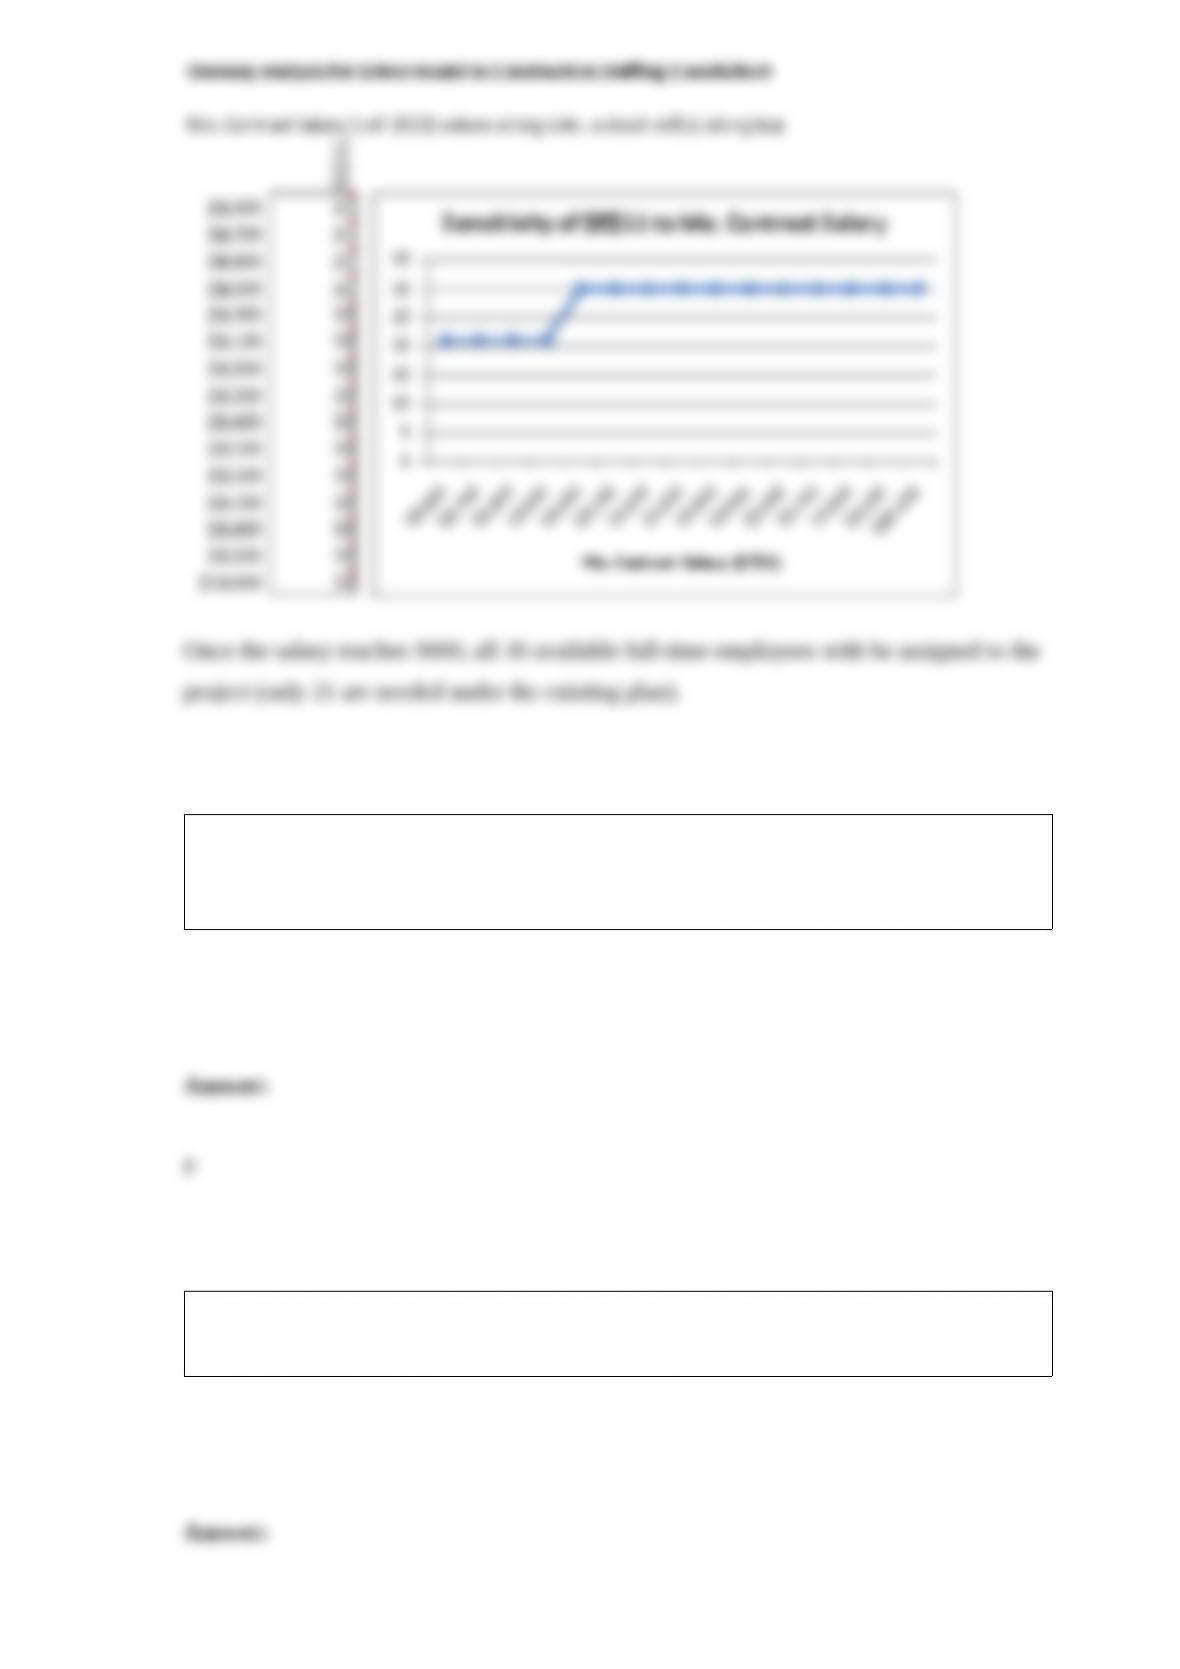
The production manager believes the cost of the contract employees, who are currently
in high demand, could be somewhat higher ” perhaps as high as $10,000 per month. For
the model in Question 113, perform a sensitivity analysis to determine the effect on the
number of full-time employees that will be needed for the project.
Regression models with seasonal dummy variables produce coefficients for each
quarter, which represent the additive or multiplicative factors relative to the annual
average.
The sampling distribution of the mean will have the same mean as the original
population from which the samples were drawn.

A local optimal solution is better than all nearby solutions, but a solution far away
might be better than it.
In a multiple regression analysis involving 4 explanatory variables and 40 data points,
the degrees of freedom associated with the sum of squared errors, SSE, is 35.
NARRBEGIN: SA_65_70
Generate a set of 40 random numbers in a column in an Excel spreadsheet by using
RAND function. Fix the set of random numbers by copying the column to another
column and using the “Paste Special” command with the “Values” option selected.
NARREND
Obtain another set random numbers by pressing the F9 (recalculate) key. Do your
results change significantly? Do the changes match your expectations? Explain your
answer.