Unlock document.
This document is partially blurred.
Unlock all pages and 1 million more documents.
Get Access
NARRBEGIN: SA_82_85
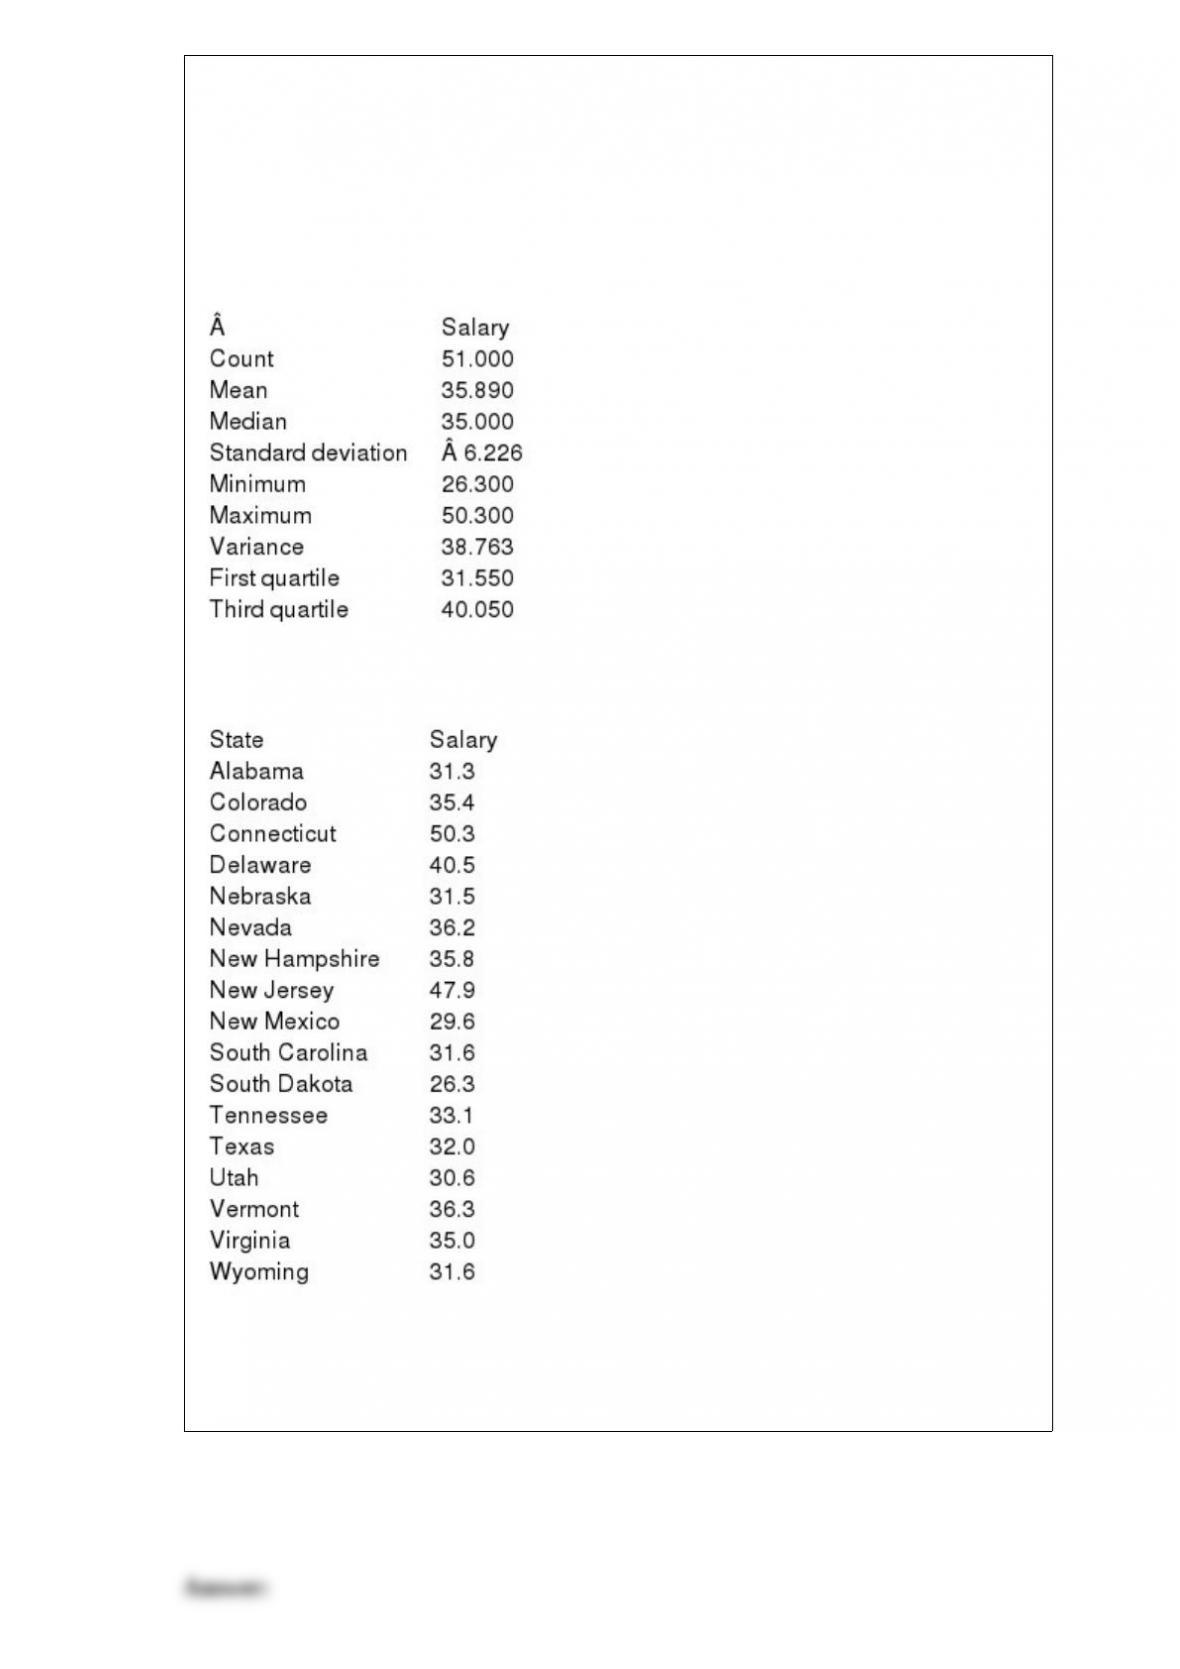
Below you will find summary measures on salaries for classroom teachers across the
United States. You will also find a list of selected states and their average teacher salary.
All values are in thousands of dollars.
Salaries for classroom teachers across the United States
Selected states and their average teacher salary
NARREND
Which of the states listed paid their teachers average salaries that exceed at least 75% of
all average salaries?

NARRBEGIN: SA_107_111
Suppose that the number of customers arriving each hour at the only checkout counter
at a local convenience store is approximately Poisson distributed with an expected
arrival rate of 30 customers per hour. Let X represent the number of customers arriving
per hour. The probabilities associated with X are shown below.
P(X < 5) = 0.0000, P(X < 10) = 0.0000, P(X < 15) = 0.0009,
P(X < 20) = 0.0219, P(X < 25) = 0.1572, P(X < 30) = 0.4757
P(X = 30) = 0.0726, P(X = 31) = 0.0703, P(X = 32) = 0.0659,
P(X = 33) = 0.0599, P(X = 34) = 0.0529, P(X = 35) = 0.0453
NARREND
What is the probability that the number of customers who arrive at this checkout
counter in a given hour will be between 30 and 35 (inclusive)?
NARRBEGIN: SA_108_112
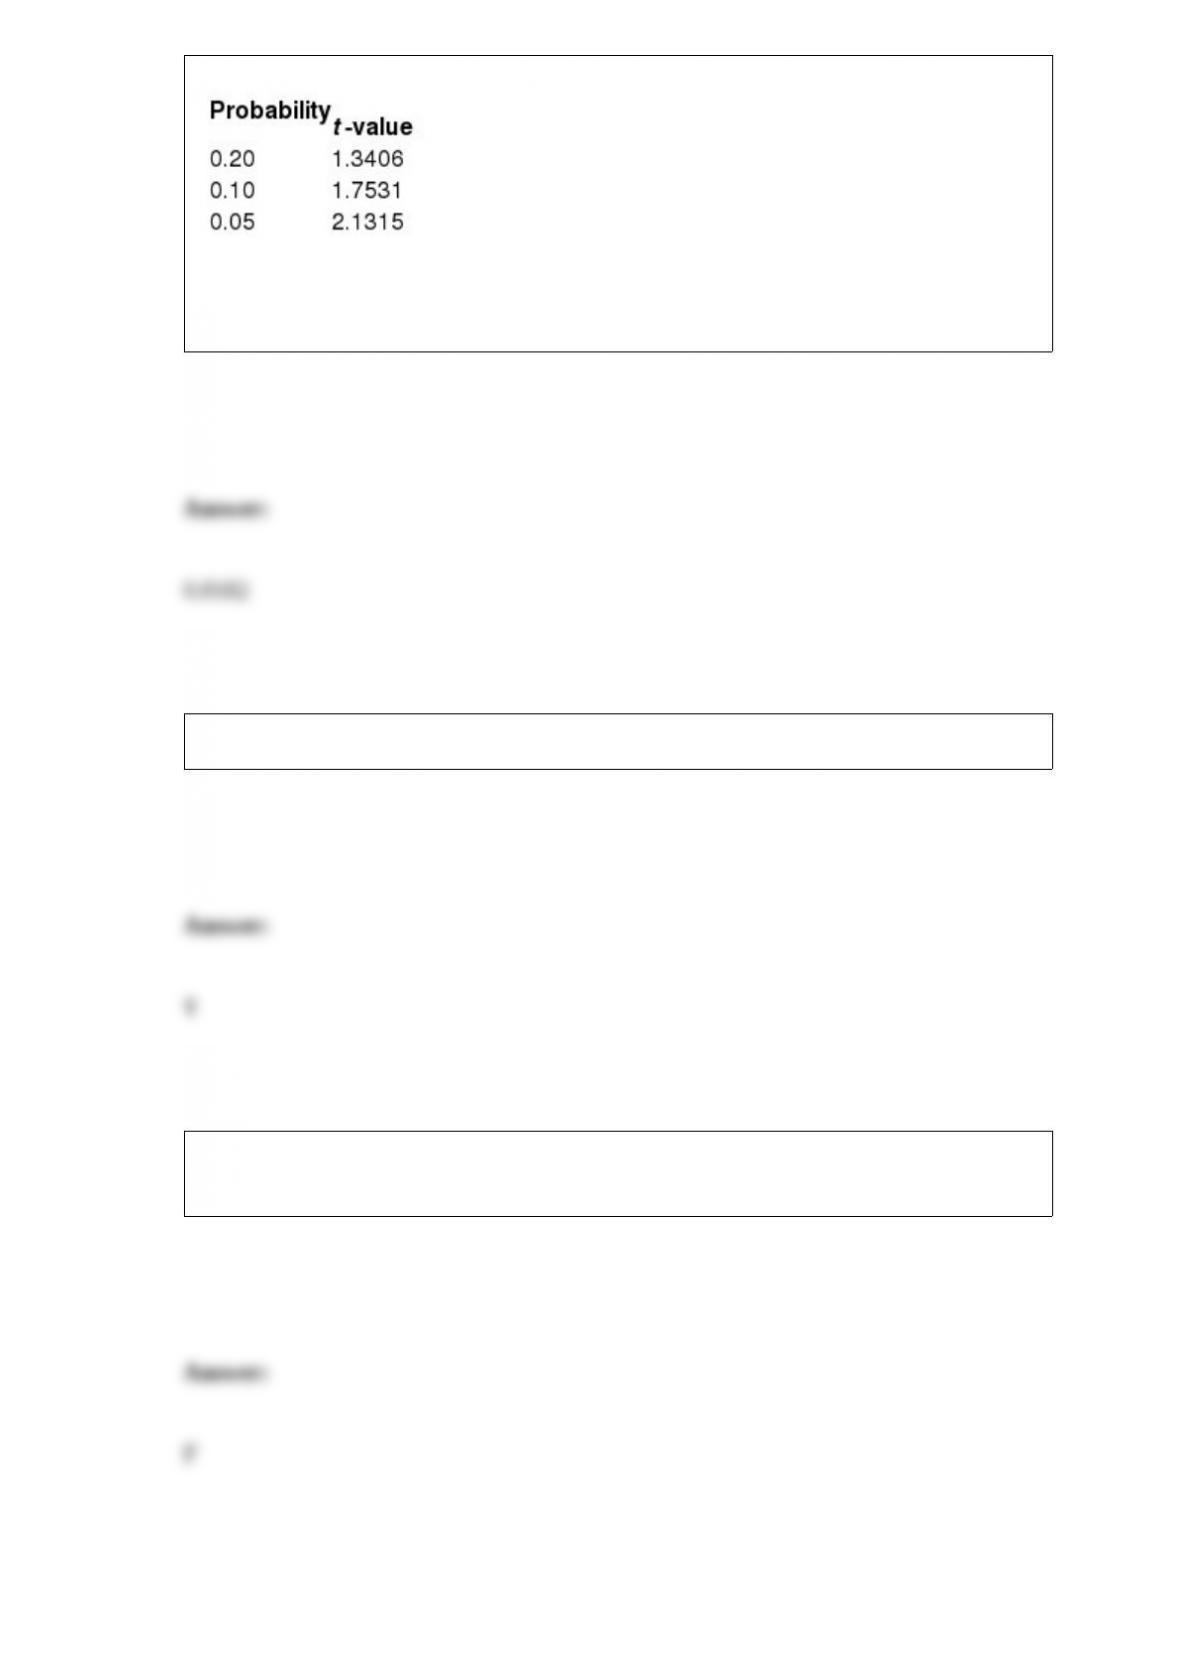
The following values have been calculated using the TDIST and TINV functions in
Excel. These values come from a t- distribution with 15 degrees of freedom.
These values represent the probability to the right of the given positive values.
These values represent the positive t- value for a given probability in both tails (sum of
both tails).
NARREND
What is the probability of a t-value between "1.40 and +1.40?
In warranty cost models, the key input random variable is product lifetime.
In an optimized network flow model (MCNFM), all the available capacity will be used.

Generally speaking, if two variables are unrelated, the covariance will be a positive or
negative number close to zero
NARRBEGIN: SA_66_71
The weekly demand for a particular automobile manufacturer follows a normal
distribution with a mean of 40,000 cars and a standard deviation of 10,000. Below you
will find probability and percentile calculations related to the customer purchase
amounts. Use this information to answer the following questions.
Probability Calculations
P(Sales < 2,000,000) = 0.134, P(Sales < 2,050,000) = 0.339
P(Sales < 2,100,000) = 0.609, P(Sales < 2,150,000) = 0.834
Percentiles Calculations
1st percentile = 1,912,245, 5th percentile = 1,961,388
95th percentile = 2,198,612, 99th percentile = 2,247,755
NARREND
What number of cars, equidistant from the mean, such that 98% of car sales are
between these values?
Excel's built-in functions, along with the RAND function, can be used to generate
random numbers from many different types of probability distributions.
NARRBEGIN: SA_72_81
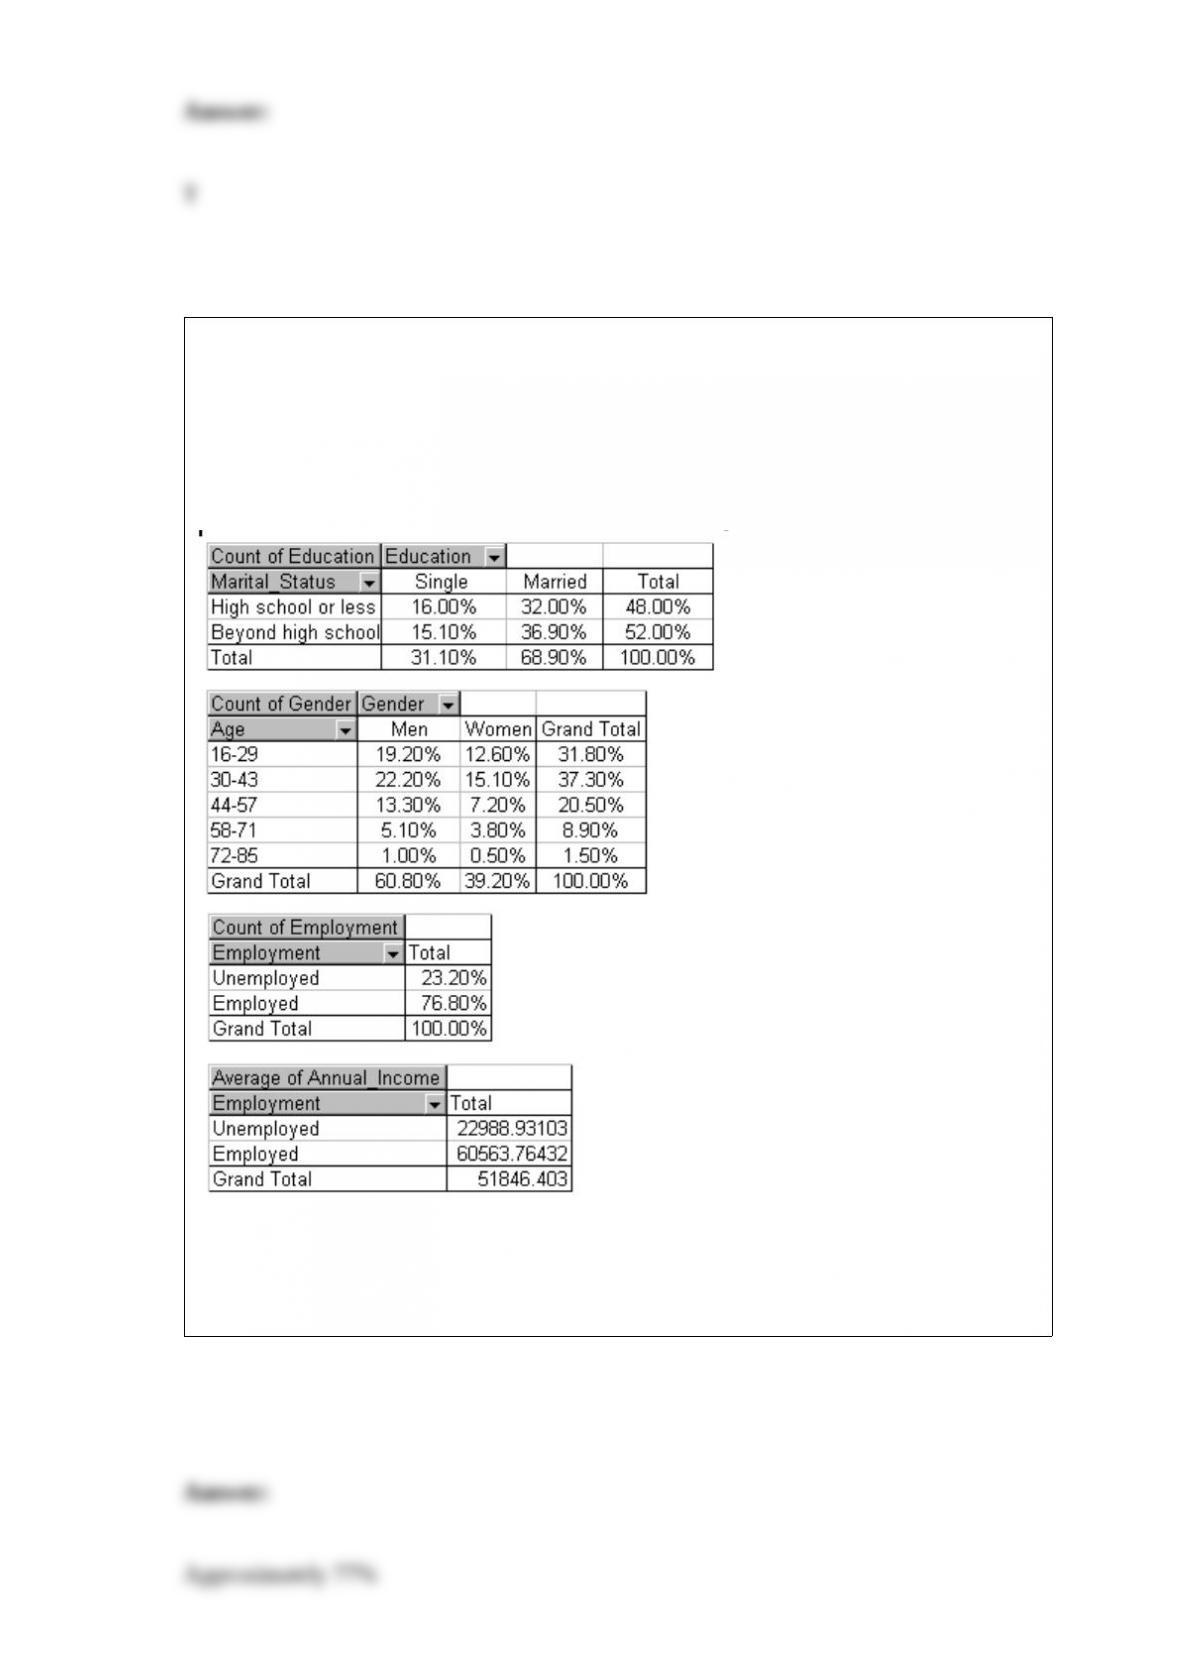
A recent survey data collected from 1000 randomly selected Internet users. The
characteristics of the users include their gender, age, education, marital status and
annual income. Using Excel, the following pivot tables were produced.
NARREND
Approximate the percentage of these Internet users who are currently employed.

When samples of size n are drawn from a population, then the sampling distribution of
the sample mean is approximately normal, provided that n is reasonably large.
The randomized response technique is a way of getting at sensitive information to avoid
estimation errors due to nontruthful responses.
Suppose A and B are two events where P(A) = 0.5, P(B) = 0.4, and P(A and B) = 0.2,
then P(B/A) = 0.5.
The Poisson random variable is a discrete random variable with infinitely many
possible values.
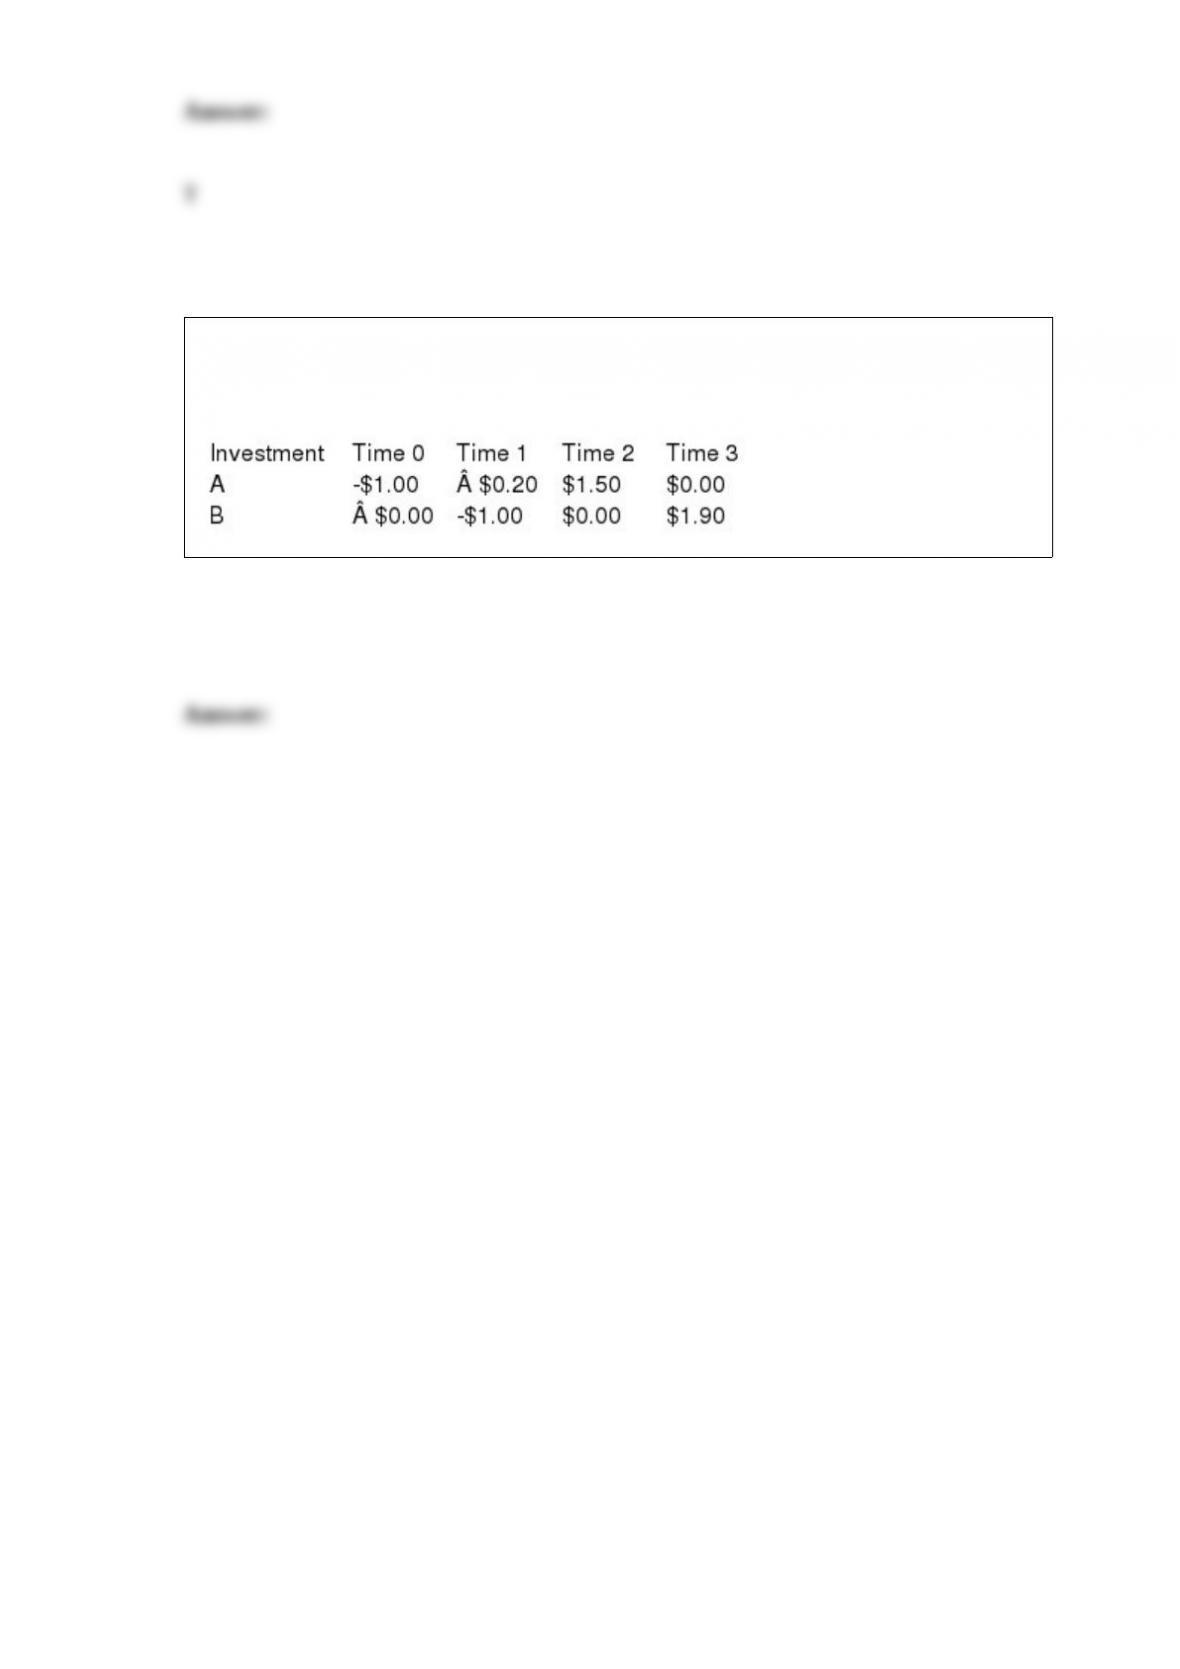
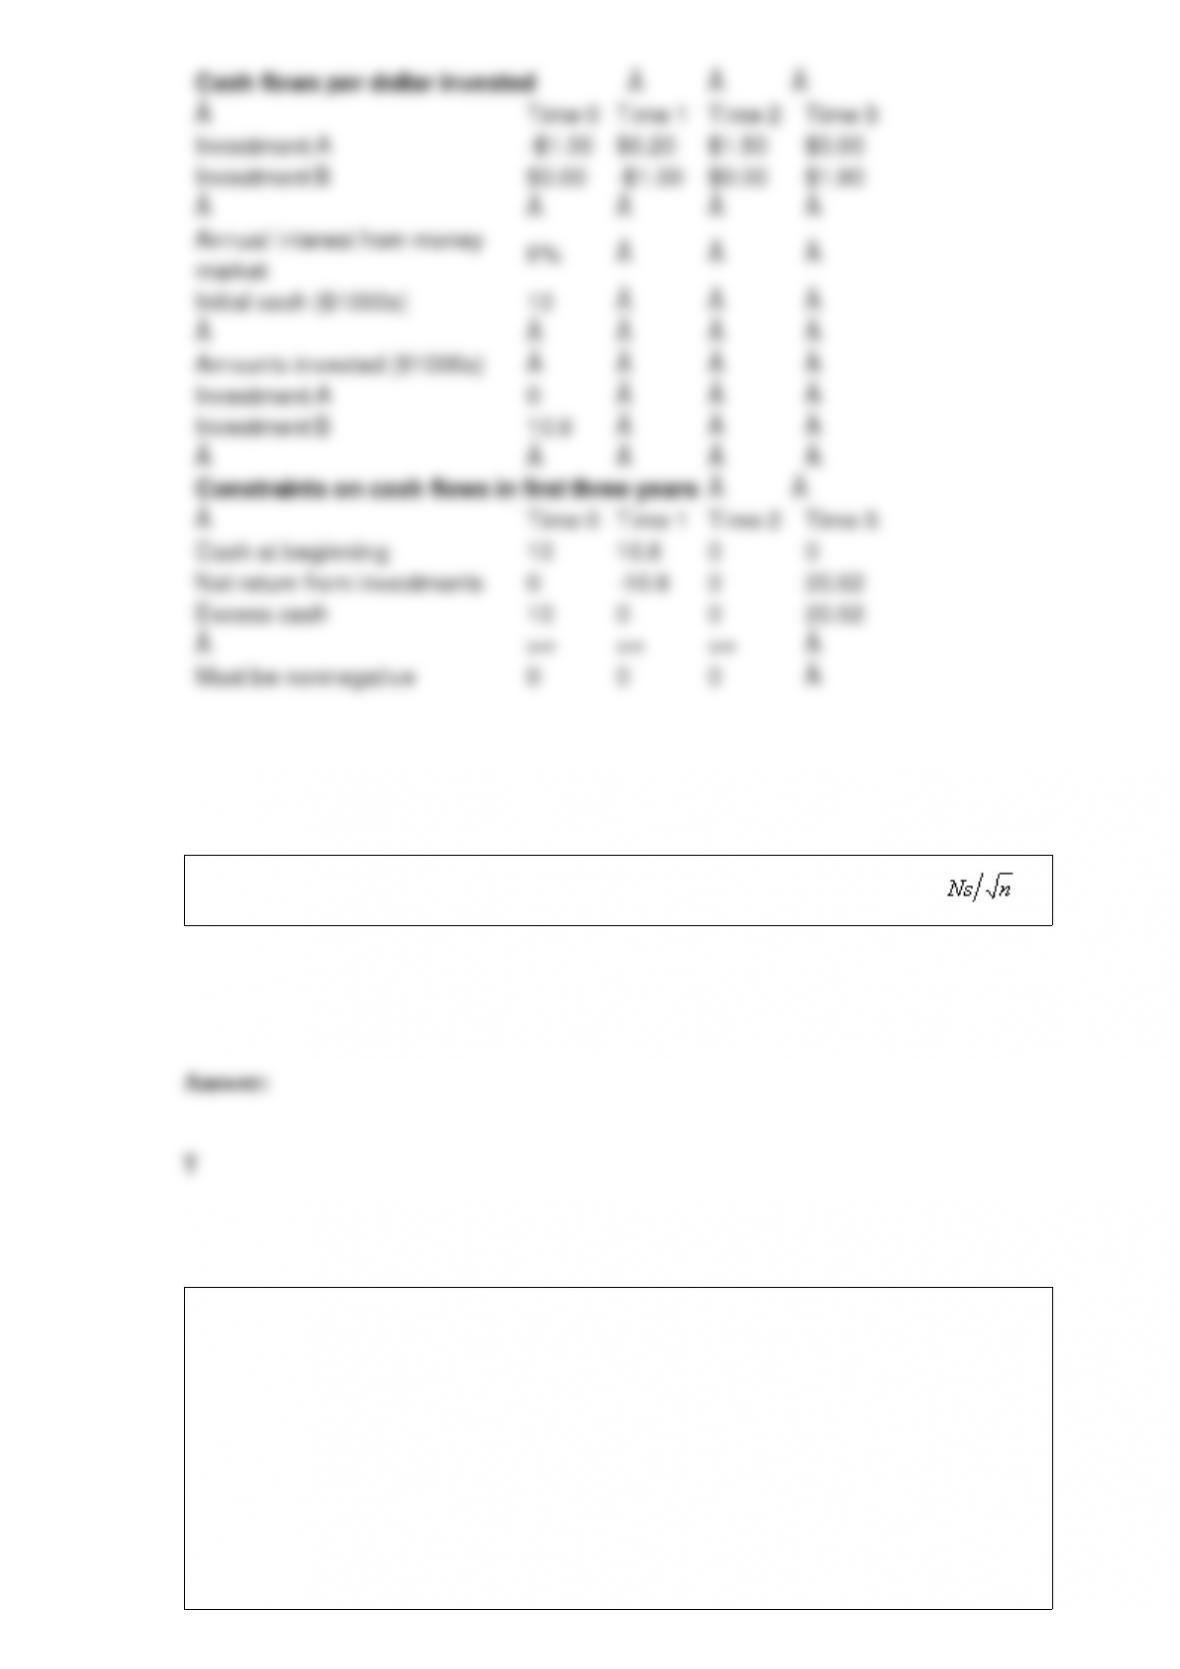
At time 0, you have $10,000. Investments A and B are available; their cash flows are
shown in the table below: Assume that any money not invested in A or B earns interest
at an annual rate of 8%. Determine how to maximize your cash on hand at time 3.
The approximate standard error of the point estimate of the population total is .
NARRBEGIN: SA_68_73
Suppose that GM earns a $4000 profit each time a person buys a car. We want to
determine how the expected profit earned from a customer depends on the quality of
GM's cars. The customer is assumed to buy a new car every five years, for a total of 10
cars through her lifetime. The customer will keep buying GM cars so long as they are
satisfied with them. The probability that the customer will be satisfied with her GM car
is 80%. If she is not satisfied with her GM car, she will buy another brand (we"ll call all
other brands cumulatively "Toyota"). The probability that she is satisfied with "Toyota"
is 85%.

NARREND
What if the GM satisfaction rate is raised further to 90%. What would the customer
NPV be in that case?
The mean and standard deviation of a normally distributed random variable which has
been "standardized" are zero and one, respectively.
An exponential distribution with parameter = 0.2 has mean and standard deviation
both equal to 5.


