
When the error variance is nonconstant, it is common to see the variation increases as
the explanatory variable increases (you will see a “fan shape” in the scatterplot). There
are two ways you can deal with this phenomenon. These are:
a. the weighted least squares and a logarithmic transformation
b. the partial F and a logarithmic transformation
c. the weighted least squares and the partial F
d. stepwise regression and the partial F
The p“value of a sample is the probability of seeing a sample with
a. at most as much evidence in favor of the null hypothesis as the sample actually
observed.
b. at most as much evidence in favor of the alternative hypothesis as the sample actually
observed.
c. at least as much evidence in favor of the null hypothesis as the sample actually
observed.
d. at least as much evidence in favor of the alternative hypothesis as the sample actually
observed.
NARRBEGIN: SA_94_99
A local truck rental company wants to use regression to predict the yearly maintenance
expense (Y), in dollars, for a truck using the number of miles driven during the year
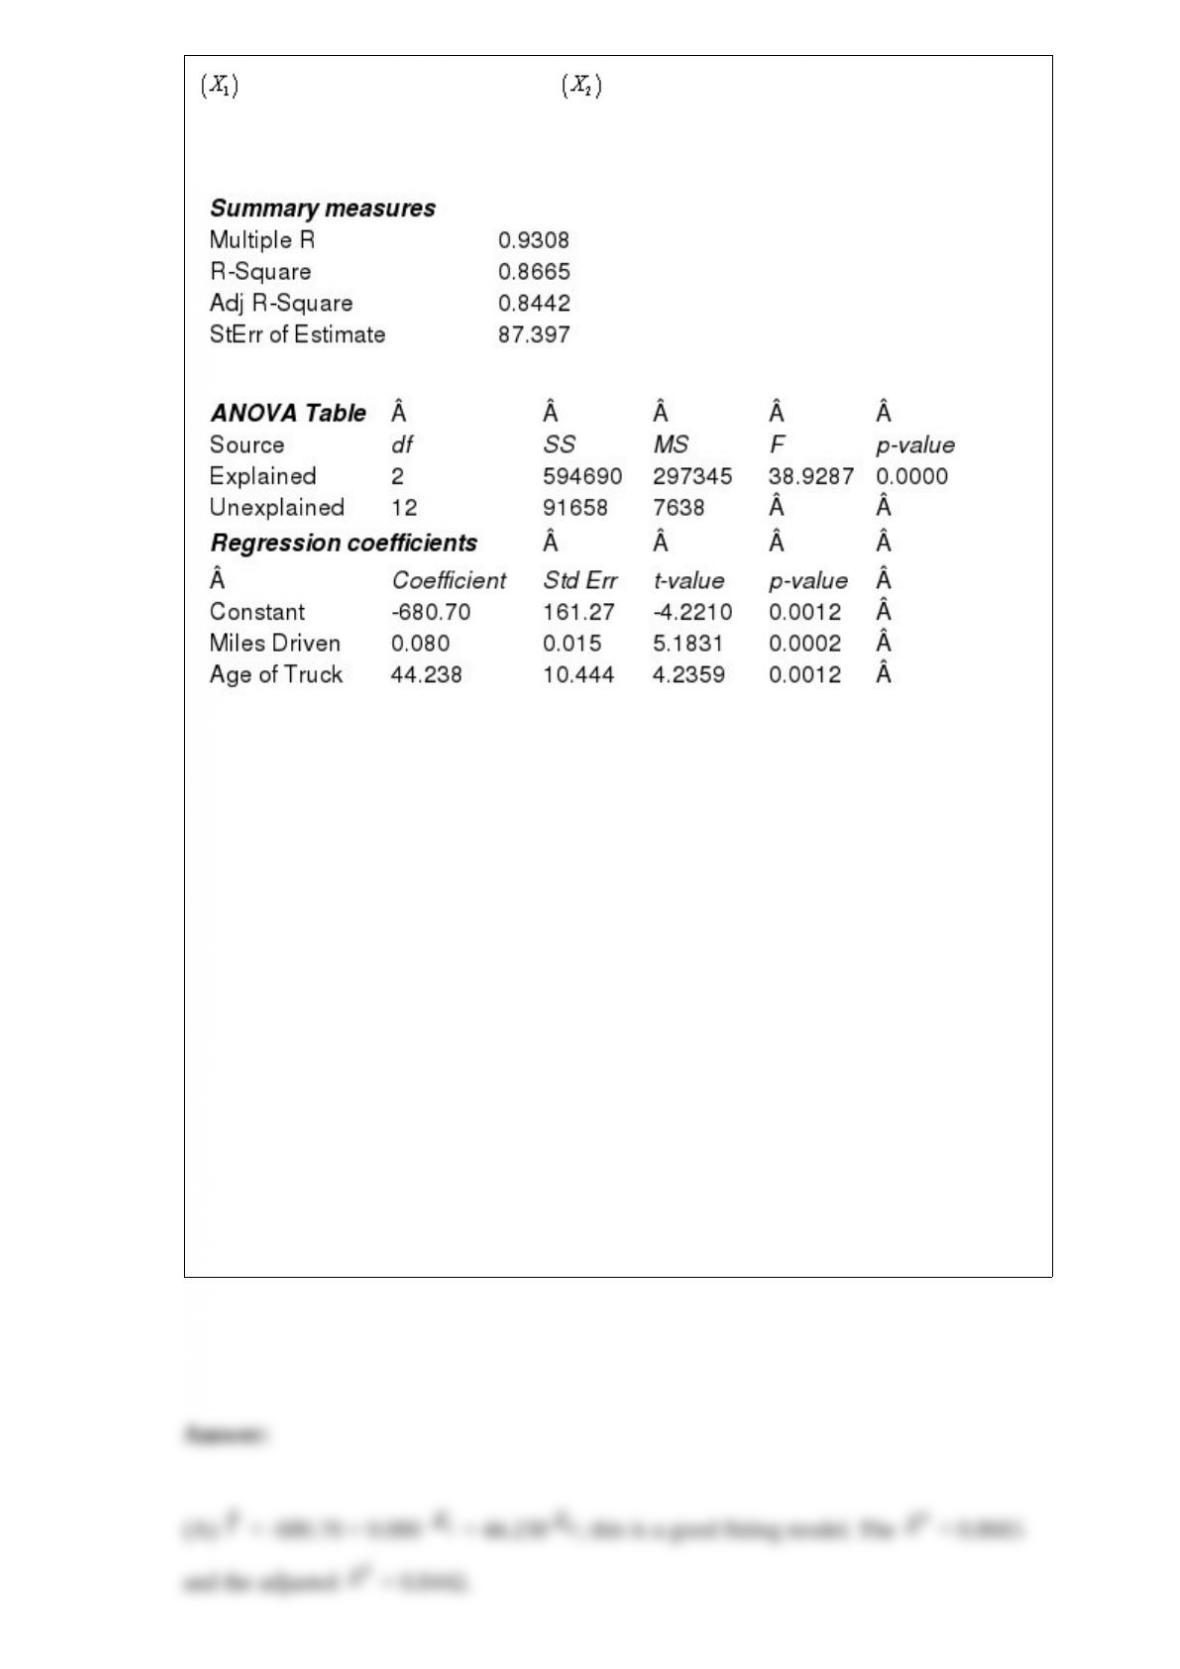
and the age of the truck in years at the beginning of the year. To examine the
relationship, the company has gathered the data on 15 trucks and regression analysis
has been conducted. The regression output is presented below.
NARREND
(A) Estimate the regression model. How well does this model fit the given data?
(B) Is there a linear relationship between the two explanatory variables and the
dependent variable at the 5% significance level? Explain how you arrived at your
answer.
(C) Use the estimated regression model to predict the annual maintenance expense of a
truck that is driven 14,000 miles per year and is 5 years old.
(D) Find a 95% prediction interval for the maintenance expense determined in (C). Use
a t-multiple = 2.
(E) Find a 95% confidence interval for the maintenance expense for all trucks sharing
the characteristics provided in Question 96. Use a t-multiple = 2.
(F) How do you explain the differences between the widths of the intervals in (D) and
(E)?
We study relationships among numerical variables using
a. Correlation
b. Covariance
c. Scatterplots
d. All of these options
e. None of these options

In regression analysis, if there are several explanatory variables, it is called:
a. simple regression
b. multiple regression
c. compound regression
d. composite regression
A variable is classified as ordinal if:
a. there is a natural ordering of categories
b. there is no natural ordering of categories
c. the data arise from continuous measurements
d. we track the variable through a period of time
NARRBEGIN: SA_77_79
The CEO of a software company is committed to expanding the proportion of highly
qualified women in the organization’s staff of salespersons. He believes that the
proportion of women in similar sales positions across the country in 2004 is less than
45%. Hoping to find support for his belief, he directs his assistant to collect a random
sample of salespersons employed by his company, which is thought to be representative
of sales staffs of competing organizations in the industry. The collected random sample
of size 50 showed that only 18 were women.
NARREND
(A) State the appropriate null and alternative hypotheses in this situation.
(B) Test this CEO’s belief at the =.05 significance level and report the p-value. Do
you find statistical support for his hypothesis that the proportion of women in similar
sales positions across the country is less than 40%?
(C) Suppose the sample size above is 100, instead of 50, and the sample proportion is
again 0.36. Would this change your results in (B)? Explain your answer.
NARRBEGIN: SA_88_90
Senior management of a consulting services firm is concerned about a growing decline
in the firm’s weekly number of billable hours. The firm expects each professional
employee to spend at least 40 hours per week on work. In an effort to understand this
problem better, management would like to estimate the standard deviation of the
number of hours their employees spend on work-related activities in a typical week.
Rather than reviewing the records of all the firm’s full-time employees, the management
randomly selected a sample of size 50 from the available frame. The sample mean and
sample standard deviations were 48.5 and 7.5 hours, respectively.
NARREND
(A) Construct a 99% confidence interval for the standard deviation of the number of
hours this firm’s employees spend on work-related activities in a typical week.
(B) Interpret the 99% confidence interval constructed in (A).
(C) Given the target range of 40 to 60 hours of work per week, should senior
management be concerned about the number of hours their employees are currently
devoting to work? Explain why or why not.

In linear regression, we can have an interaction variable. Algebraically, the interaction
variable is theother variables in the regression equation.
a. sum
b. ratio
c. product
d. mean
Bayes’ Rule is useful for?
a. Value of Sample Information
b. Value of Perfect Information
c. Sensitivity Analysis
d. All of these options
e. None of these options

In a single-stage decision tree problem, all ___________ are made first and then all
___________ is (are) resolved.
a. decisions; uncertainty
b. calculations; probabilities
c. EMV calculations; posterior probabilities
d. likelihoods; posterior probabilities
e. prior probabilities; joint probabilities
Correlation and covariance measure
a. The strength of a linear relationship between two numerical variables
b. The direction of a linear relationship between two numerical variables
c. The strength and direction of a linear relationship between two numerical variables
d. The strength and direction of a linear relationship between two categorical variables
e. None of these options
In regression analysis, the variable we are trying to explain or predict is called the

a. independent variable
b. dependent variable
c. regression variable
d. statistical variable
e. residual variable
The binomial probability distribution is used with
a. a discrete random variable
b. a continuous random variable
c. either a discrete or a continuous random variable, depending on the variance
d. either a discrete or a continuous random variable, depending on the sample size
The forecast error is the difference between
a. this period’s value and the next period’s value
b. the average value and the expected value of the response variable
c. the explanatory variable value and the response variable value

d. the actual value and the forecast
The power of a test is the probability that we
a. reject the null hypothesis when the alternative hypothesis is false
b. reject the null hypothesis when the alternative hypothesis is true
c. accept the null hypothesis when the alternative hypothesis is false
d. accept the null hypothesis when the alternative hypothesis is true
Each different set of values obtained for the uncertain quantities in a simulation model
can considered to be:
a. the mean of the probability distribution.
b. a scenario.
c. a best guess.
d. all of these options.
NARRBEGIN: SA_135_140
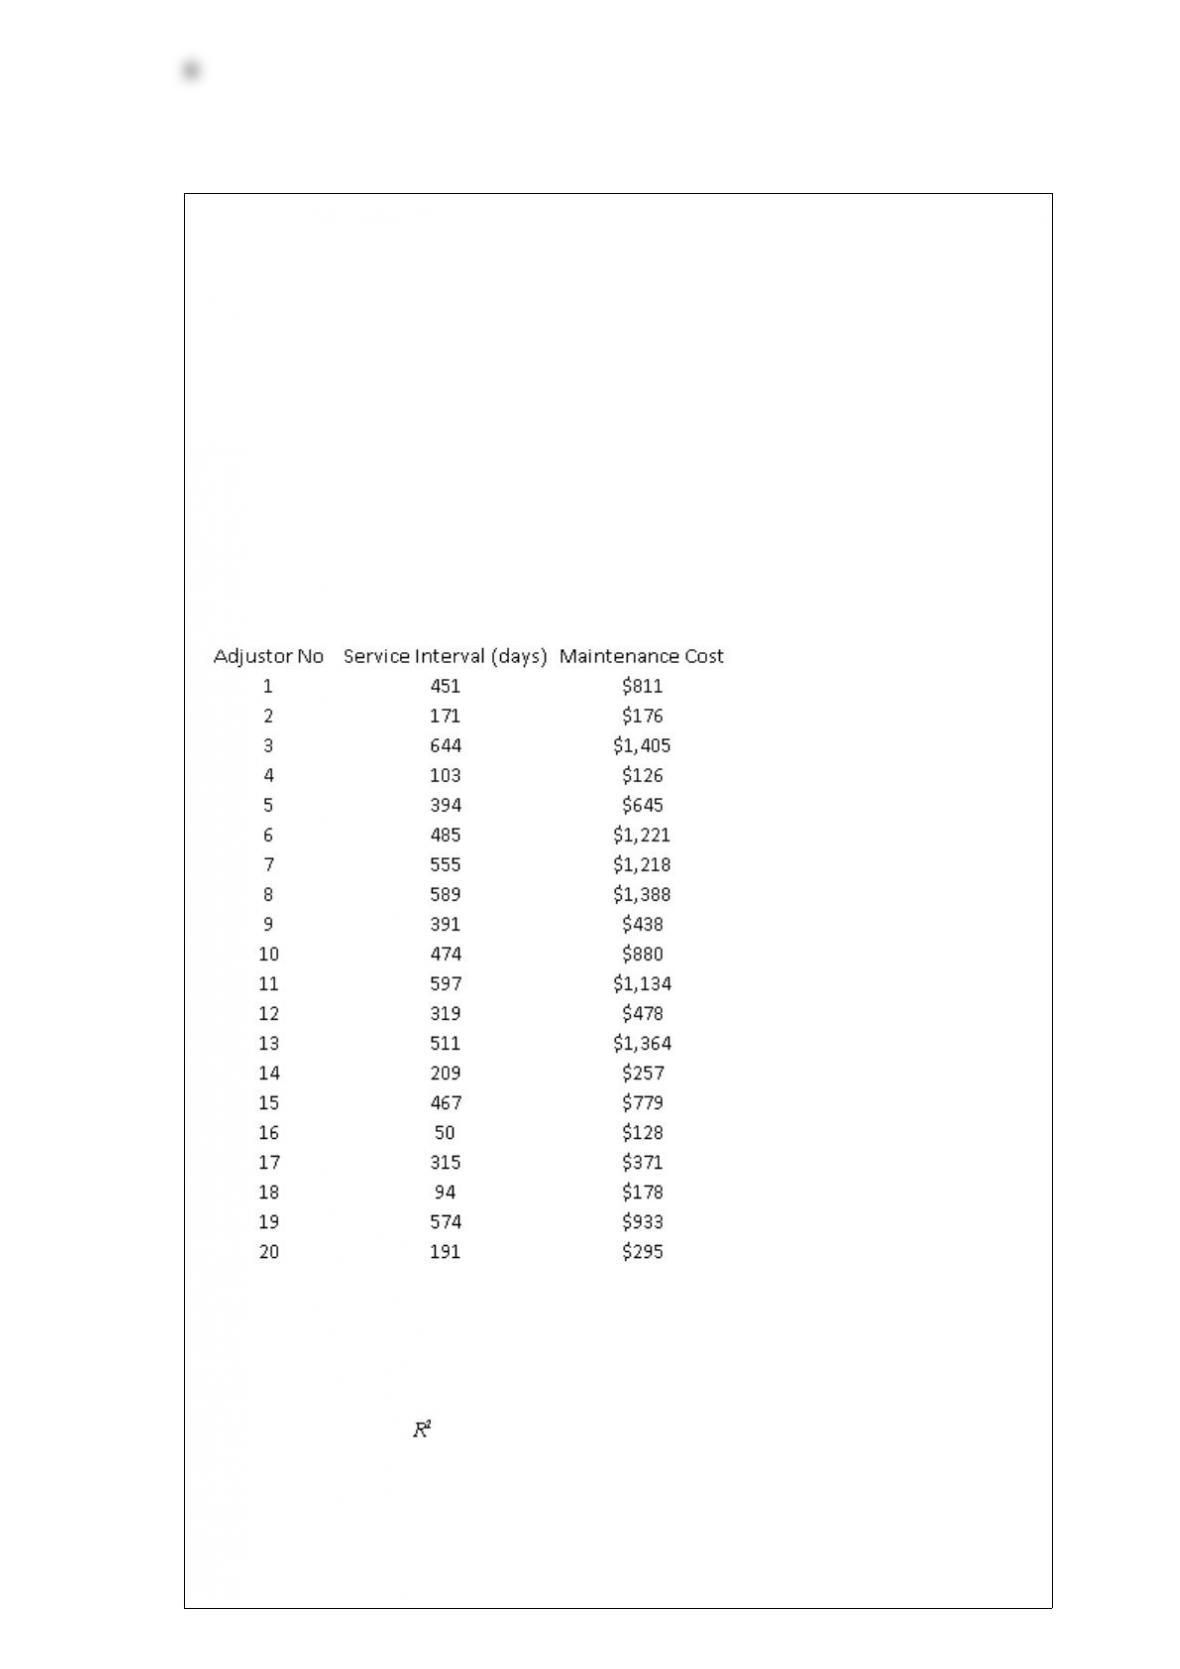
Adjustors working for a large insurance agency are each given a company car which
they use on the job to travel to client locations to inspect damage to homes and
automobiles that are covered by the agency. Although the cars are owned by the agency,
maintenance is currently left up to the discretion of the adjustors, who are reimbursed
for any costs they report. The agency believes that the lack of a maintenance policy has
led to unnecessary maintenance expenses. In particular, they believe that many agents
wait too long to have maintenance performed on their company cars, and that in such
cases, maintenance expenses are inordinately high. The agency recently conducted a
study to investigate the relationship between the reported cost of maintenance visits for
their company cars (Y) and the length of time since the last maintenance service (X).
The sample data are shown below:
NARREND
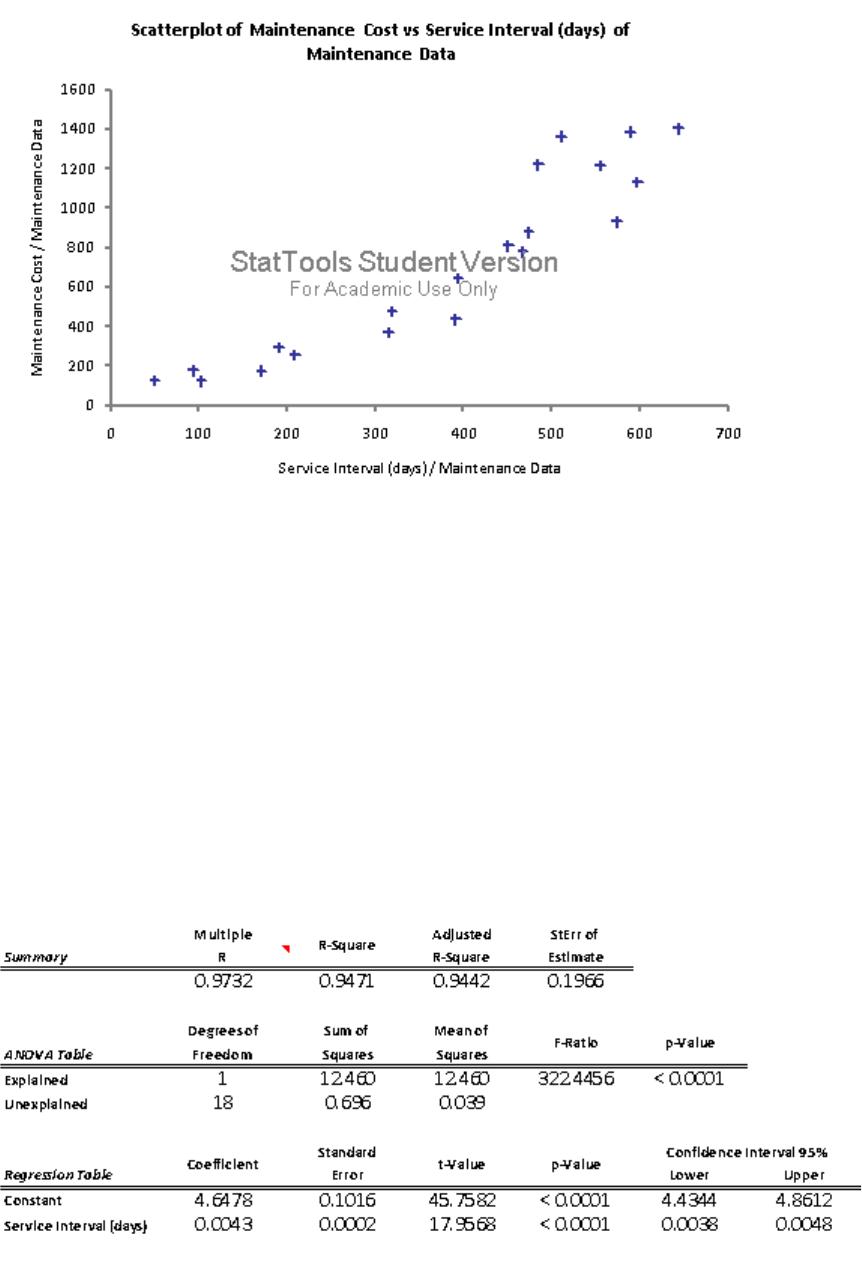
(A) Estimate a simple linear regression model with Service Interval (X) and
Maintenance Cost (Y). Interpret the slope coefficient of the least squares line as well as
the computed value of .
(B) Do you think this model proves the agency’s point about maintenance? Explain your
answer.
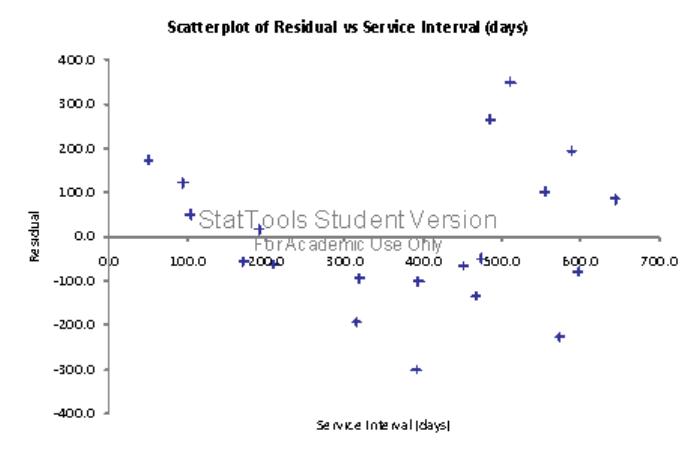
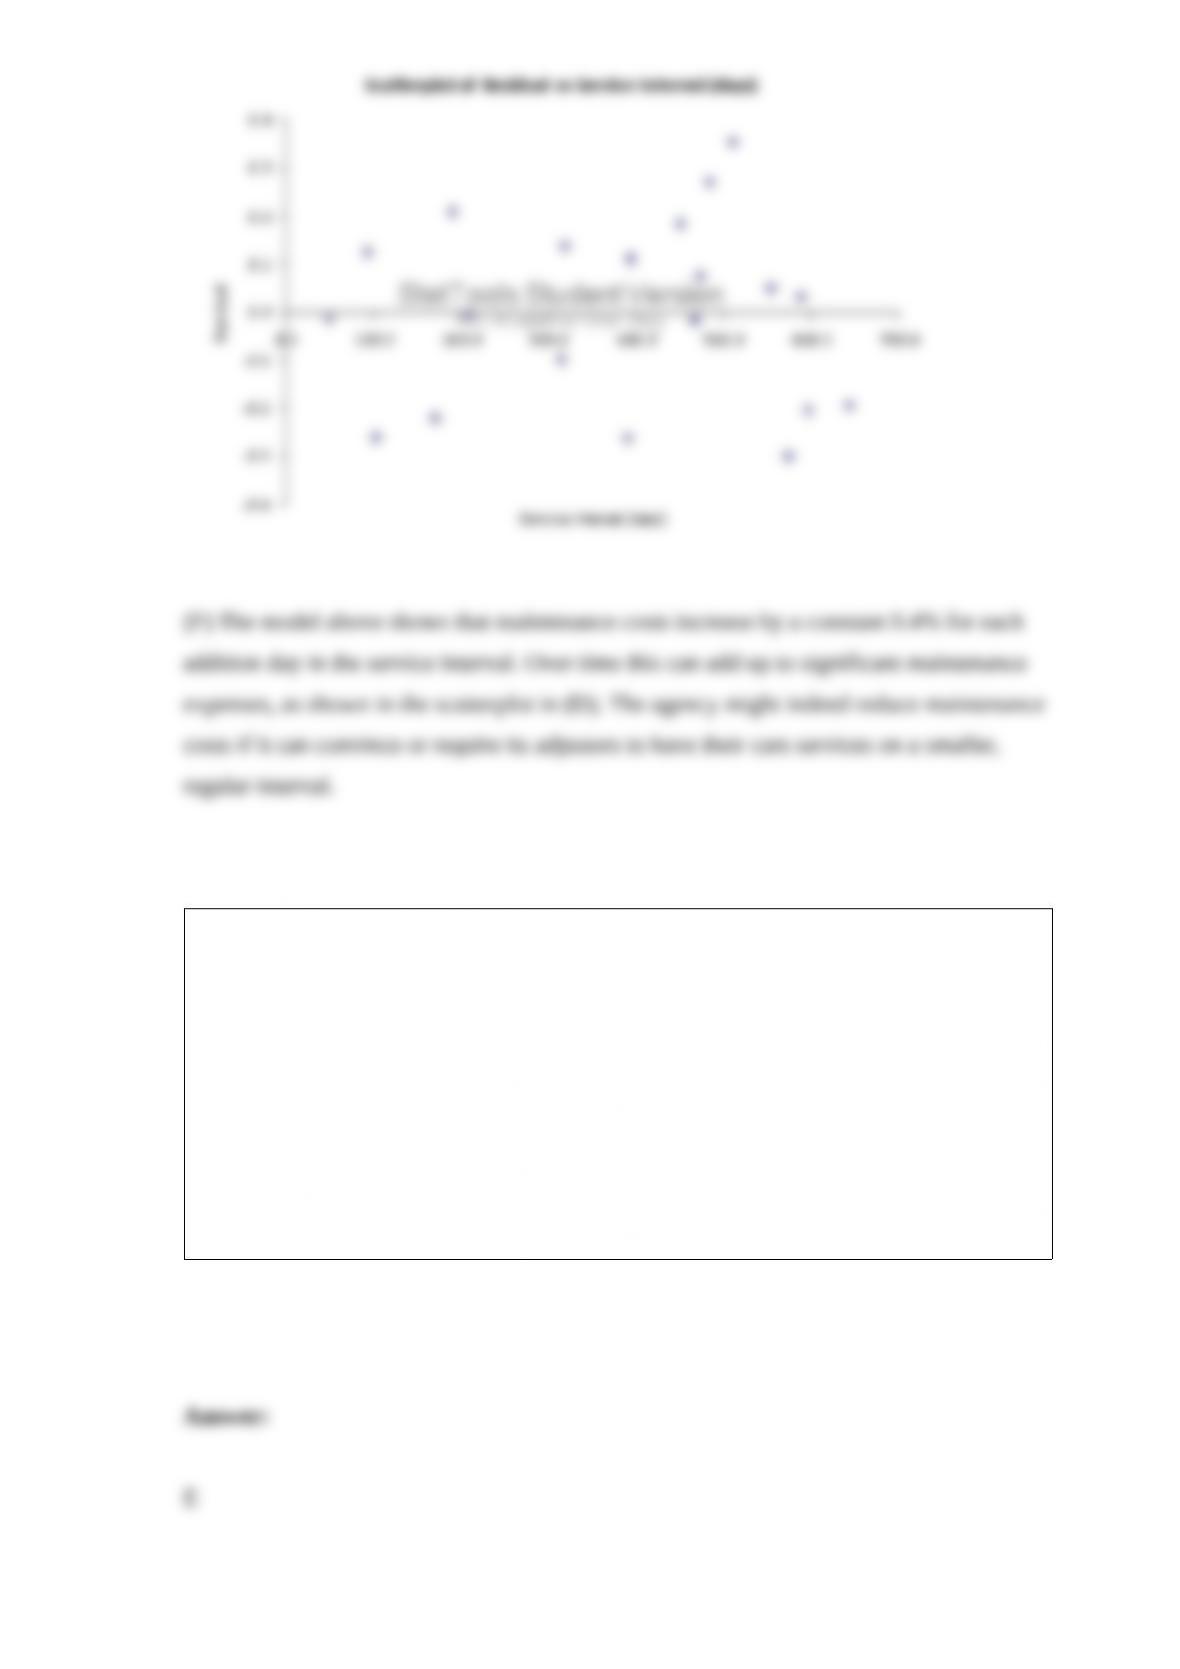
(C) Obtain a residual plot vs. Service Interval. Does this affect your opinion of the
validity of the model in (A)?
(D) Obtain a scatterplot of Maintenance Cost vs. Service Interval. Does this affect your
opinion of the validity of the model in (A)?
(E) Use what you have learned about transformations to fit an alternative model to the
one in (A).
(F) Interpret the model you developed in (E). Does it help you assess the agency’s
claim? What should the agency conclude about the relationship between service interval
and maintenance costs?
Examples of non-random patterns that may be evident on a time series graph include:
a. trends
b. increasing variance over time
c. a meandering pattern
d. too many zigzags
e. all of these options

A type I error occurs when the:
a. null hypothesis is incorrectly accepted when it is false
b. null hypothesis is incorrectly rejected when it is true
c. sample mean differs from the population mean
d. test is biased
The additivity property of linear programming implies that the contribution of any
decision variable to the objective is of/on the levels of the other decision variables.
a. dependent
b. independent
c. conditional
d. the sum
NARRBEGIN: SA_91_102
Western Chassis produces high-quality polished steel and aluminum sheeting and two
lines of industrial chassis for the rack mounting of Internet routers, modems, and other
telecommunications equipment. The contribution margin (contribution toward profit)
for steel sheeting is $0.40 per pound and for aluminum sheeting is $0.60 per pound.
Western earns $12 contribution on the sale of a Standard chassis rack and $15
contribution on a Deluxe chassis rack. During the next production cycle, Western can
buy and use up to 25,800 pounds of raw unfinished steel either in sheeting or in chassis.

Similarly, 20,400 pounds of aluminum are available. One standard chassis rack requires
16 pounds of steel and 8 pounds of aluminum. A Deluxe chassis rack requires 12
pounds of each metal. The output of metal sheeting is restricted only by the capacity of
the polisher. For the next production cycle, the polisher can handle any mix of the two
metals up to 4,000 pounds of metal sheeting. Chassis manufacture can be restricted by
either metal stamping or assembly operations; no polishing is required. During the cycle
no more than 2,500 total chassis can be stamped, and there will be 920 hours of
assembly time available. The assembly time required is 24 minutes for the Standard
chassis rack and 36 minutes for the Deluxe chassis rack. Finally, market conditions
limit the number of Standard chassis racks sold to no more than 1,200 Standard and no
more than 1,000 Deluxe. Any quantities of metal sheeting can be sold.
NARREND
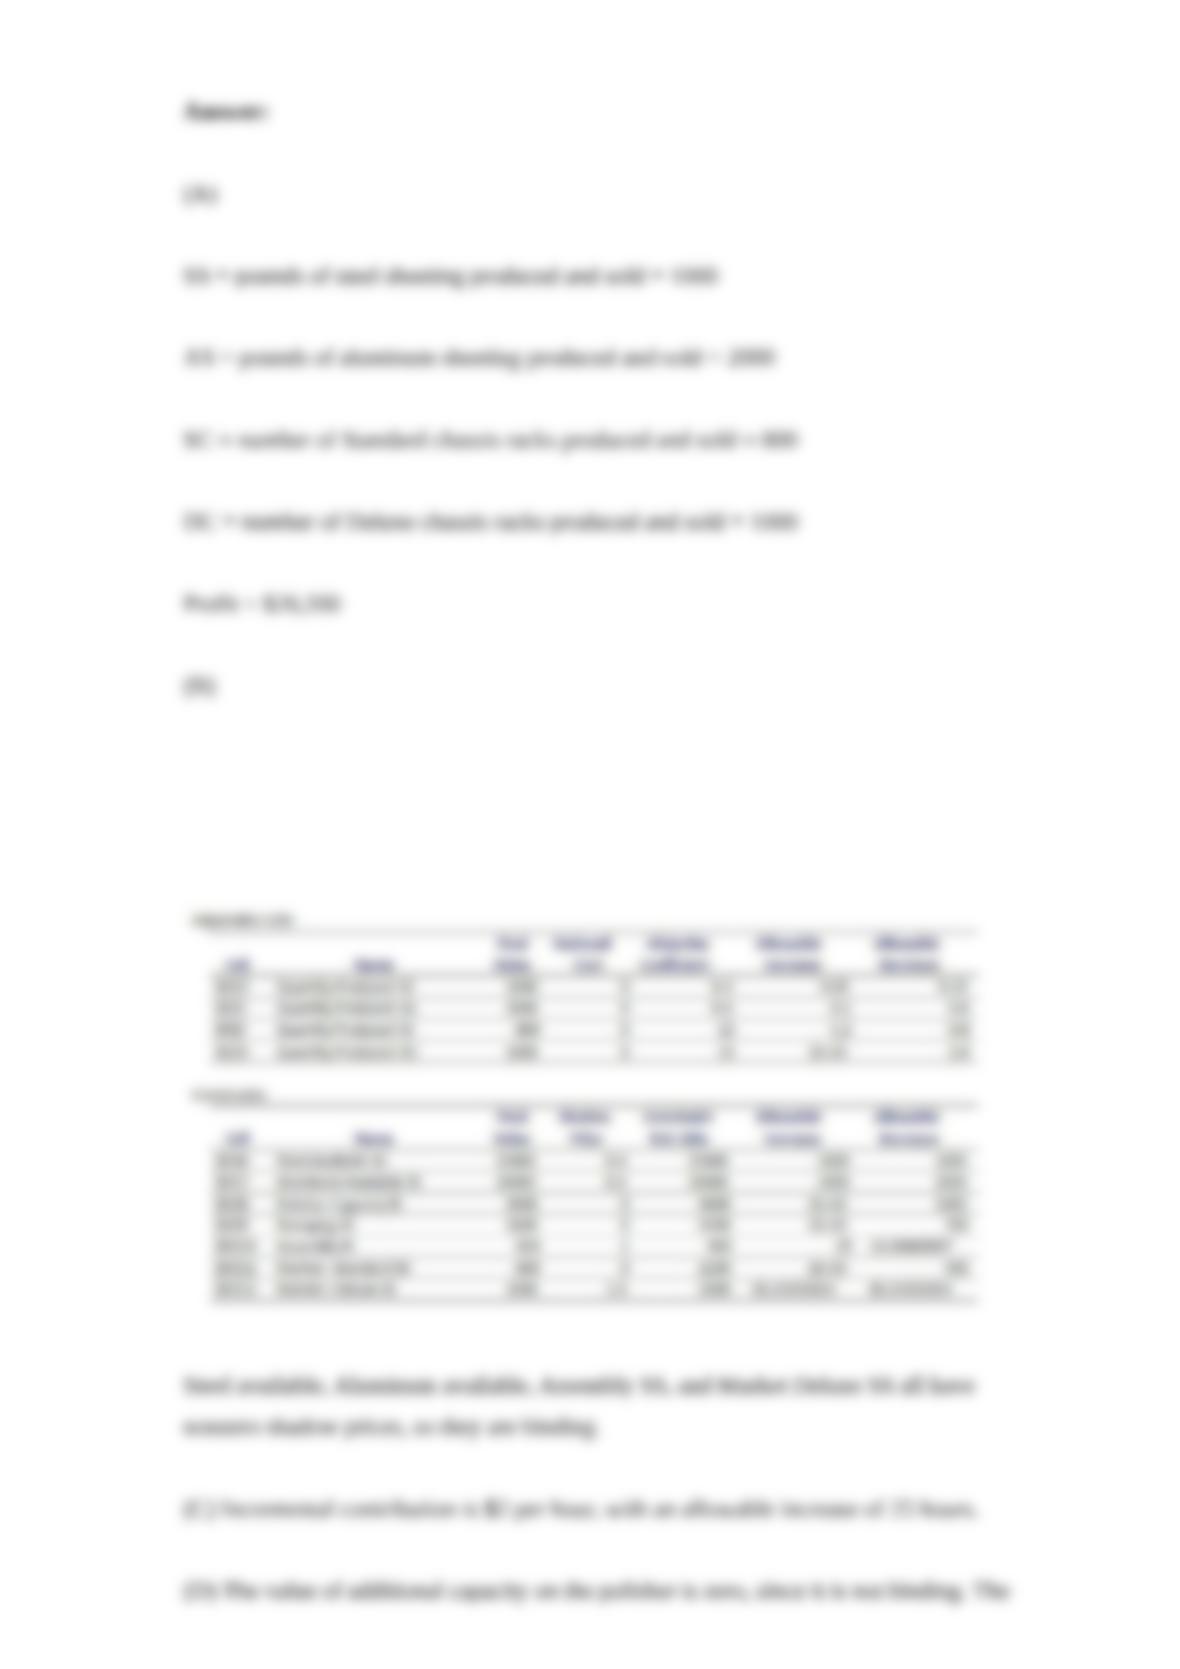
(A) Find an optimal solution to the problem. What is the production plan, and what is
the total revenue?
(B) Obtain a sensitivity report for the solution reported in (A). Which constraints are
binding?
(C) What is the incremental contribution associated with adding an hour of assembly
time? Over what range of increase is the marginal value valid?
(D) What is the value of additional capacity on the polisher? How much increase and
decrease in this capacity is possible before a change occurs in the optimal production
schedule?
(E) An advertising agency has devised a marketing plan for the Valley Chassis
Company that will increase the market for Deluxe chassis. The plan will increase
demand by 75 Deluxe chassis per month at a cost of $100 per month. Should Valley
adopt the plan? Briefly explain why.
(F) Suppose that four more hours of chassis assembly time could be made available.
How much would profit change?
(G) Suppose next that Valley’s marketing department proposes lowering the price for a
standard chassis from $12 to $11.50 so that more can be sold (since there is slack under
the demand constraint). Would the optimal solution change? Explain why, or why not.
(H) If Valley could obtain 1,000 pounds more of raw material (steel or aluminum),
which should it procure? How much should they be willing to pay per pound for the
steel or aluminum? Explain your answer.
(I) In doing some contingency planning, Valley thinks that the aging stamping machine
will soon need to be taken down for repairs that could last 2 months and will cost
$10,000. During that time, they can continue to operate by outsourcing the stamping at
$2.50 per chassis (deluxe or standard), although the capacity will be reduced from
2,500 to 1,500. What will be the total cost to repair the stamping machine?
When there is a problem with Solver being able to find a solution, many times it is an
indication of a (n):
a. older version of Excel
b. nonlinear programming problem
c. problem that cannot be solved using linear programming
d. mistake in the formulation of the problem

The formal way to revise probabilities based on new information is to use:
a. complementary probabilities
b. conditional probabilities
c. unilateral probabilities
d. common sense probabilities
Workforce scheduling problems are often integer programming models, which means
that they have:
a. an integer objective function
b. integer decision variables
c. integer constraints
d. all of these options
The RAND() function in excel models which of the following probability distributions:
a. Normal(0,1)

b. Uniform(0,1)
c. Normal(-1,1)
d. Uniform(-1,1).
Winters’ model differs from Holt’s model and simple exponential smoothing in that it
includes an index for:
a. seasonality
b. trend
c. residuals
d. cyclical fluctuations
An example of a problem where the sample data would be paired is:
a. Difference between the means of appraised and sales house prices
b. Difference between the proportion of defective items from two suppliers
c. Difference in the mean life of two major brands of batteries
d. Difference in the mean salaries for graduates in two different academic fields at a
university
e. None of these options
NARRBEGIN: SA_81_84
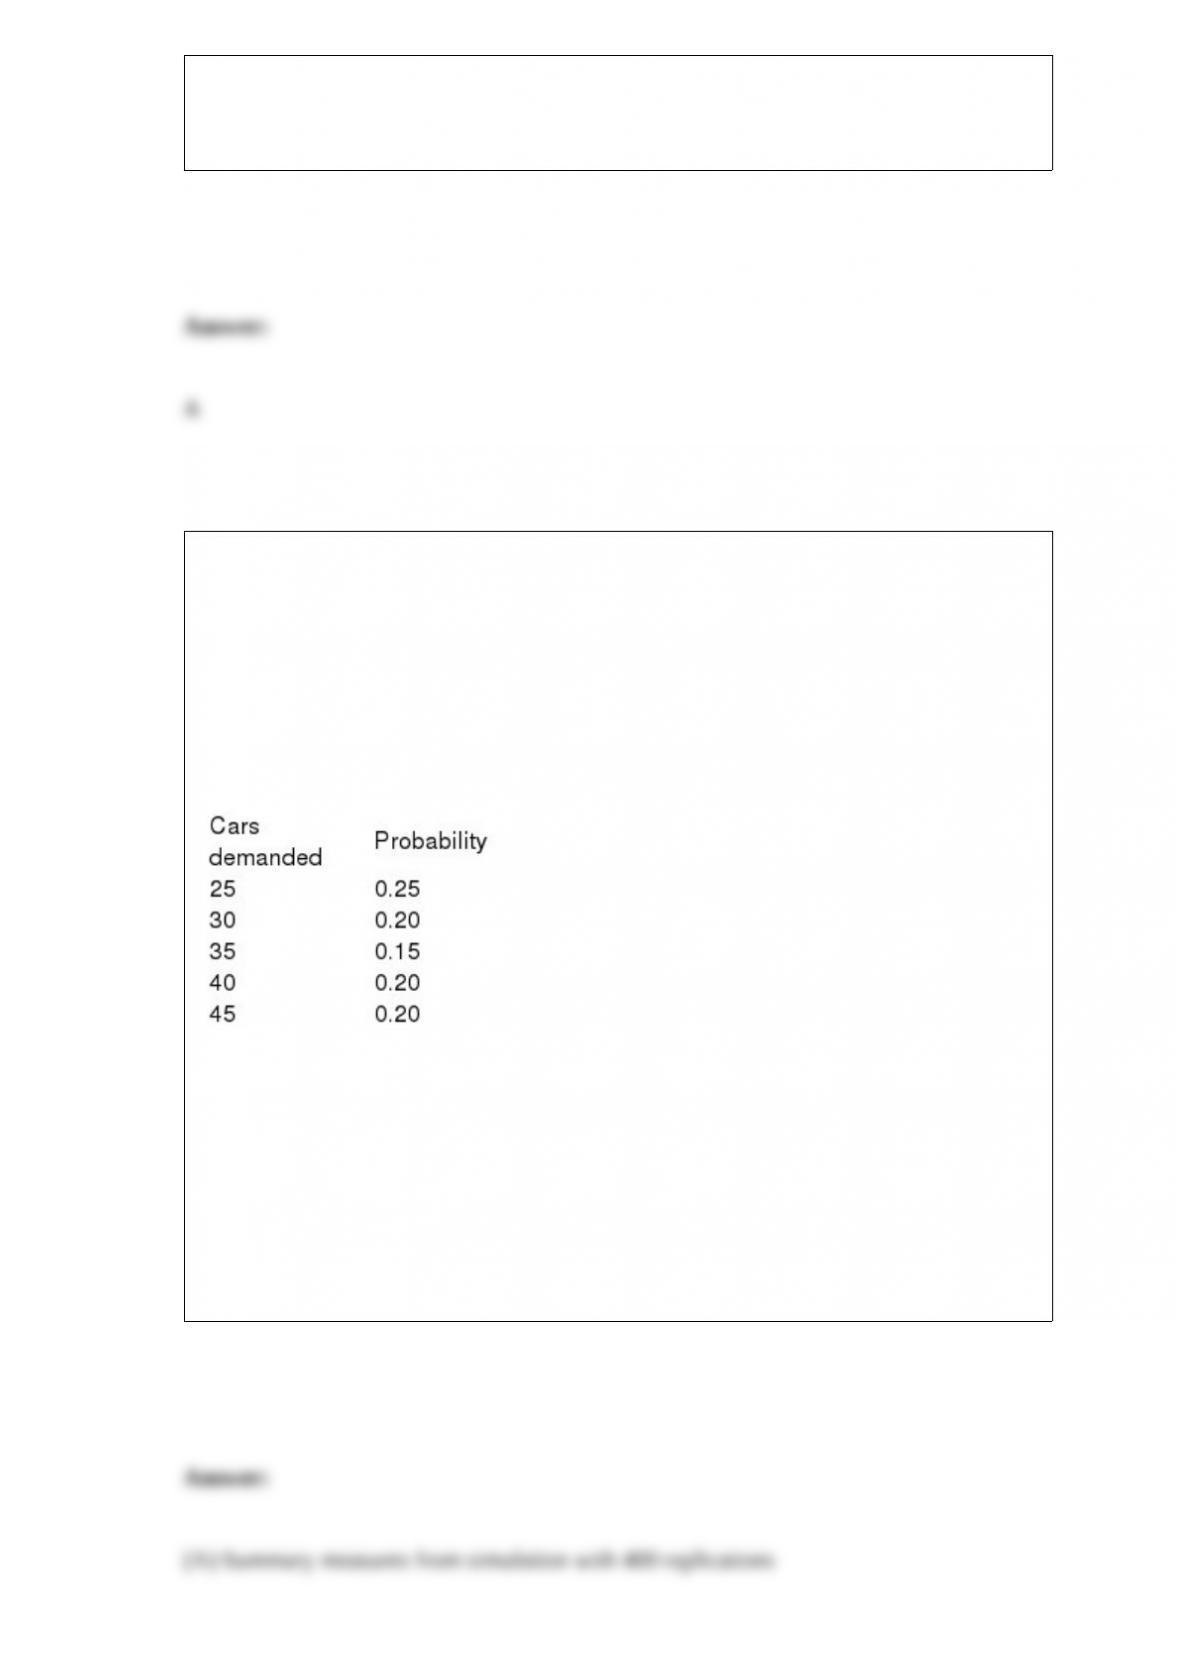
In August 2009, a car dealer is trying to determine how many 2010 cars to order. Each
car ordered in August 2009 costs $16,000. The demand for the dealer’s 2010 models has
the probability distribution shown in the table below. Each car sells for $21,000. If the
demand for 2010 cars exceeds the number of cars ordered in August 2009, the dealer
must reorder at a cost of $18,000 per car. Excess cars can be disposed of at $13,000 per
car.
NARREND
(A) Use simulation to determine how many cars the dealer should order in August, 2009
to maximize his expected profit.
(B) For the optimal order quantity, find a 95% confidence interval for the expected
profit.
(C) Why is it important to develop the confidence interval in (B)?

If the value of the standard normal random variable Z is positive, then the original score
is where in relationship to the mean?
a. equal to the mean
b. to the left of the mean
c. to the right of the mean
d. None of the above
NARRBEGIN: SA_57_64
Amanda is a recent college graduate, and has just started her first job. She would like to
know if she saves $5,000 per year out of her salary over the next 30 years what the
distribution of the value of her retirement fund after 30 years. She has decided that she
will invest all her money in the stock market that she estimates has a return that is
normally distributed with mean 12% per year and standard deviation 25%.
NARREND
What is the probability that Amanda will have less than $500,000 in her retirement
account after 30 years under the more conservative investing strategy?
In a simple linear regression problem, suppose that = 12.48 and =
124.8. Then the percentage of variation explained must be 0.90.
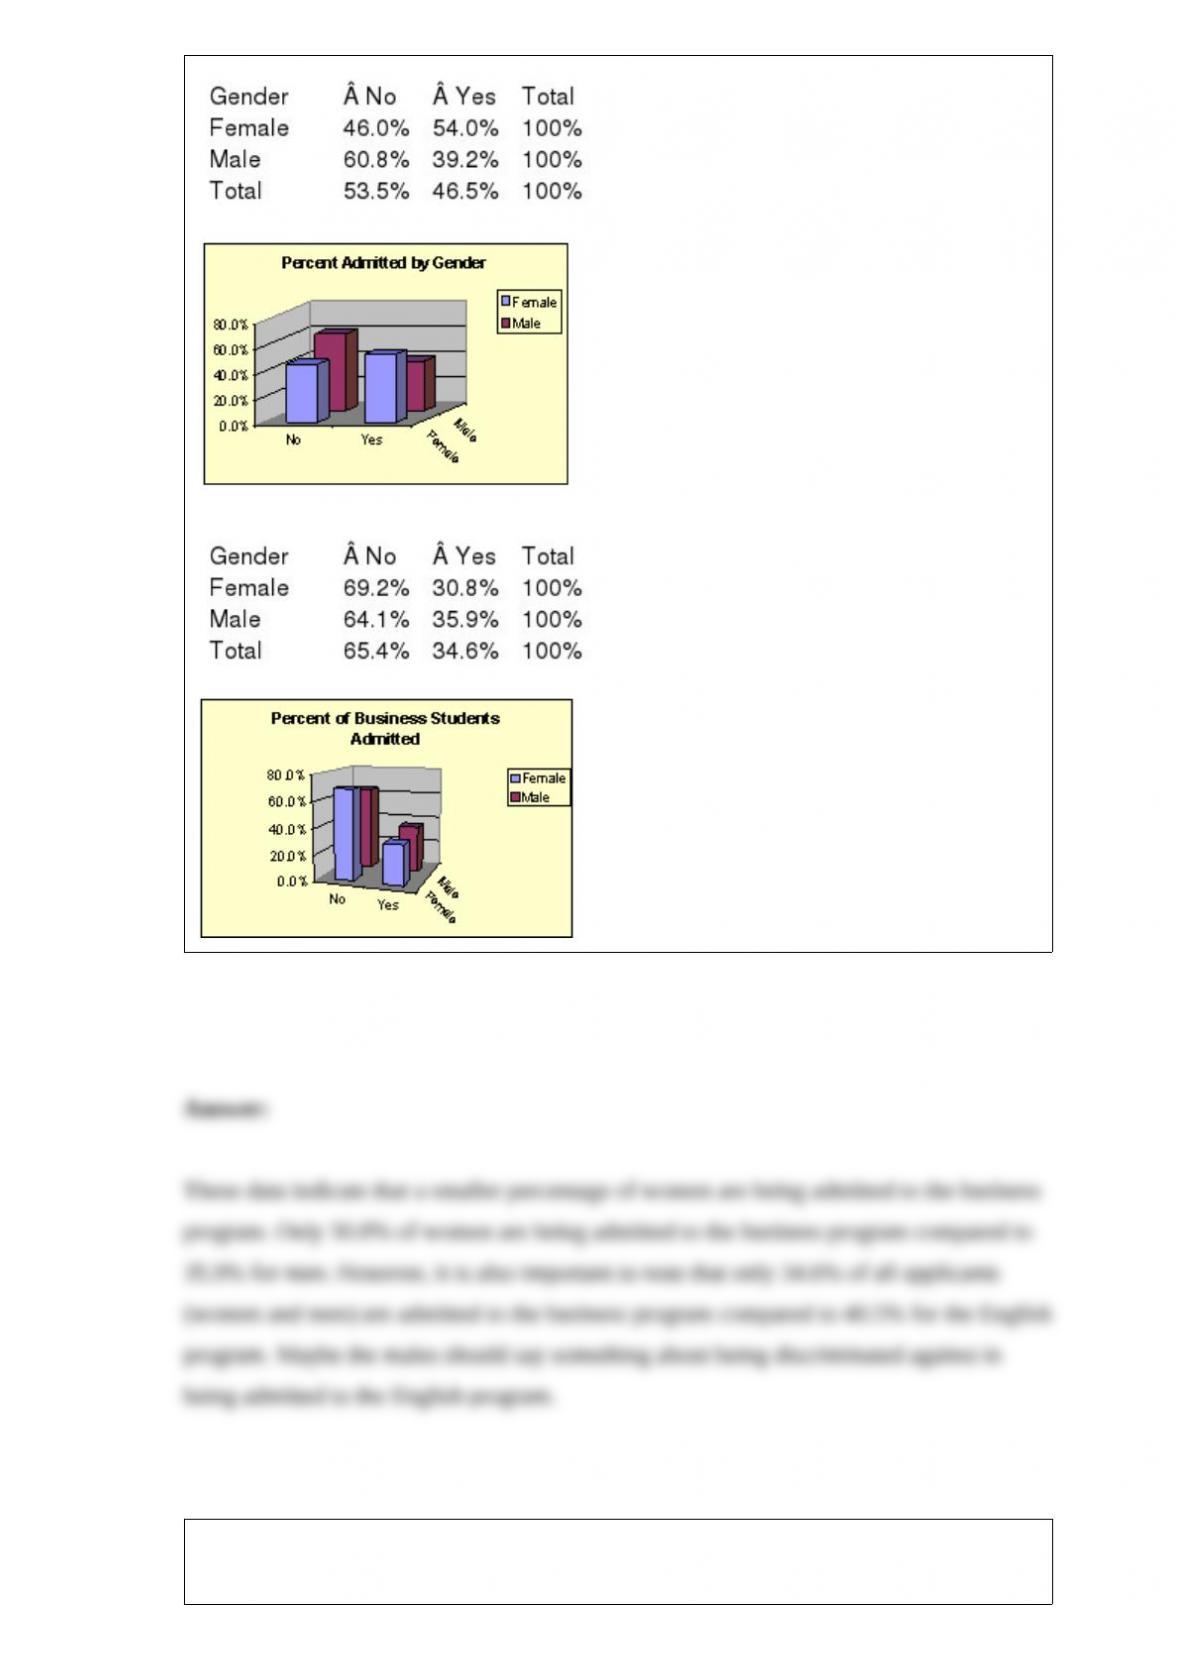
The students at small community college in Iowa apply to study either English or
Business. Some administrators at the college are concerned that women are being
discriminated against in being allowed admittance, particularly in the business program.
Below, you will find two pivot tables that show the percentage of students admitted by
gender to the English program and the Business school. The data has also been
presented graphically. What do the data and graphs indicate?
English program
Business school
NARRBEGIN: SA_78_85

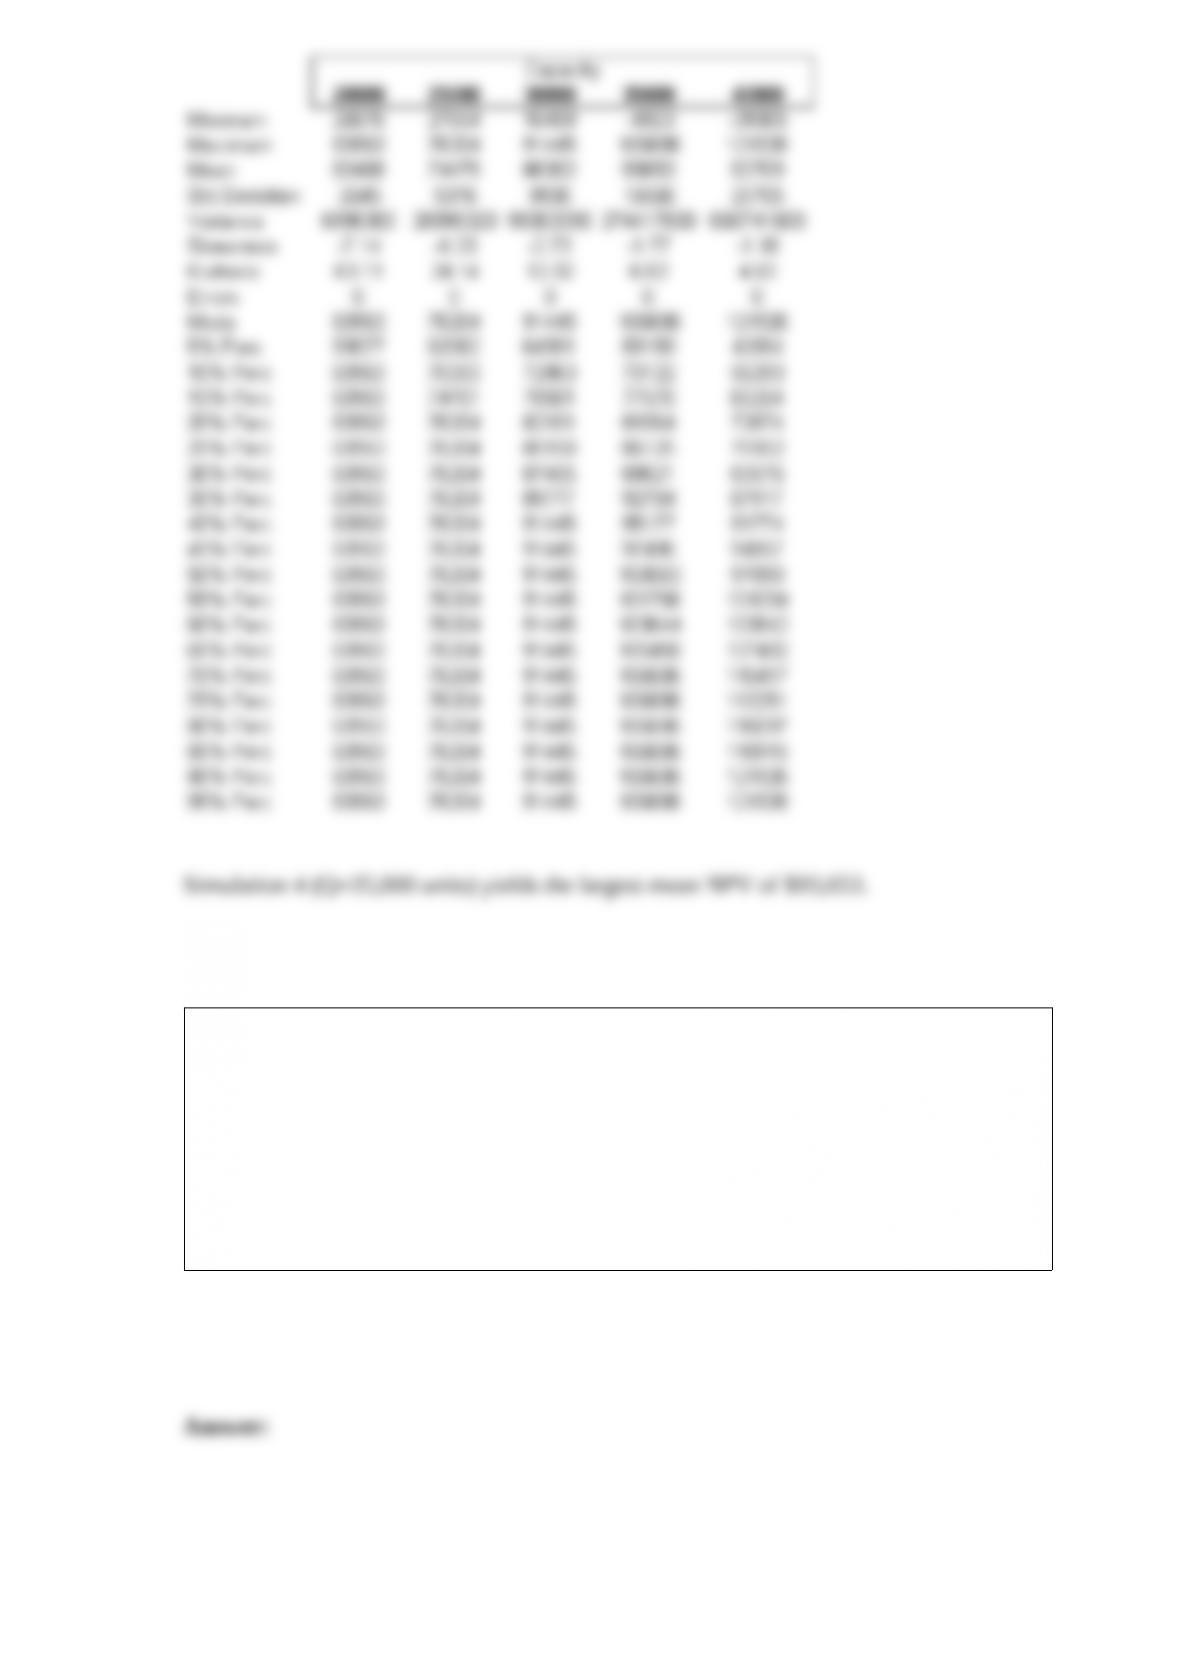
Suppose we want to choose capacity for a plant that will produce a new drug. In
particular, we want to choose the capacity that maximizes discounted expected profit
over the next 10 years. We have the following information:
Demand for the drug is expected to be normally distributed ~ Normal (50,000, 12,000).
A unit of capacity costs $16 to build.
The number of units produced will equal the demand, up to capacity limits.
The revenue per unit is $3.70 and the cost per unit is $0.20 (variable cost).
The maintenance cost per unit of capacity is $0.40 (fixed cost).
The discount rate is 10%.
NARREND
Use RISKSIMTABLE with a range of possible values to help the firm decide what the
plant capacity should be.
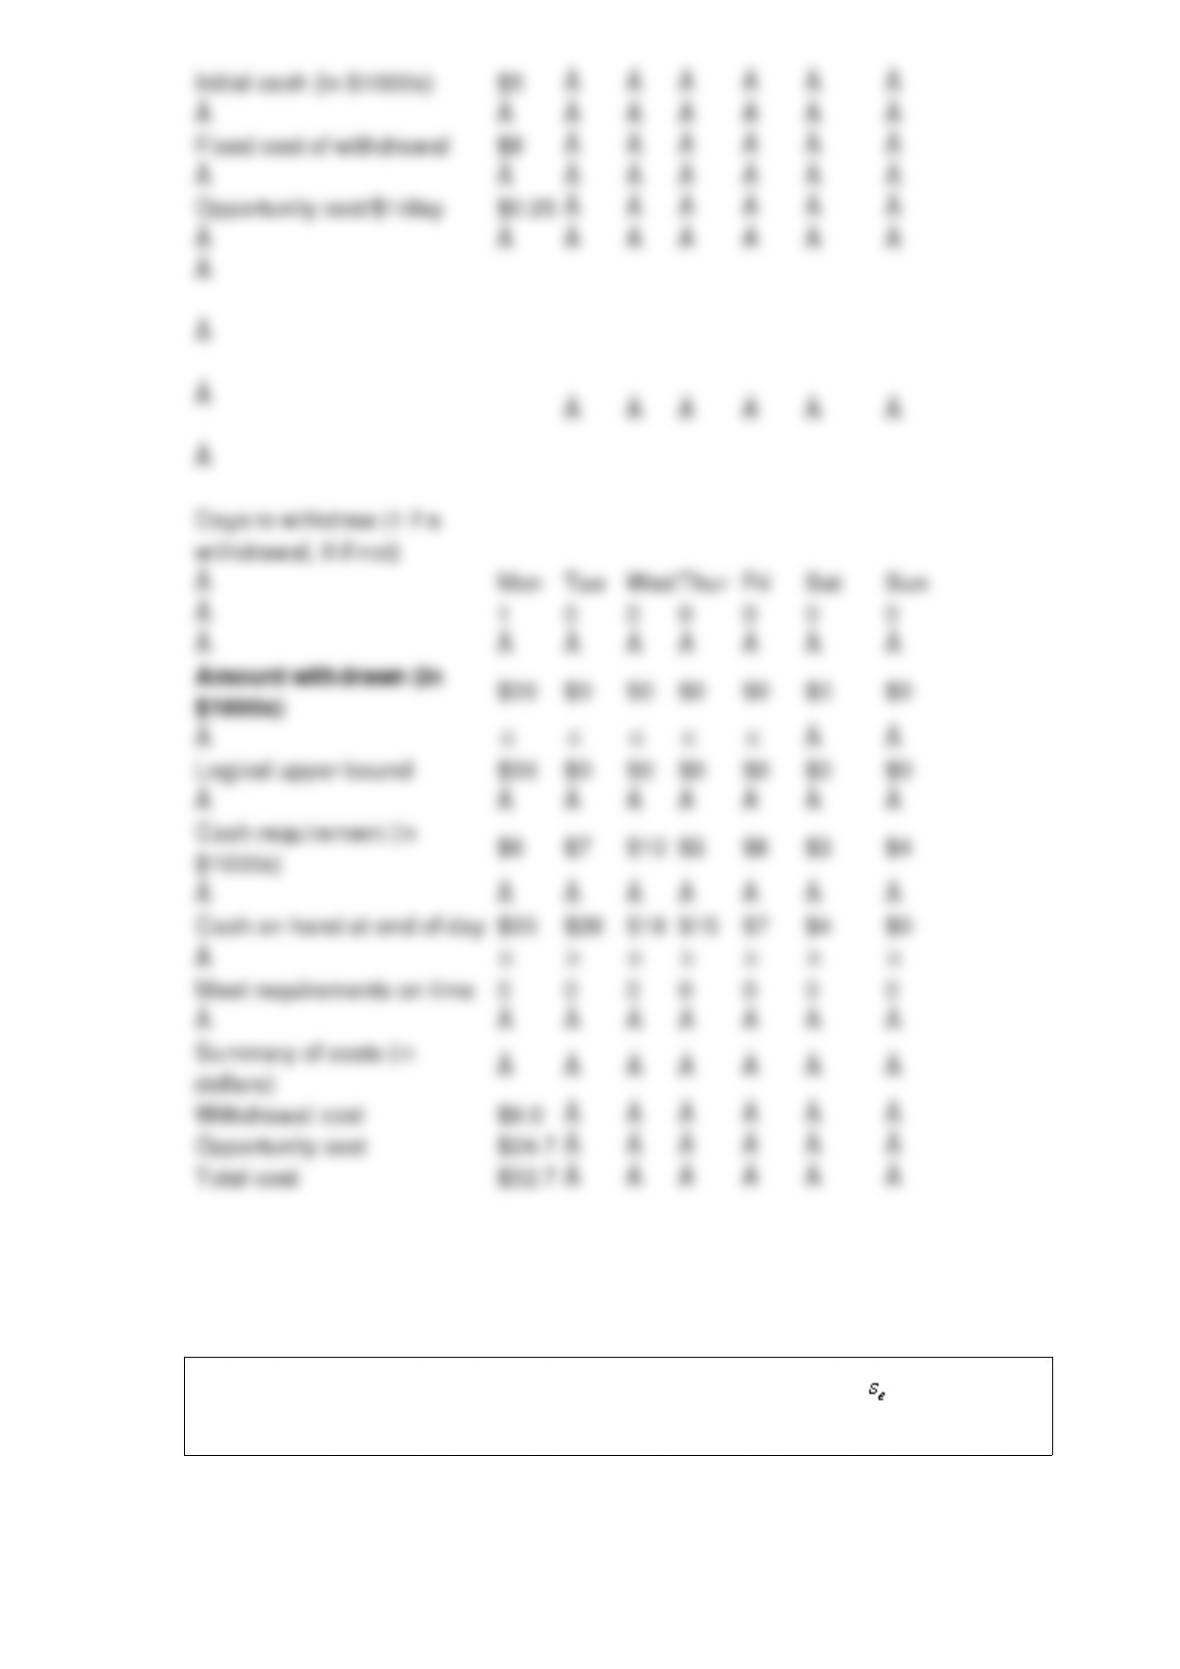
Suppose that on Monday morning you have $5000 in cash on hand. For the following
seven days, the following cash requirements must be met: Monday, $6,000; Tuesday,
$7,000; Wednesday, $10,000; Thursday, $3,000; Friday, $8,000; Saturday, $3,000;
Sunday, $4,000. At the beginning of each day, you must decide how much money (if
any) to withdraw from the bank. It costs $8 to make a withdrawal of any size. You
believe that the opportunity cost of having $1 of cash on hand for a year is $0.25.
Assume that opportunity costs are incurred on each day’s ending balance. Determine
how much money you should withdraw from the bank during each of the next 7 days.
In regression analysis, we can often use the standard error of estimate to judge which
of several potential regression equations is the most useful.

NARRBEGIN: SA_89_91
The following data represent the number of children in a sample of 10 families from
Chicago: 4, 2, 1, 1, 5, 3, 0, 1, 0, and 2.
NARREND
Is the distribution of the number of children symmetrical or skewed? Why?
Of those in the sample who went partying the weekend before the final exam, what
percentage of them did poorly in the exam?
In developing confidence interval for the difference between two population means
using two independent samples, we use the pooled estimate in estimating the
standard error of the sampling distribution of the sample mean difference if the
populations are normal with equal variances.

NARRBEGIN: SA_89_91
The following data represent the number of children in a sample of 10 families from
Chicago: 4, 2, 1, 1, 5, 3, 0, 1, 0, and 2.
NARREND
Compute the median number of children.
A sales manager for a company that makes commercial ovens for restaurants is
interested in estimating the average number of restaurants in all metropolitan areas
across the entire country. He does not have access to the data for each metropolitan
location, so he had decided to select a sample that will be representative of all such
areas, and will use a sample size of 30. Do you believe that simple random sampling is
the best approach to obtaining a representative subset of the metropolitan areas in the
given frame? Explain. If not, recommend how the sales manager might proceed to
select a better sample of size 30 from this data?

What is the probability that no one is waiting or being served in the regular checkout
line?
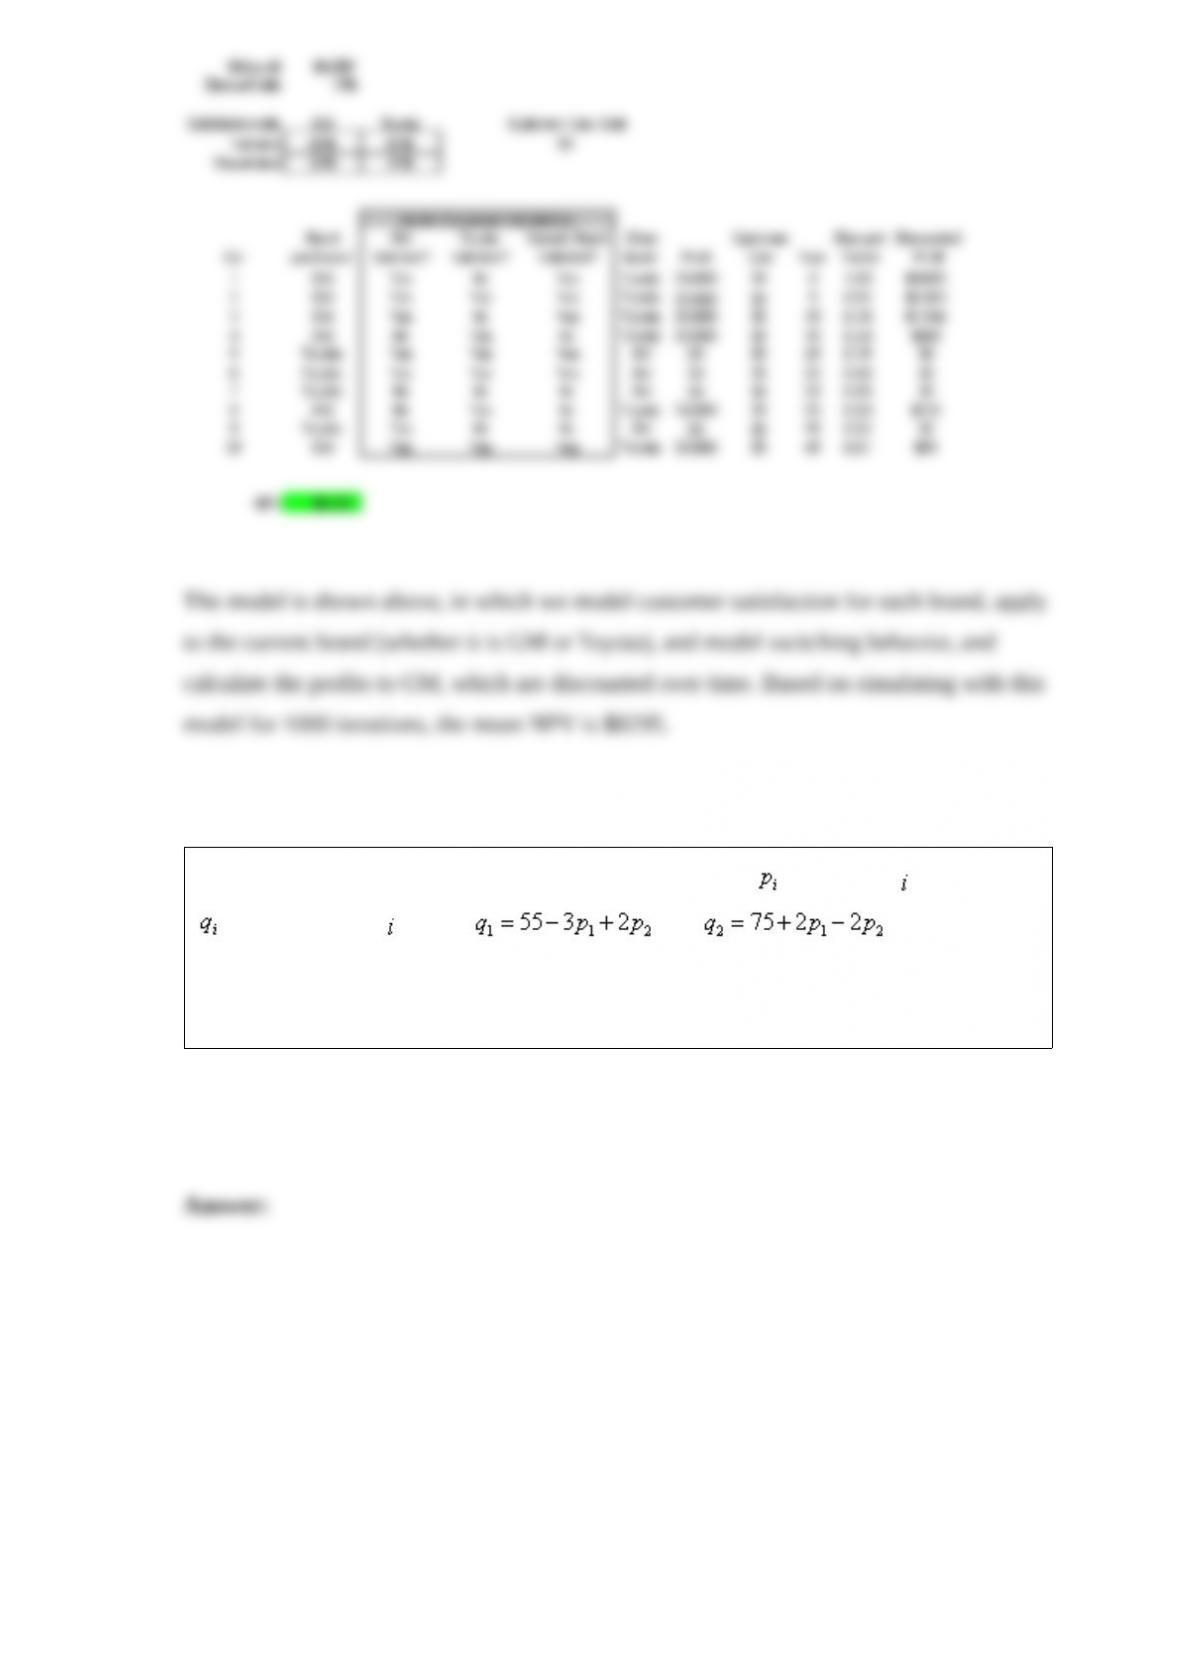
NARRBEGIN: SA_68_73
Suppose that GM earns a $4000 profit each time a person buys a car. We want to
determine how the expected profit earned from a customer depends on the quality of
GM’s cars. The customer is assumed to buy a new car every five years, for a total of 10
cars through her lifetime. The customer will keep buying GM cars so long as they are
satisfied with them. The probability that the customer will be satisfied with her GM car
is 80%. If she is not satisfied with her GM car, she will buy another brand (we”ll call all
other brands cumulatively “Toyota”). The probability that she is satisfied with “Toyota”
is 85%.
NARREND
Consider a customer whose first car is GM. If profits are discounted at 10% annually,
use simulation to estimate the value of this customer to GM over the customer’s
lifetime.
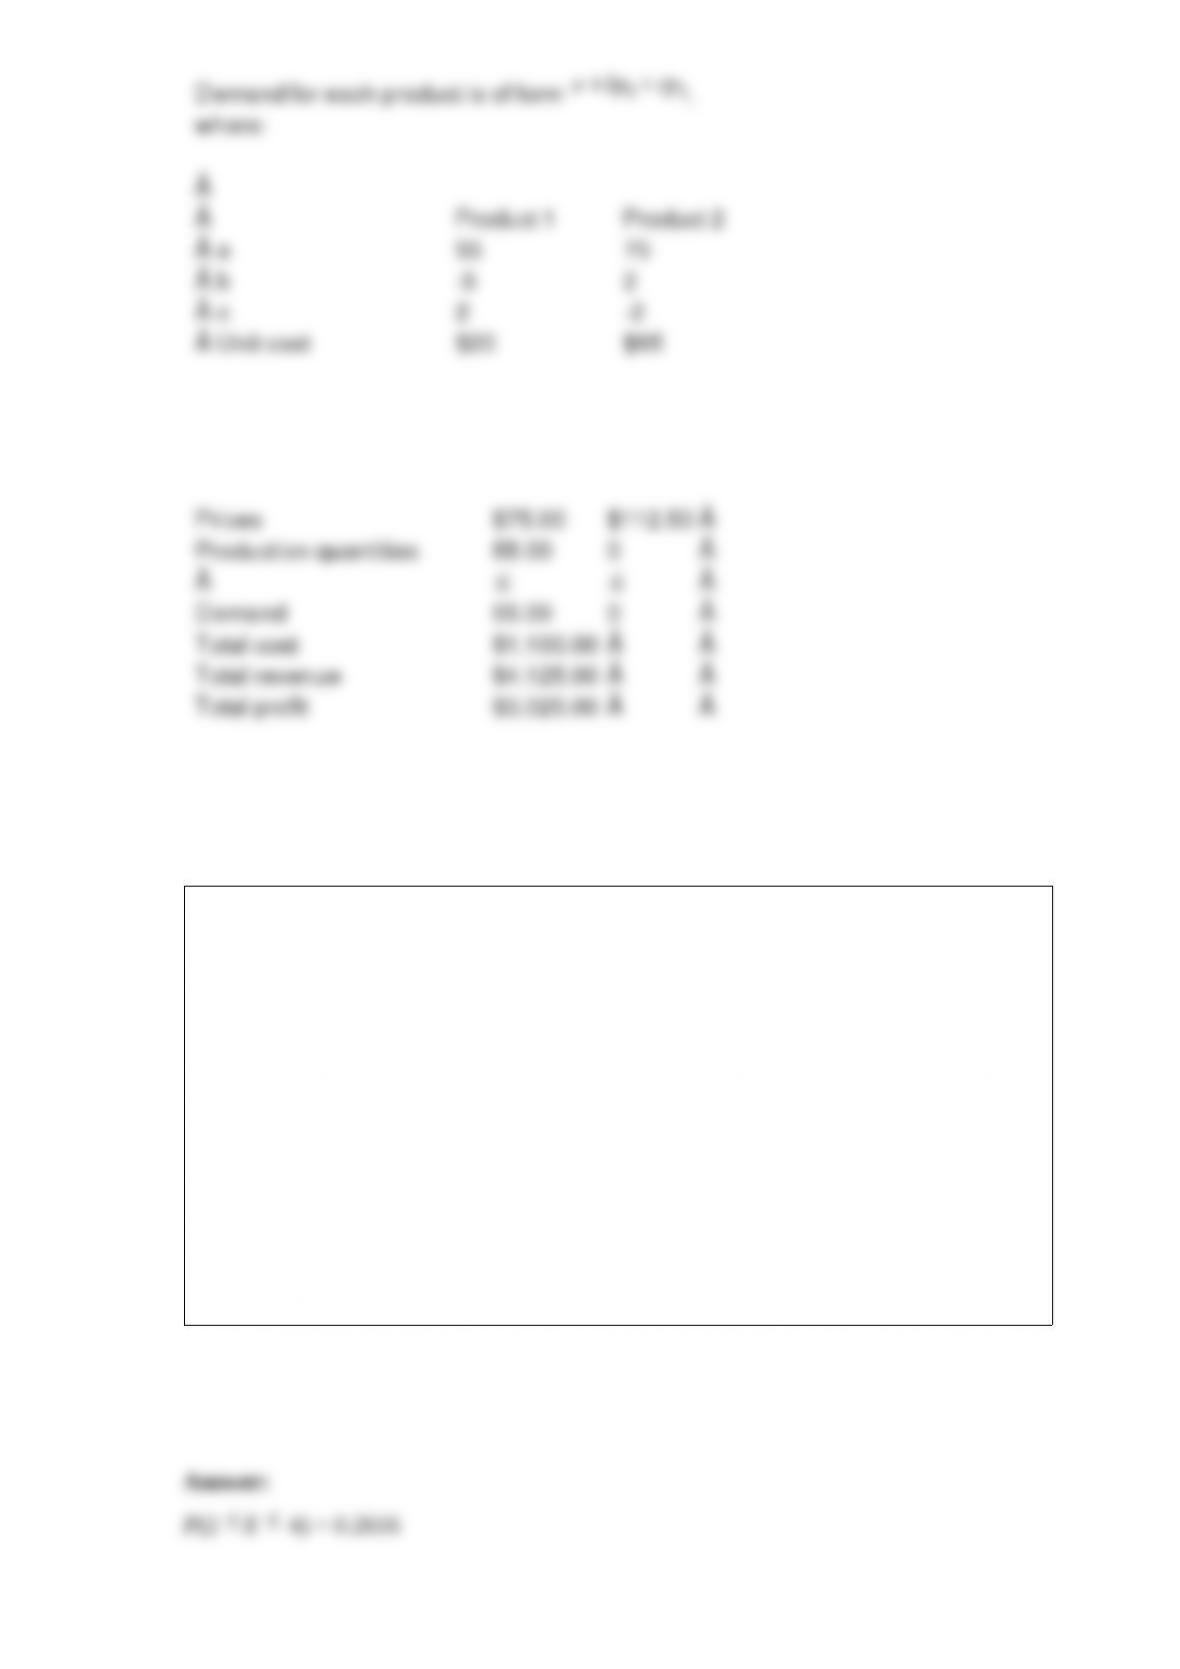
A company manufactures two products. If it charges price for product , it can sell
units of product , where and . It costs the
company $20 to produce a unit of product 1 and $65 to produce a unit of product 2.
How many units of each product should the company produce, and what prices should
it charge, to maximize its profit?
NARRBEGIN: SA_79_90
The service manager for a new appliances store reviewed sales records of the past 20
sales of new microwaves to determine the number of warranty repairs he will be called
on to perform in the next 90 days. Corporate reports indicate that the probability any
one of their new microwaves needs a warranty repair in the first 90 days is 0.05. The
manager assumes that calls for warranty repair are independent of one another and is
interested in predicting the number of warranty repairs he will be called on to perform
in the next 90 days for this batch of 20 new microwaves sold.
NARREND
What is the probability that between two and four (inclusive) of the 20 new microwaves
sold will require a warranty repair in the first 90 days?

Holt’s method is an exponential smoothing method, which is appropriate for a series
with seasonality and possibly a trend.
Unboundedness refers to the situation in which the LP model has been formulated in
such a way that the objective function is unbounded ” that is, it can be made as large
(for maximization problems) or as small (for minimization problems) as we like.
Approximate the percentage of these internet users who are women.
The averaging effect says that as you average more and more observations from a given
distribution, the variance of the average increases.

NARRBEGIN: SA_112_114
The number of arrivals at a local gas station between 3:00 and 5:00 P.M. has a Poisson
distribution with a mean of 12.
NARREND
Find the probability that the number of arrivals between 3:30 and 4:00 P.M. is at least
10.