If two random samples of sizes 30 and 35 are selected independently from two
populations whose means are 85 and 90, then the mean of the sampling distribution of
the sample mean difference, , equals 5.
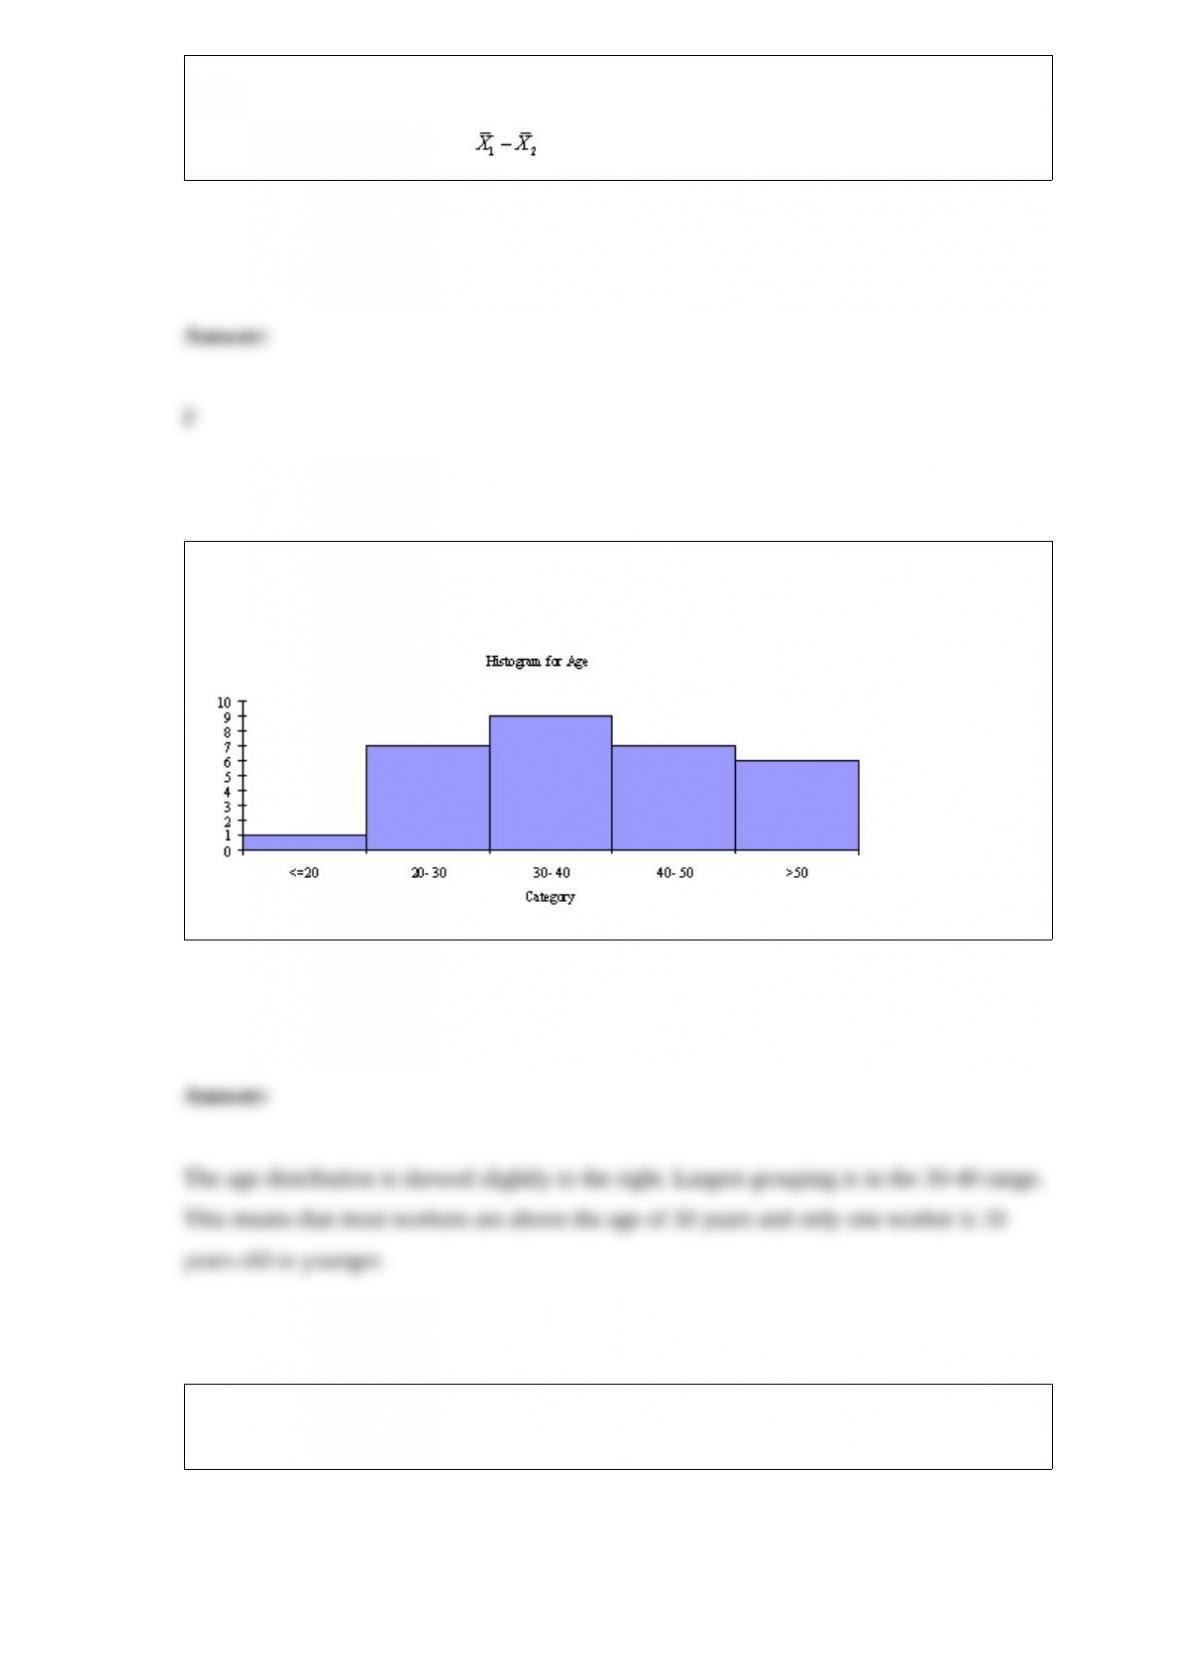
Based on the histogram shown below, how would you describe the age distribution for
these data?
In financial simulation models, we are typically more interested in the expected NPV of
a project than in the extremes of the outcomes.
NARRBEGIN: SA_78_79
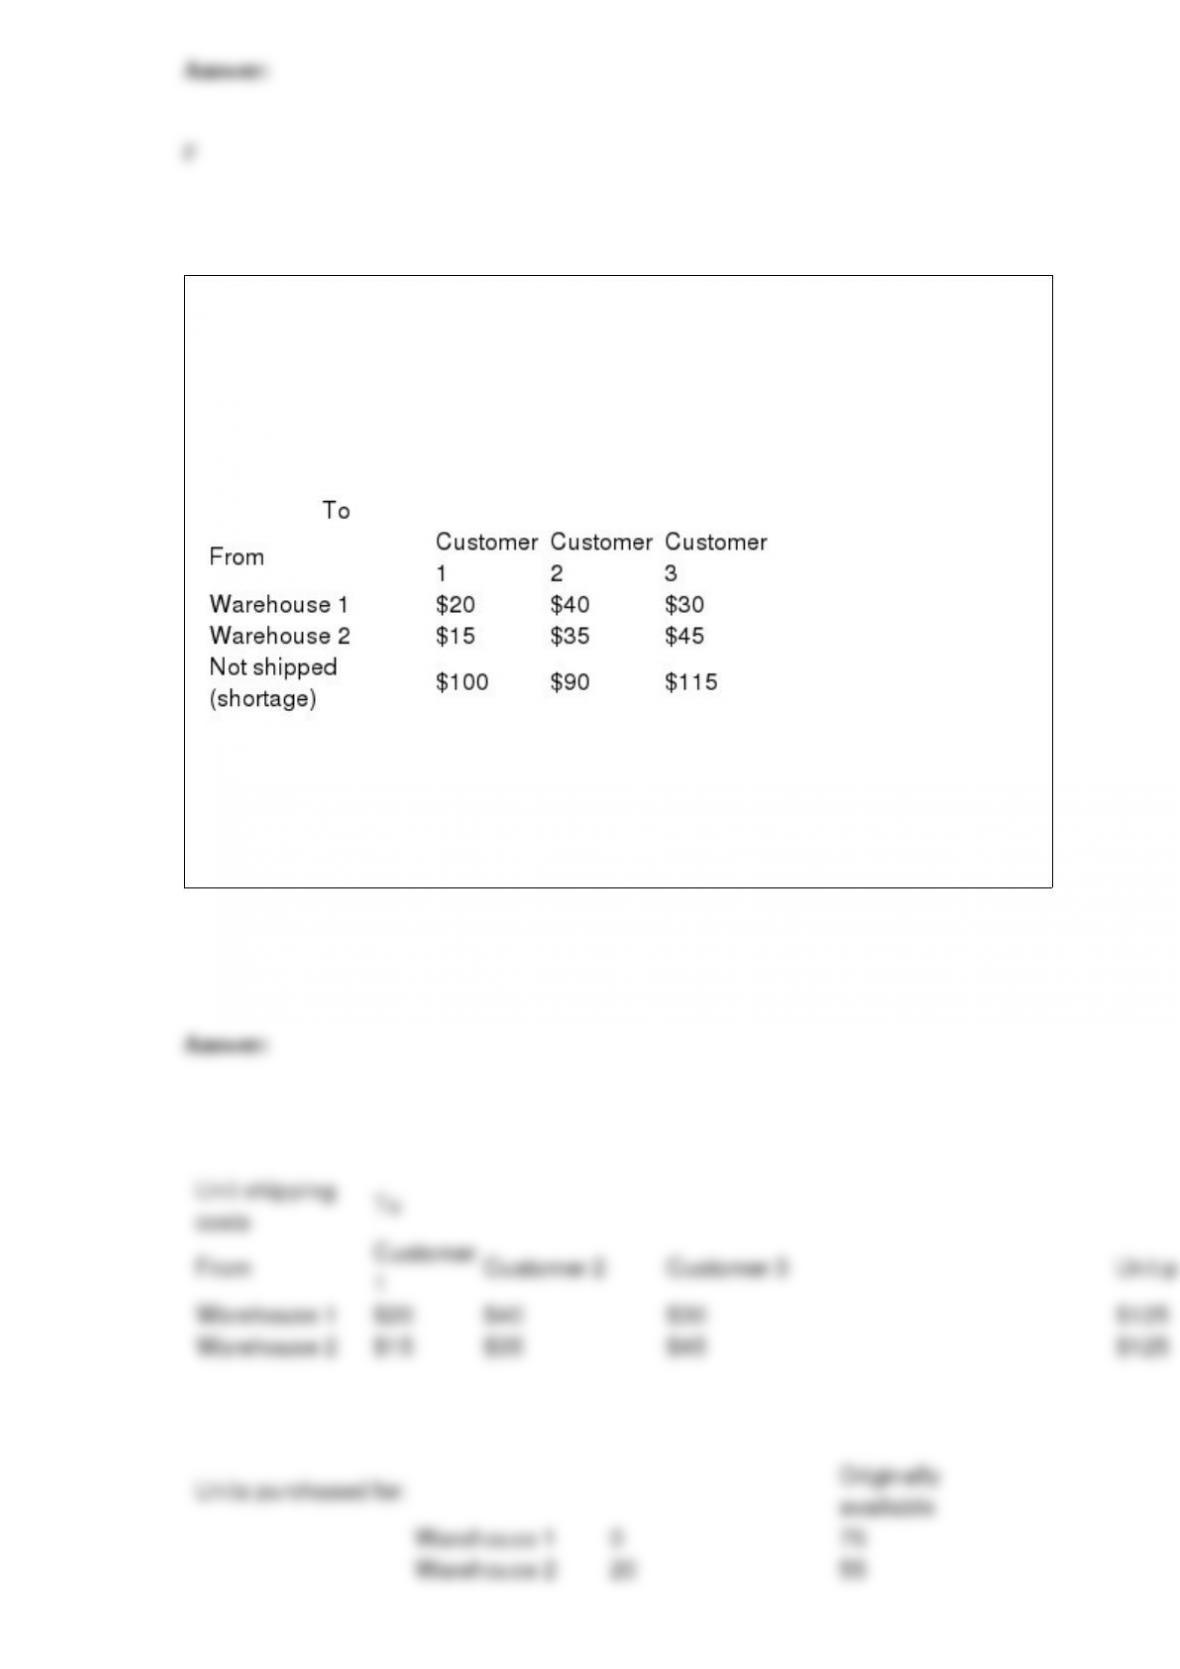
A company supplies goods to three customers, each of whom requires 50 units. The
company has two warehouses. In warehouse 1, 75 units are available, and in warehouse
2, 55 units are available. The costs of shipping one unit from each warehouse to each
customer are shown in the table below.
NARREND
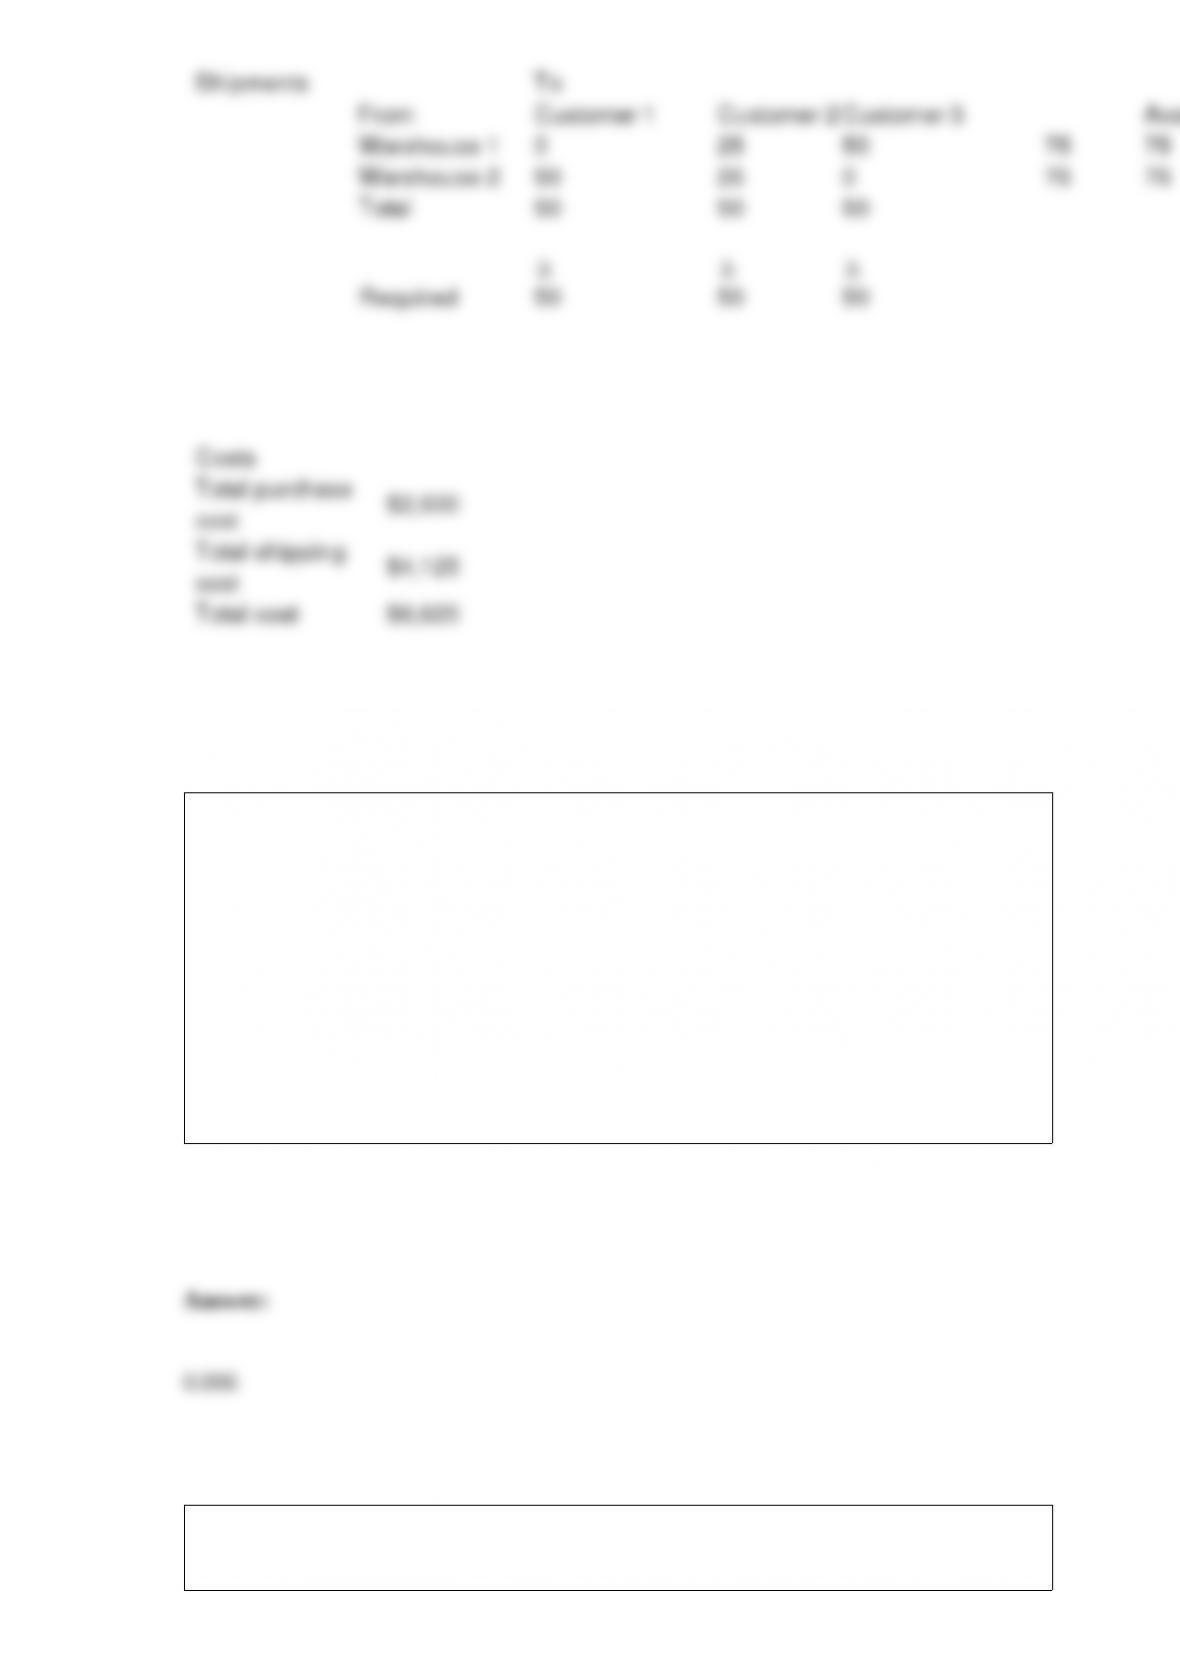
Suppose that the company can purchase and ship extra units to either warehouse for a
total cost of $125 per unit and that all customer demand must be met. Determine how to
minimize the sum of purchasing and shipping costs.
NARRBEGIN: SA_95_100
A recent survey in Michigan revealed that 60% of the vehicles traveling on highways,
where speed limits are posted at 70 miles per hour, were exceeding the limit. Suppose
you randomly record the speeds of ten vehicles traveling on US 131 where the speed
limit is 70 miles per hour. Let X denote the number of vehicles that were exceeding the
limit.
NARREND
Find P(X = 10).
You are told that a random sample of 150 people from Iowa has been given cholesterol
tests, and 60 of these people had levels over the “safe” count of 200. Construct a 95%
confidence interval for the population proportion of people in Iowa with cholesterol
levels over 200.
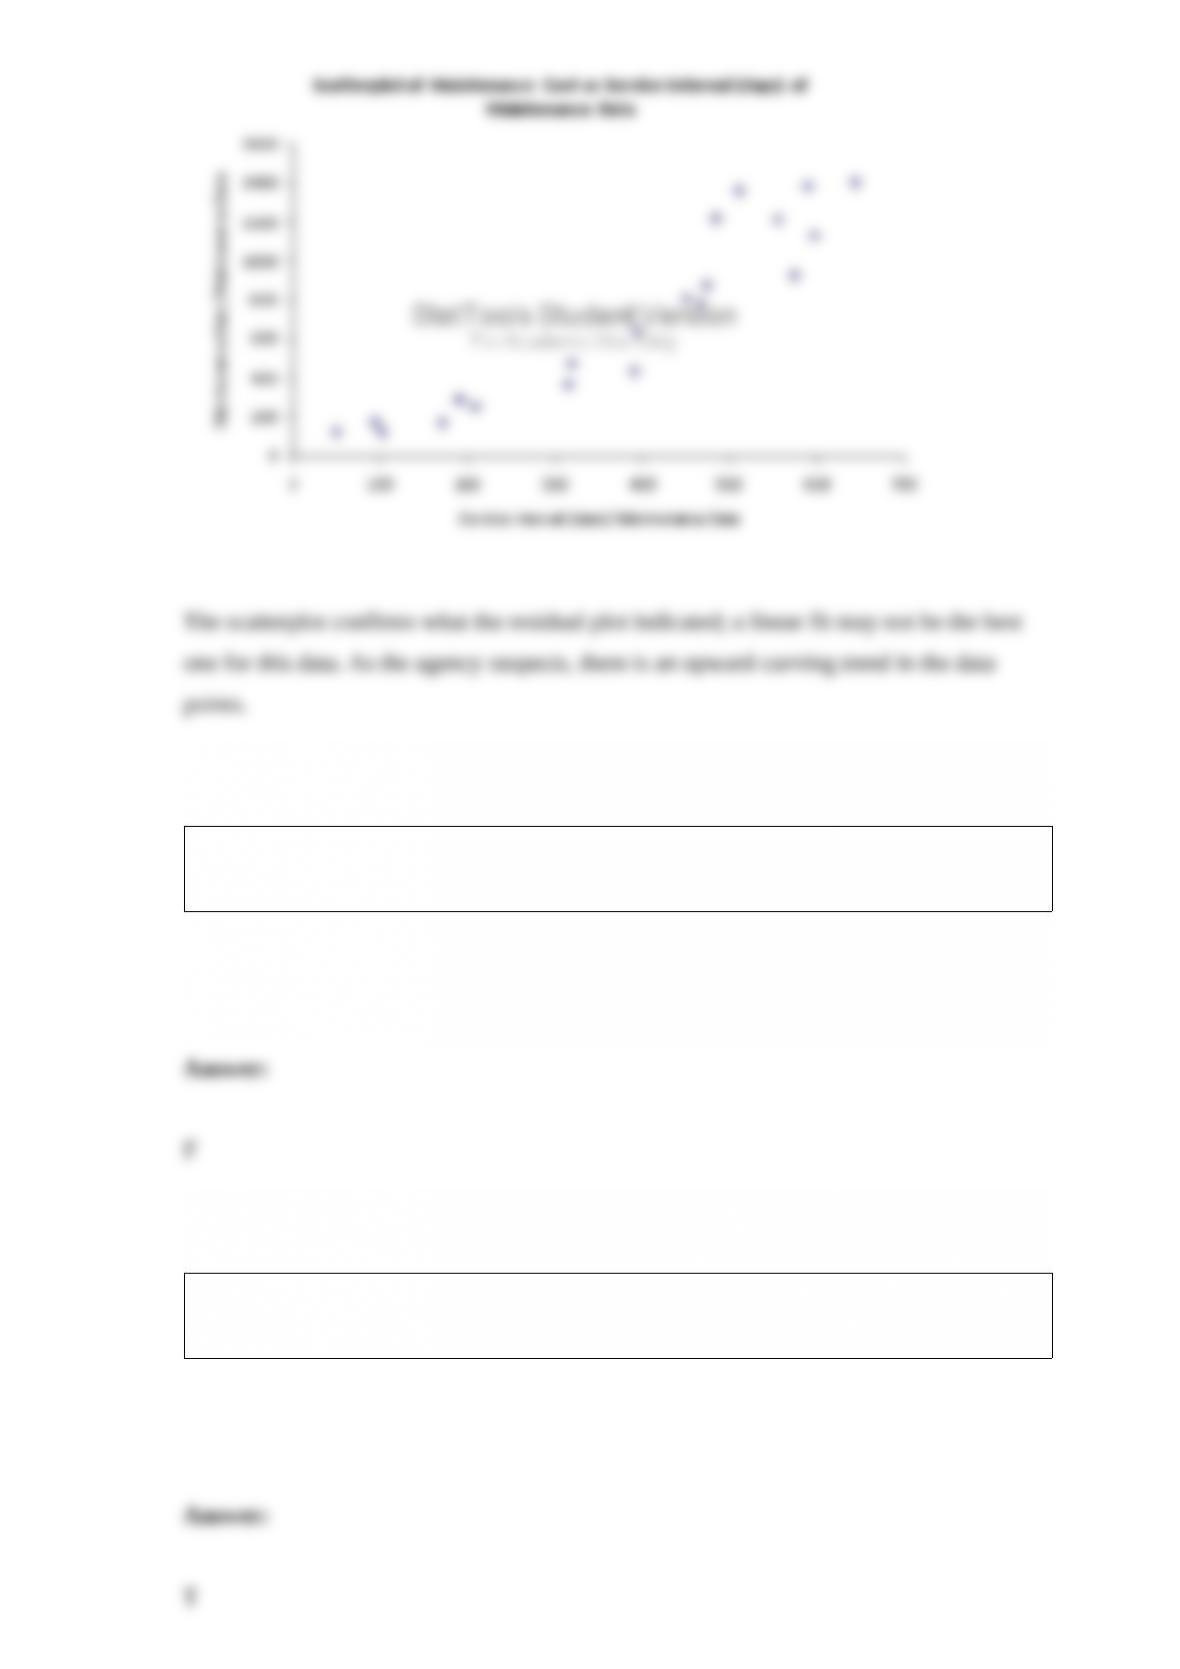
Obtain a scatterplot of Maintenance Cost vs. Service Interval. Does this affect your
opinion of the validity of the model in Question 135?
The Excel RAND() function generates random numbers from a Normal(0,1)
distribution.
The temperature of the room in which you are writing this test is a continuous random
variable.
NARRBEGIN: SA_64_65
The height of a typical American male adult is normally distributed with a mean of 68
inches and a standard deviation of 5 inches. We observe the heights of 12 American
male adults.
NARREND
What is the probability that exactly half the male adults will be less than 62 inches tall?
The percentage of variation explained is the square of the correlation between the
observed Y values and the fitted Y values.
NARRBEGIN: SA_83_85
A department store in a small town is in the process of budget planning and will be
building a decision tree to select the best option among its available marketing
channels. To estimate the probabilities it will need, it considers a customer base of 1500
individuals, 700 of which are women. Data shows that 240 of the women in this
population earn at least $50,000 per year and 300 of the men earn at least $50,000 per

year.
NARREND
If a randomly selected individual is observed to earn at least $50,000 per year, what is
the probability that this person is a man?
The number of loan defaults per month at a bank is Poisson distributed.
Logistics problems are problems of finding the least expensive way to transport
products from their origin to their destination.
A shortcoming of the RMSE (root mean square error) is that it is not in the same units
as the forecast variable.
NARRBEGIN: SA_74_77
The “winner’s curse” refers to a situation where there are several bidders on the same
item. Each participant can make his or her independent estimate for the value of the
item. When all participants are equally informed their estimates will be unbiased, but,
given the difficulty of estimating the value, the estimates may vary widely. Even though
the mean of the estimates may equal the expected value, the winner’s bid will likely be
more than the value of the item. Consider a case where 3 companies are trying to decide
how much to bid for a commercial real estate tract. Assume that each bidder
independently estimates the value of the tract. This estimated value is a random variable
that for each bidder is drawn from a normal distribution with a mean of $1,000,000 and
a standard deviation of $200,000. The actual value is also drawn from the same
distribution.
NARREND
Suppose first that all three bidders are aware of the winner’s curse so they have decided
(independently) to bid 10% below their estimated values. Using 1000 iterations report
the expected profit (or loss) to the winner.
NARRBEGIN: SA_61_65
A manufacturing facility needs to open a new assembly line in four months or there will
be significant cost overruns. The manager of this project believes that there are four
possible values for the random variable X (the number of months from now it will take
to complete this project): 3, 3.5, 4, and 4.5. It is currently believed that the probabilities
of these four possibilities are in the ratio 1 to 2 to 3 to 2. That is, X = 3.5 is twice as
likely as X = 3 and X = 4 is 1.5 times as likely as X = 3.5.
NARREND
What is the probability that this project will not be completed on time?