
In order to construct a confidence interval estimate of the population mean , the value
of must be given.
In developing a confidence interval for the population standard deviation , we make
use of the fact that the sampling distribution of the sample standard deviation s is not
the normal distribution or the t-distribution, but rather a right-skewed distribution called
the chi-square distribution, which (for this procedure) has n ” 1 degrees of freedom.
The divisibility property of LP models simply means that we allow only integer levels
of the activities.
NARRBEGIN: SA_68_73
Suppose that GM earns a $4000 profit each time a person buys a car. We want to
determine how the expected profit earned from a customer depends on the quality of

GM’s cars. The customer is assumed to buy a new car every five years, for a total of 10
cars through her lifetime. The customer will keep buying GM cars so long as they are
satisfied with them. The probability that the customer will be satisfied with her GM car
is 80%. If she is not satisfied with her GM car, she will buy another brand (we”ll call all
other brands cumulatively “Toyota”). The probability that she is satisfied with “Toyota”
is 85%.
NARREND
Does the answer to Question 72 match your intuition? Explain why or why not.
There are four quartiles that divide the values in a data set into four equal parts.
Data tables in spreadsheet simulations are useful for taking a “prototype” simulation
and replicating its key results a desired number of times.
NARRBEGIN: SA_104_112
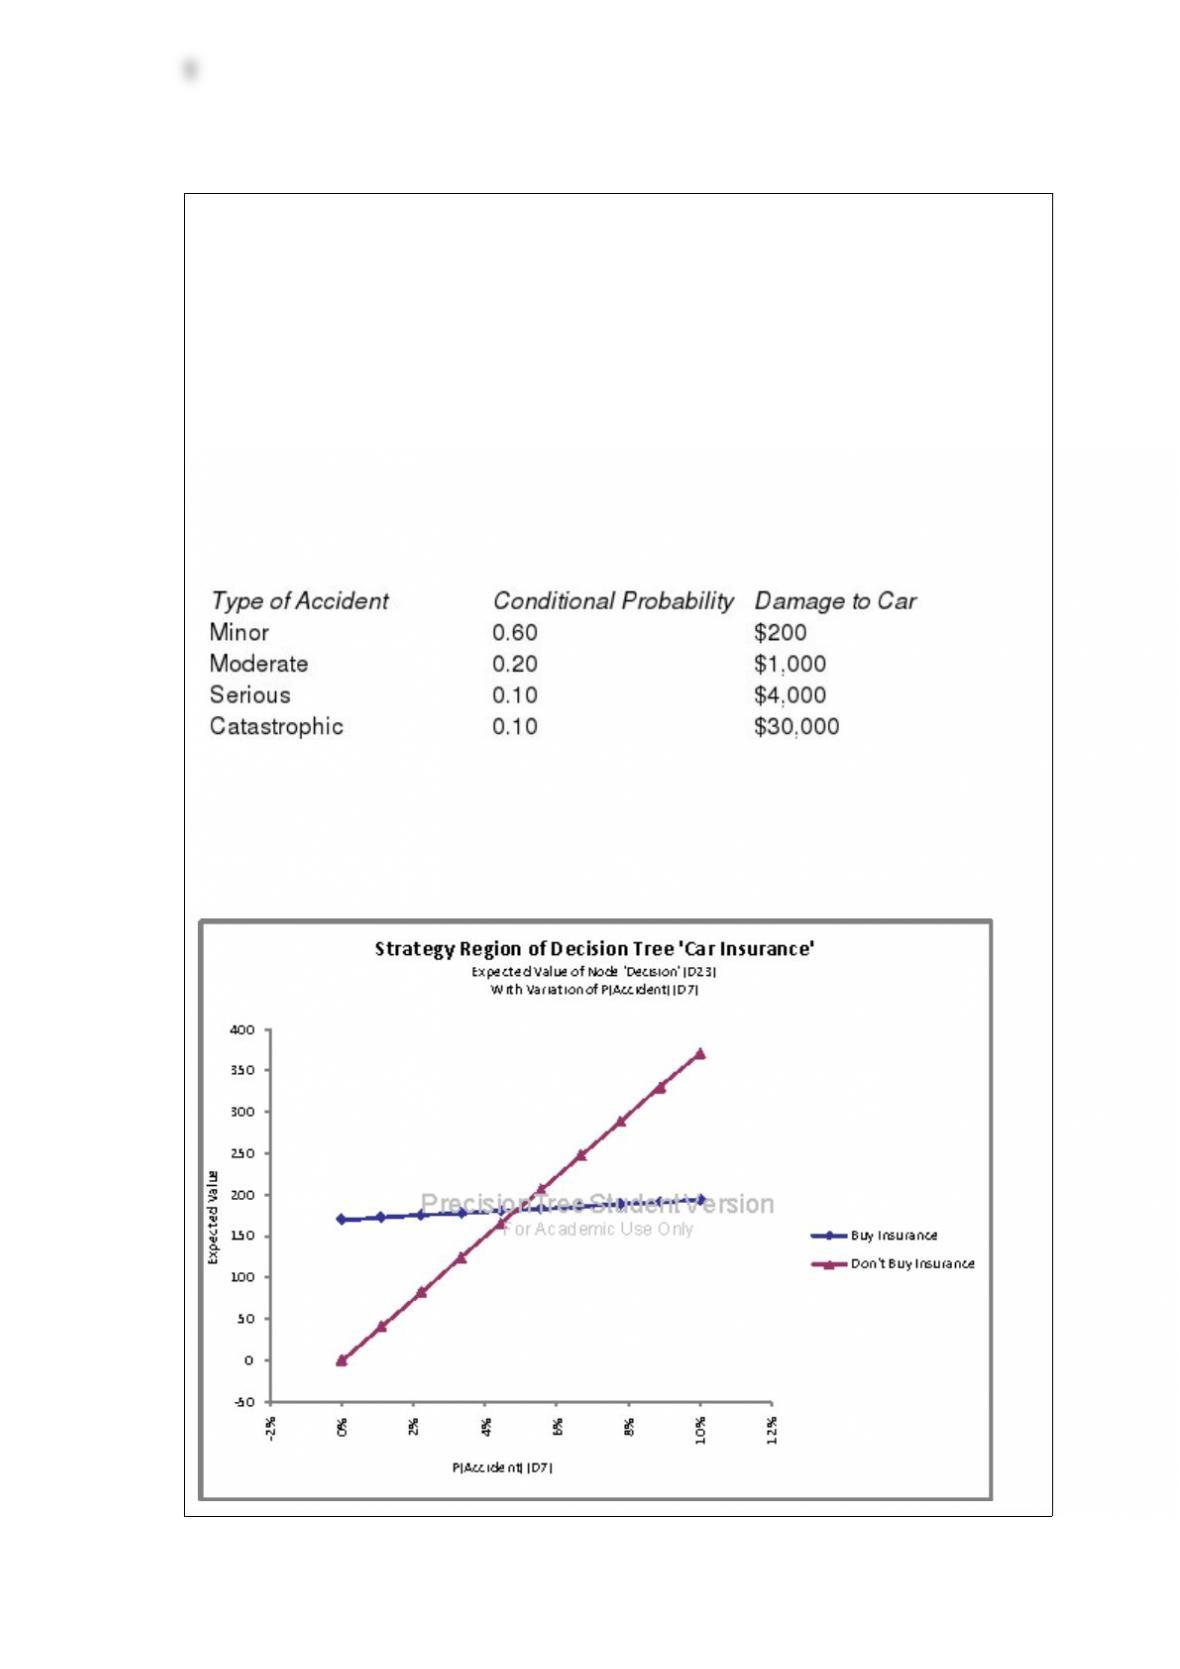
Mrs. Rich has just bought a new $30,000 car. As a reasonably safe driver, she believes
that there is only a 5% chance of being in an accident in the forthcoming year. If she is
involved in an accident, the damage to her new car depends on the severity of the
accident. The probability distribution for the range of possible accidents and the
corresponding damage amounts (in dollars) are shown in the table below. Mrs. Rich is
trying to decide whether she is willing to pay $170 each year for collision insurance
with a $300 deductible. Note that with this type of insurance, she pays the first $300 in
damages if she causes an accident, and the insurance company pays the remainder.
Distribution of Accident Types and Corresponding Damage Amounts
NARREND
What impact, if any, does the probability of being in an accident have on her decision?
Briefly explain your answer

The number of cars produced by GM during a given quarter is a continuous random
variable.
For each possible decision and each possible outcome, the payoff table lists the
monetary value earned by an organization, where a positive value represents a profit
and a negative value represents a loss.
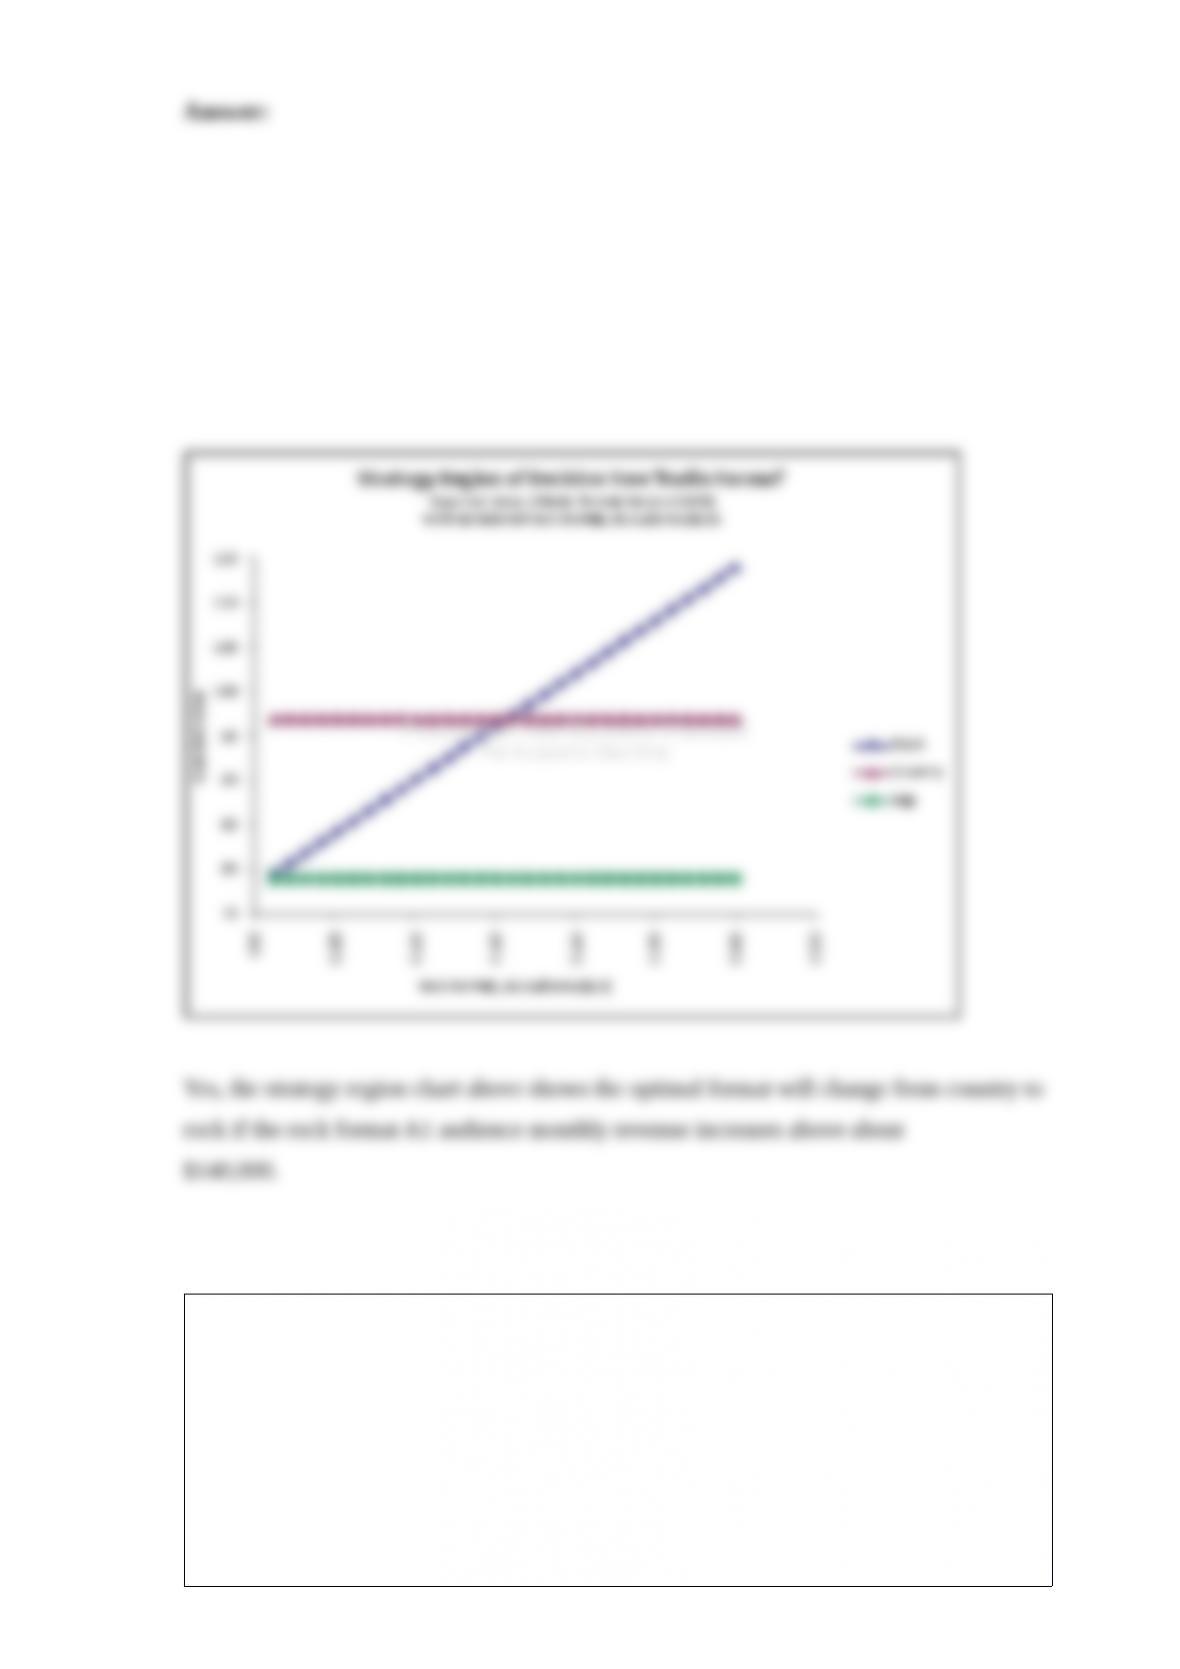
The station is most uncertain about the average monthly revenue associated with the
rock format and an A1 audience. Construct a strategy region chart for this input variable
with a possible range from $85,000 to $200,000. Does the optimal decision to select the
country format change at any point in this range?
NARRBEGIN: SA_68_73
Suppose that GM earns a $4000 profit each time a person buys a car. We want to
determine how the expected profit earned from a customer depends on the quality of
GM’s cars. The customer is assumed to buy a new car every five years, for a total of 10
cars through her lifetime. The customer will keep buying GM cars so long as they are
satisfied with them. The probability that the customer will be satisfied with her GM car
is 80%. If she is not satisfied with her GM car, she will buy another brand (we”ll call all
other brands cumulatively “Toyota”). The probability that she is satisfied with “Toyota”
is 85%.
NARREND
Suppose GM could raise it customer satisfaction to 85%, to match Toyota’s. What
would the customer NPV be in that case?
NARRBEGIN: SA_51_53
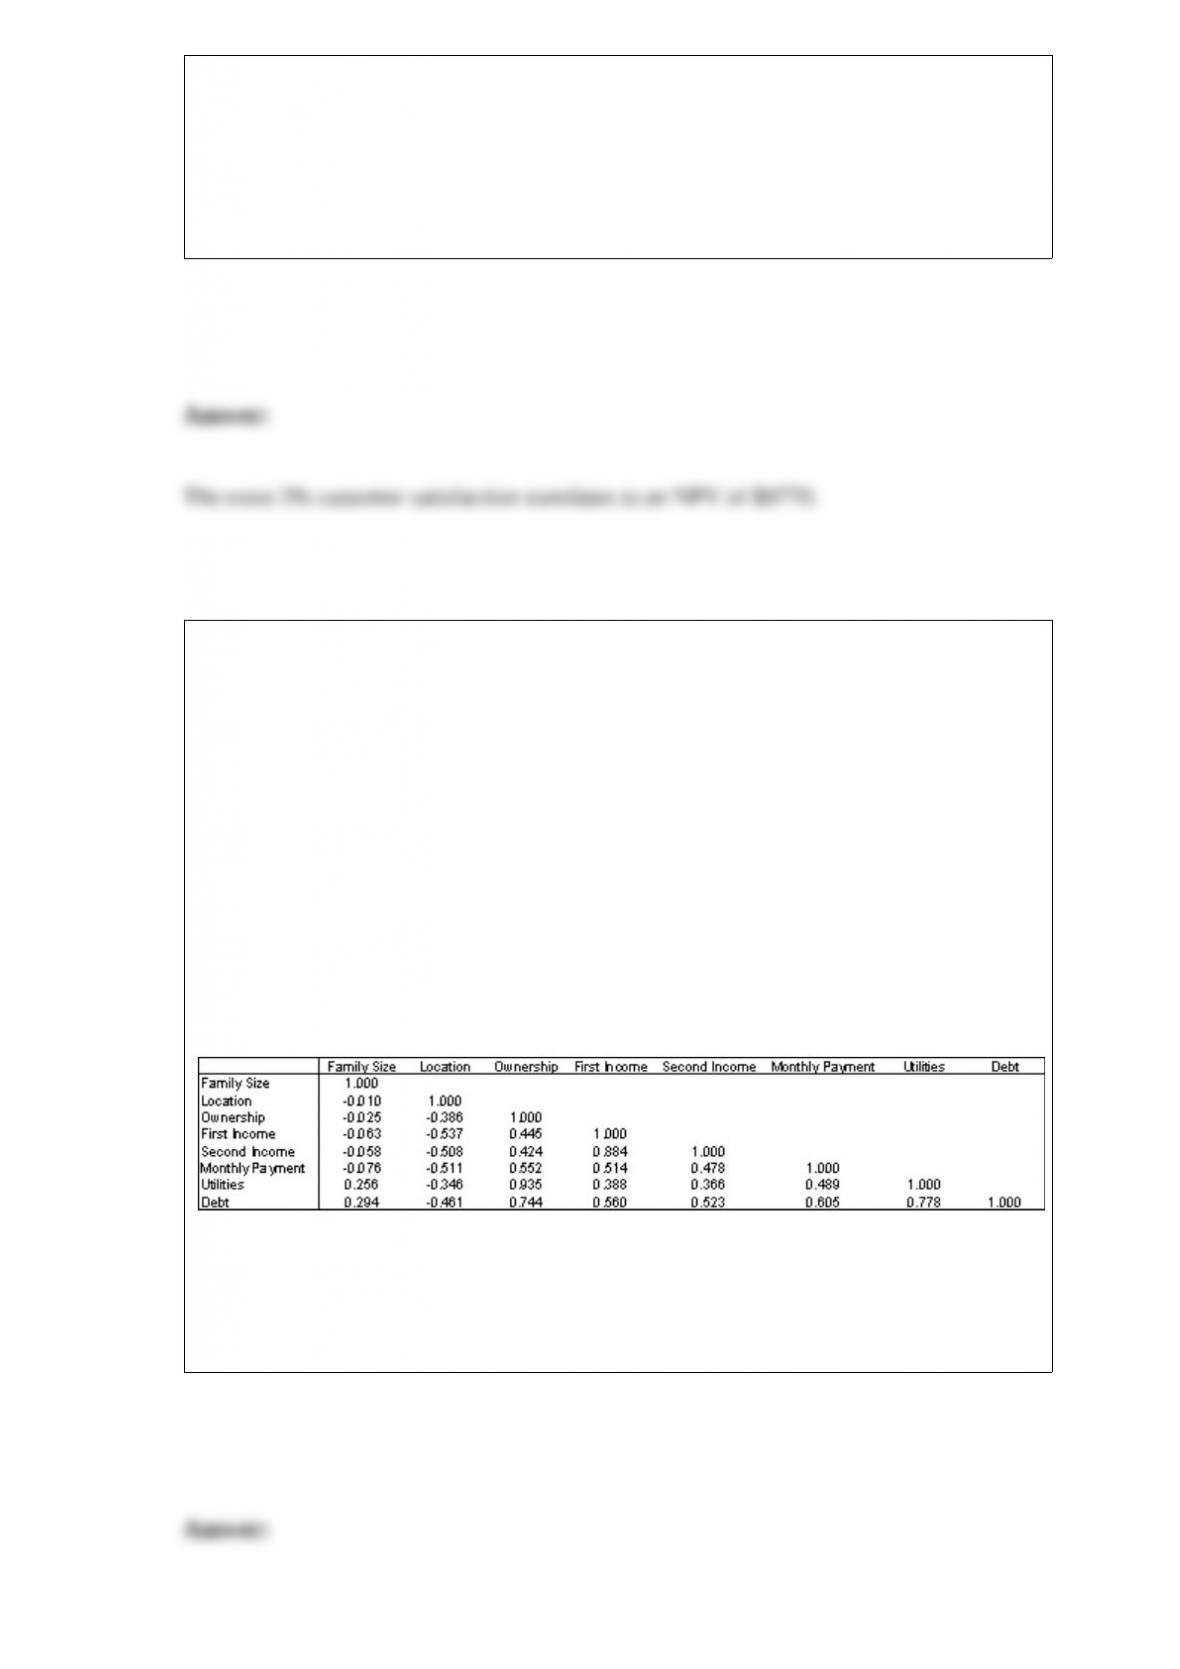
An economic development researcher wants to understand the relationship between the
average monthly expenditure on utilities for households in a particular middle-class
neighborhood and each of the following household variables: family size, approximate
location of the household within the neighborhood, and indication of whether those
surveyed owned or rented their home, gross annual income of the first household wage
earner, gross annual income of the second household wage earner (if applicable), size of
the monthly home mortgage or rent payment, and the total indebtedness (excluding the
value of a home mortgage) of the household.
The correlation for each pairing of variables are shown in the table below:
Table of correlations
NARREND
Which of the variables have a positive linear relationship with the household’s average
monthly expenditure on utilities?
A regression analysis between weight (Y in pounds) and height (X in inches) resulted in
the following least squares line: = 140 + 5X. This implies that if the height is
increased by 1 inch, the weight is expected to increase on average by 5 pounds.
NARRBEGIN: SA_78_79
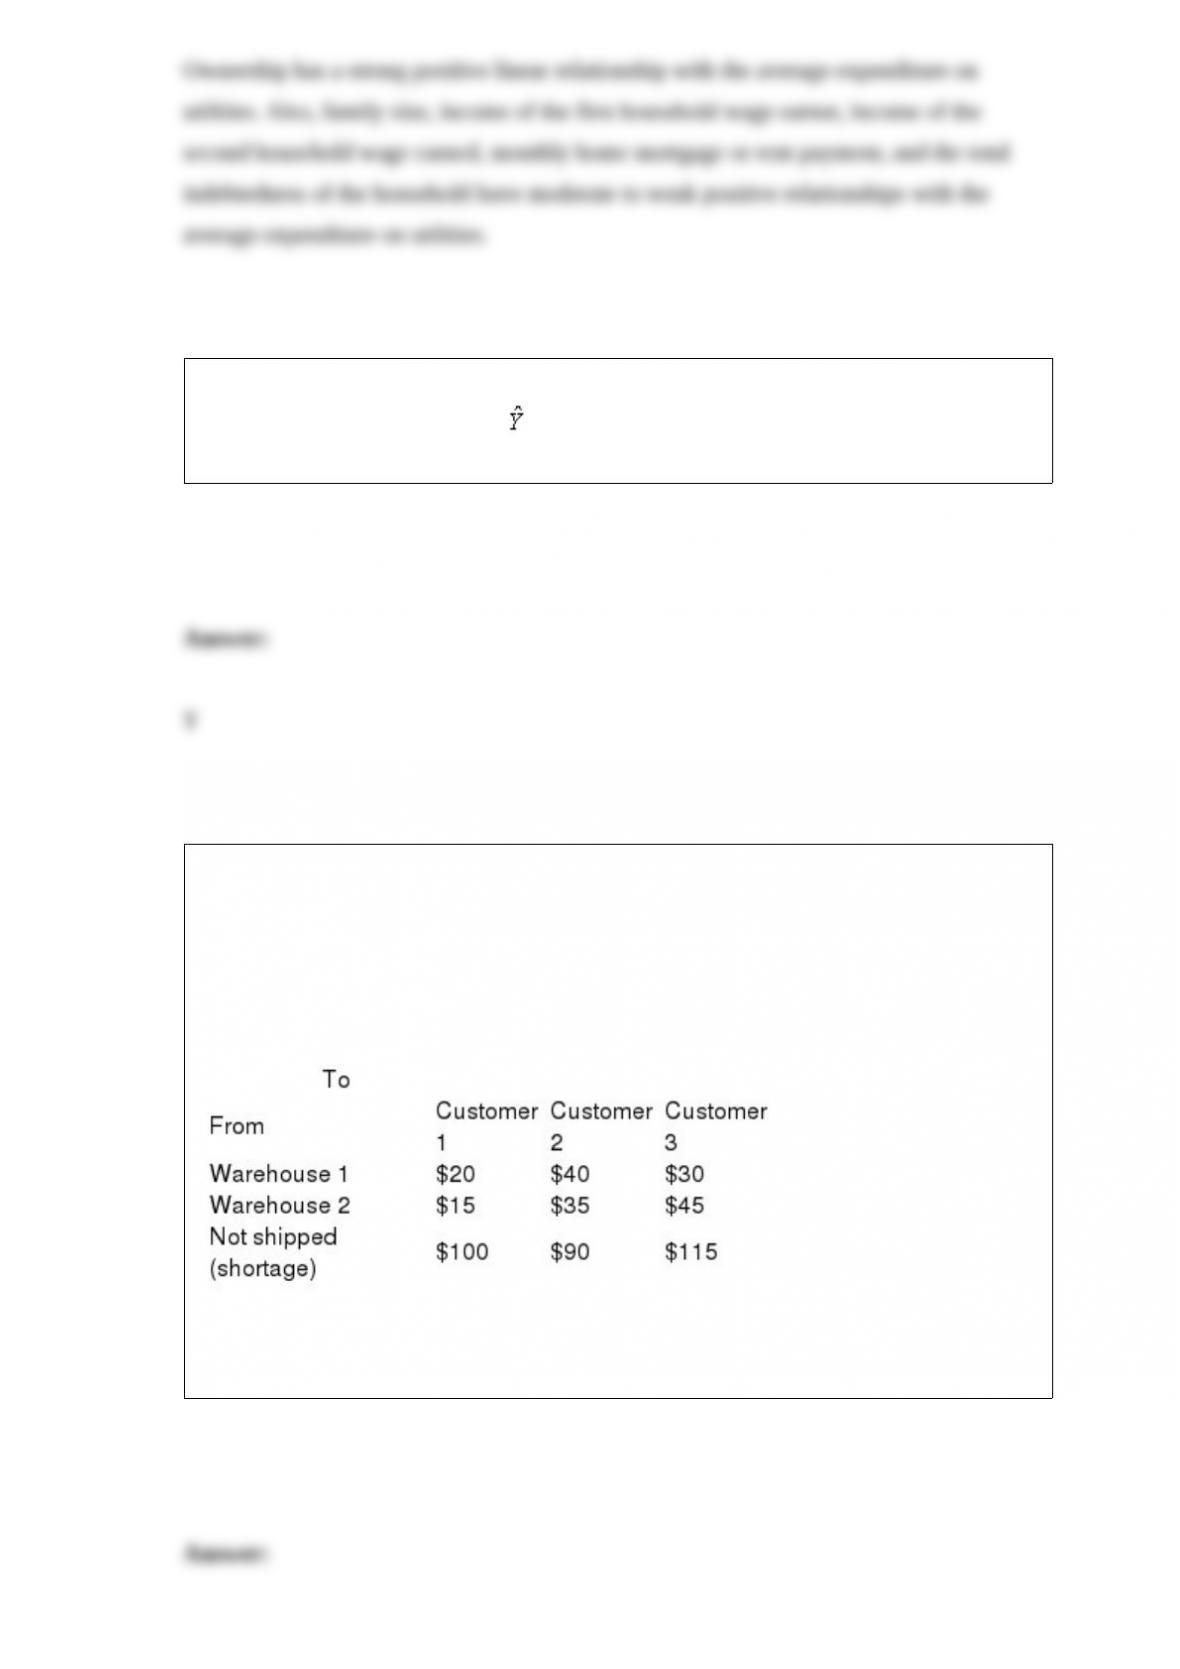
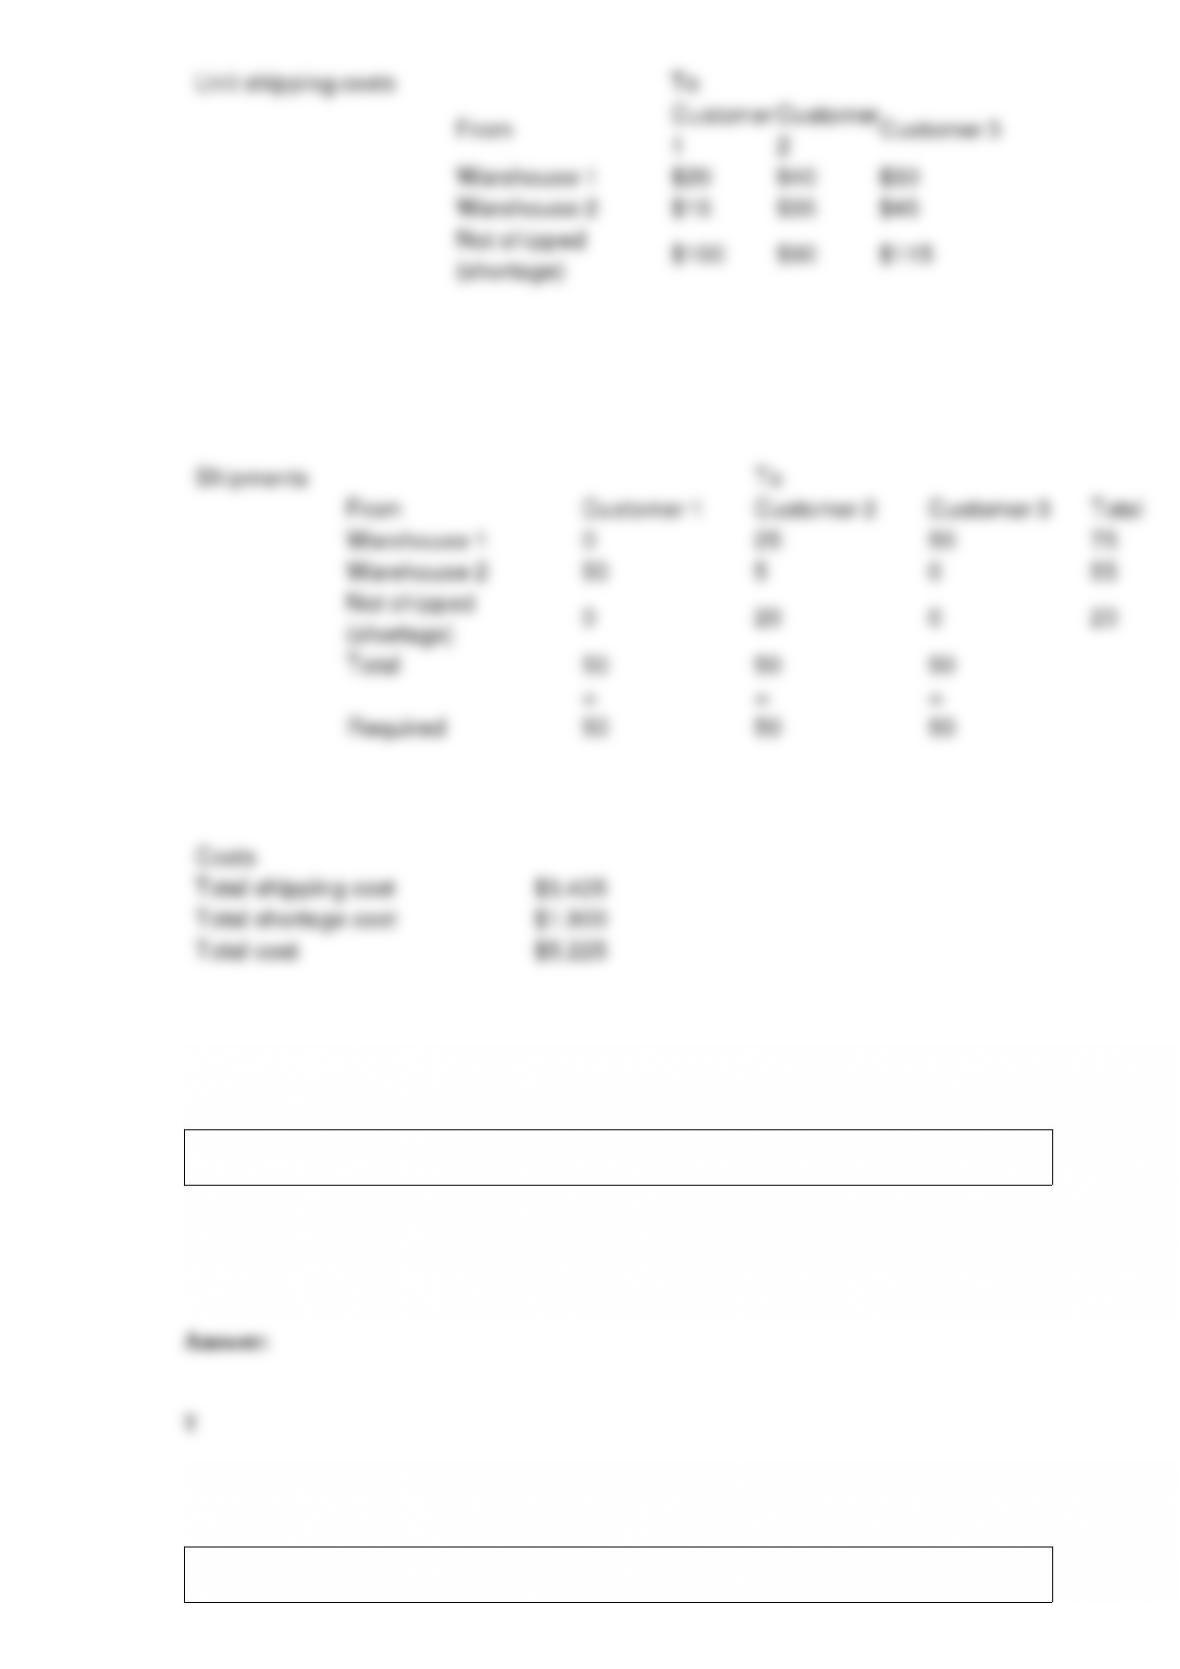
A company supplies goods to three customers, each of whom requires 50 units. The
company has two warehouses. In warehouse 1, 75 units are available, and in warehouse
2, 55 units are available. The costs of shipping one unit from each warehouse to each
customer are shown in the table below.
NARREND
Determine how to minimize the sum of shortage and shipping costs.
The length of the box in the boxplot portrays the interquartile range.
If all the supplies and demands for a transportation model are integers, then the optimal
Solver solution may or may not have integer-valued shipments.
NARRBEGIN: SA_79_83
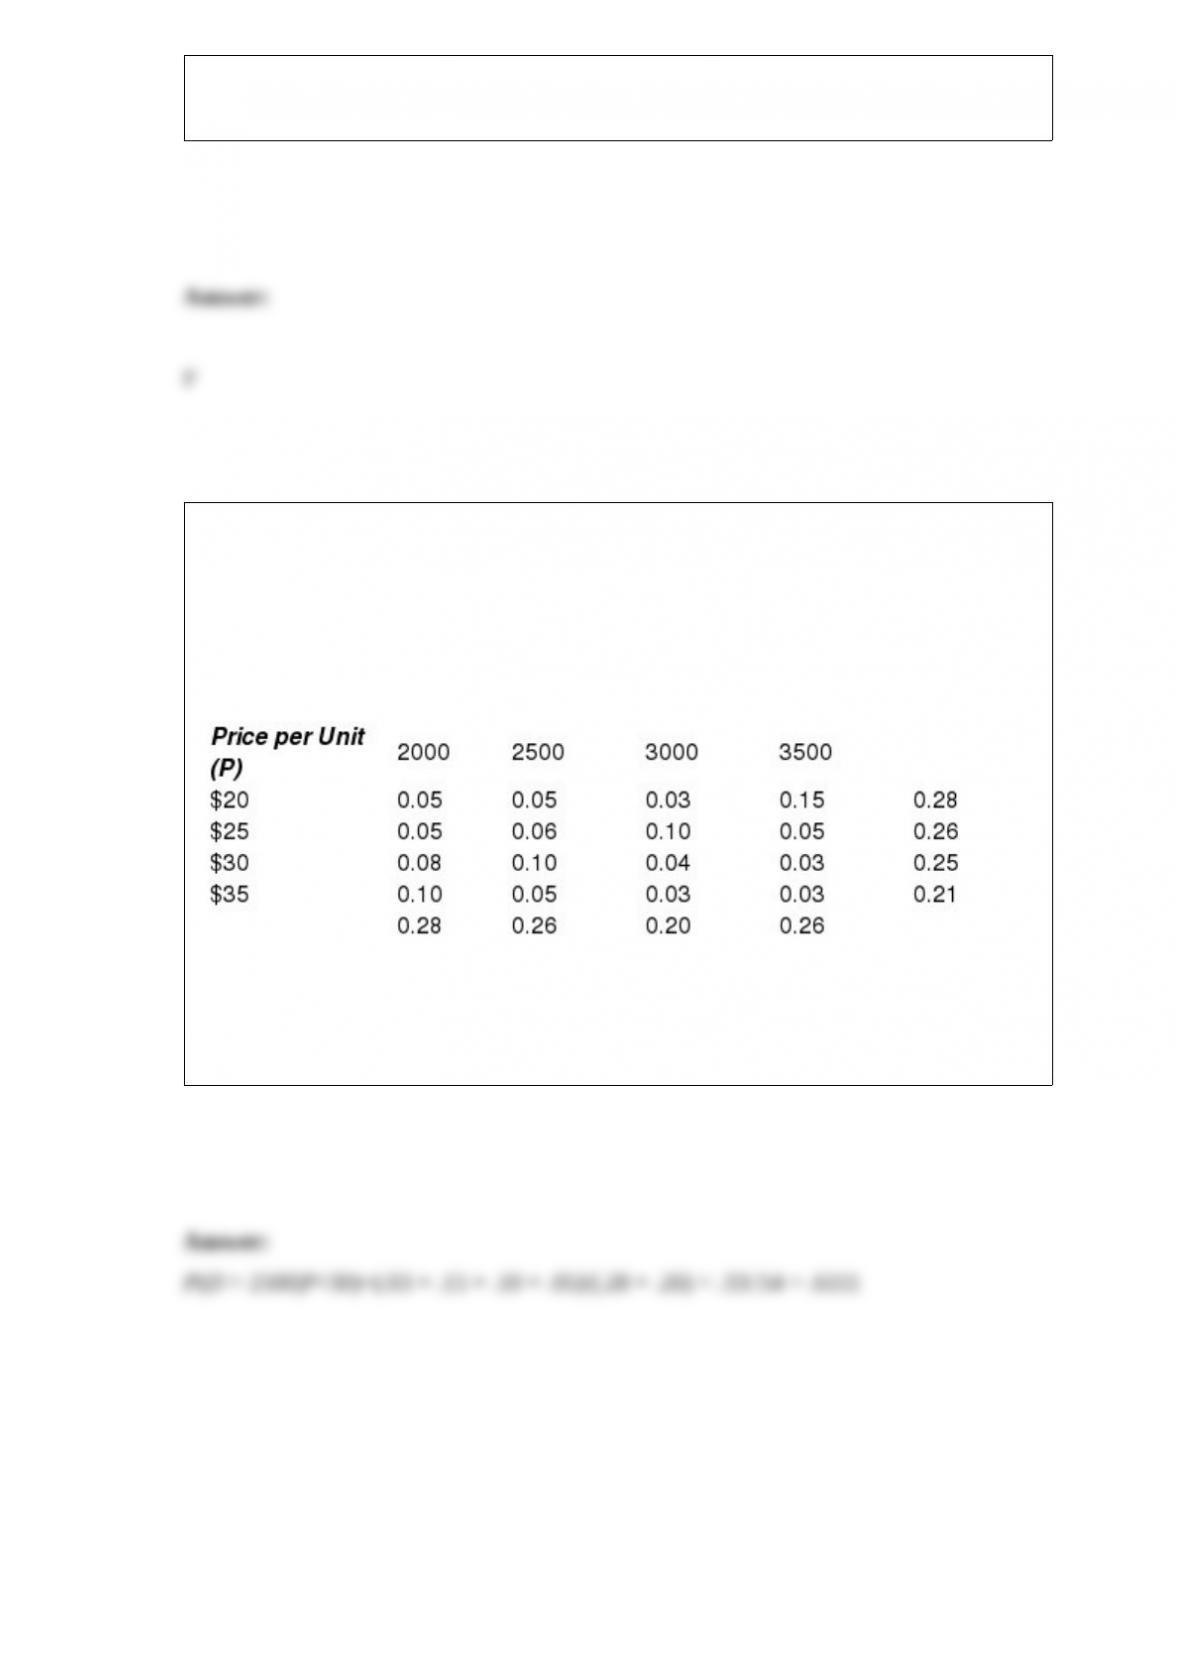
Suppose that the manufacturer of a particular product assesses the joint distribution of
the price per unit (P) and demand (D) for its product in the upcoming quarter as
presented below. Use this information to answer the following questions.
Demand (D)
NARREND
What is the probability that the demand of this product exceed 2500 units in the
upcoming quarter, given that its price will be less than $30?