
NARRBEGIN: SA_79_90
The service manager for a new appliances store reviewed sales records of the past 20
sales of new microwaves to determine the number of warranty repairs he will be called
on to perform in the next 90 days. Corporate reports indicate that the probability any
one of their new microwaves needs a warranty repair in the first 90 days is 0.05. The
manager assumes that calls for warranty repair are independent of one another and is
interested in predicting the number of warranty repairs he will be called on to perform
in the next 90 days for this batch of 20 new microwaves sold.
NARREND
What is the probability that only one of the 20 new microwaves sold will require a
warranty repair in the first 90 days?
In a bidding model, once we have the bidding strategy that maximizes the expected
profit, we no longer should consider the bidders risk aversion.
Simulation applications involving games of chance are primarily for learning the
background of simulation (e.g., modeling gambling casinos of Monte Carlo), since they
are not business applications per se.

The p-value of a test is the probability of observing a test statistic at least as extreme as
the one computed given that the null hypothesis is true.
When the scatterplot appears as a shapeless swarm of points, this can indicate that there
is no relationship between the response variable Y and the explanatory variable X, or at
least none worth pursuing.
A probability distribution is bounded if there are values A and B such that only one
possible value can be less than A or greater than B.

The sampling distribution of the mean will have the same standard deviation as the
original population from which the samples were drawn.
Bayes’ rule can be used for updating the probability of an uncertain outcome after
observing the results of a test or study.
Correlation is measured on a scale from 0 to 1, where 0 indicates no linear relationship
between two variables, and 1 indicates a perfect linear relationship.
In a positively skewed distribution, the mean is smaller than the median and the median
is smaller than the mode.
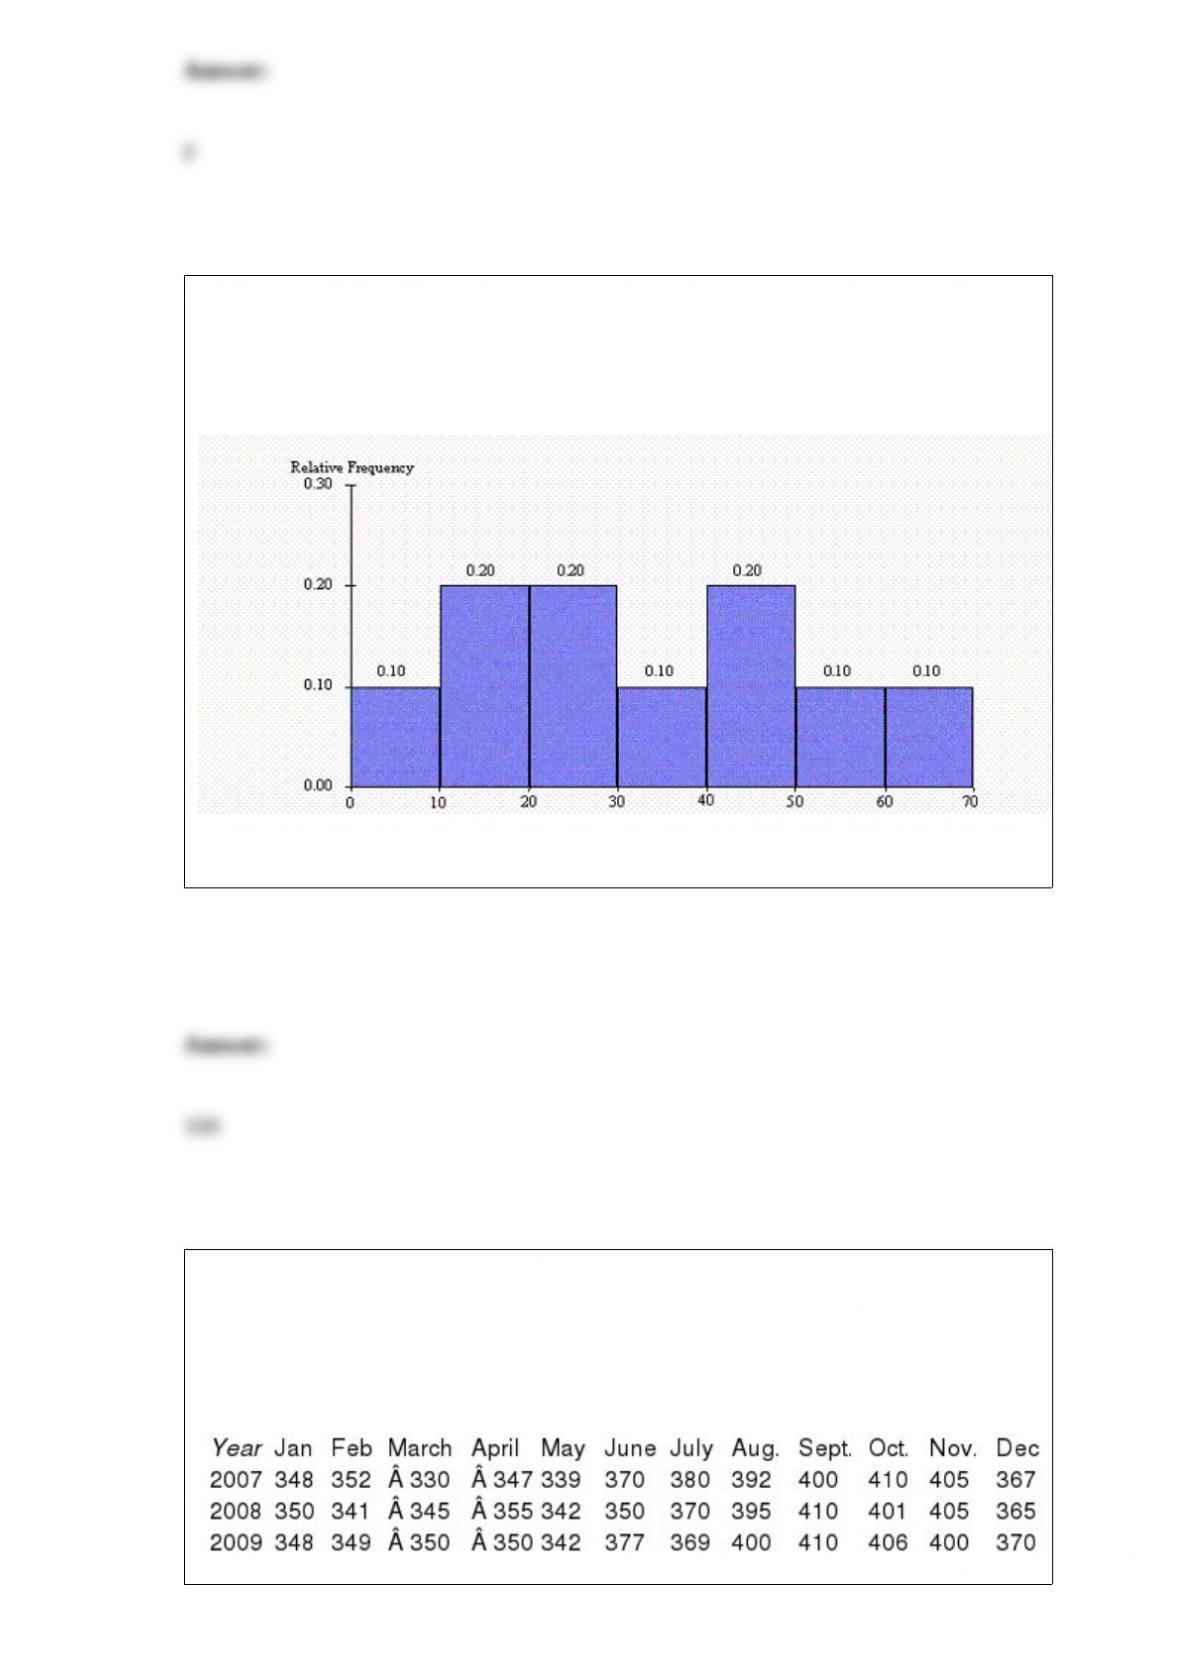
NARRBEGIN: SA_98_103
The histogram below represents scores achieved by 250 job applicants on a personality
profile.
NARREND How many job applicants scored between 10 and 30?
NARRBEGIN: SA_89_91
The number of employees on the payroll at a computer software company is recorded at
the start of each month from January 2007 to December 2009. These data are shown
below.

NARREND
Perform a runs test and compute a few autocorrelations to determine whether this time
series is random.
Linear programming problems can always be formulated algebraically, but not always
on spreadsheet.

Spreadsheet simulation modeling is quite similar to the other modeling applications in
that it begins with input variables and then relates these with appropriate Excel
formulas to produce output variables of interest.
A useful graph in almost any regression analysis is a scatterplot of residuals (on the
vertical axis) versus fitted values (on the horizontal axis), where a “good” fit not only
has small residuals, but it has residuals scattered randomly around zero with no
apparent pattern.
In simple linear regression, if the error variable is normally distributed, the test
statistic for testing is t-distributed with n ” 2 degrees of freedom.
We compare the percent of variation explained R2 for a regression model with seasonal
dummy variables to the MAPE for the smoothing model with seasonality to see which

model is more accurate.