
A sample in which the sampling units are chosen from the population by means of a
random mechanism is a
a. probability sample
b. judgmental sample
c. stratified sample
d. systematic sample
Which of the following are true statements of pivot tables?
a. They allow us to “slice and dice” data in a variety of ways.
b. Statisticians often refer to them as contingency tables or crosstabs.
c. Pivot tables can list counts, averages, sums, and other summary measures, whereas
contingency tables list only counts.
d. All of these options
The normal distribution is:
a. a discrete distribution with two parameters
b. a binomial distribution with only one parameter

c. a density function of a discrete random variable
d. a continuous distribution with two parameters
If two events are mutually exclusive and collectively exhaustive, what is the probability
that both occur?
a. 0.00
b. 0.50
c. 1.00
d. Cannot be determined from the information given.
Which of the following is nota required input for a typical transportation problem?
a. Capacities (or supplies)
b. Demands
c. Unit shipping (and possibly production) costs
d. Distance from origins to destinations

In decision trees, probabilities are listed on probability branches. These probabilities
may be _____ events that have already been observed.
a. marginal due to
b. conditional on
c. averaged with
d. increased by
e. the same as
Assume that x is a random number between 0 and 1, and that the number of units
expected to be sold is uniformly distributed between 300 and 500. Then, sales are given
by the expression
a. 300 + x
b. 500 ” x
c. 300 + 200 x
d. 500 ” 200 x
e. 300 + 500 x
The regression line has been fitted to the data points (28, 60), (20, 50),
(10, 18), and (25, 55). The sum of the squared residuals will be:
a. 20.25
b. 16.00
c. 49.00
d. 94.25
NARRBEGIN: SA_71_74
A carpet company, which sells and installs carpet, believes that there should be a
relationship between the number of carpet installations that they will have to perform in
a given month and the number of building permits that have been issued within the
county where they are located. Below you will find a regression model that compares
the relationship between the number of monthly carpet installations (Y) and the number
of building permits that have been issued in a given month (X). The data represents
monthly values for the past 10 months.
NARREND
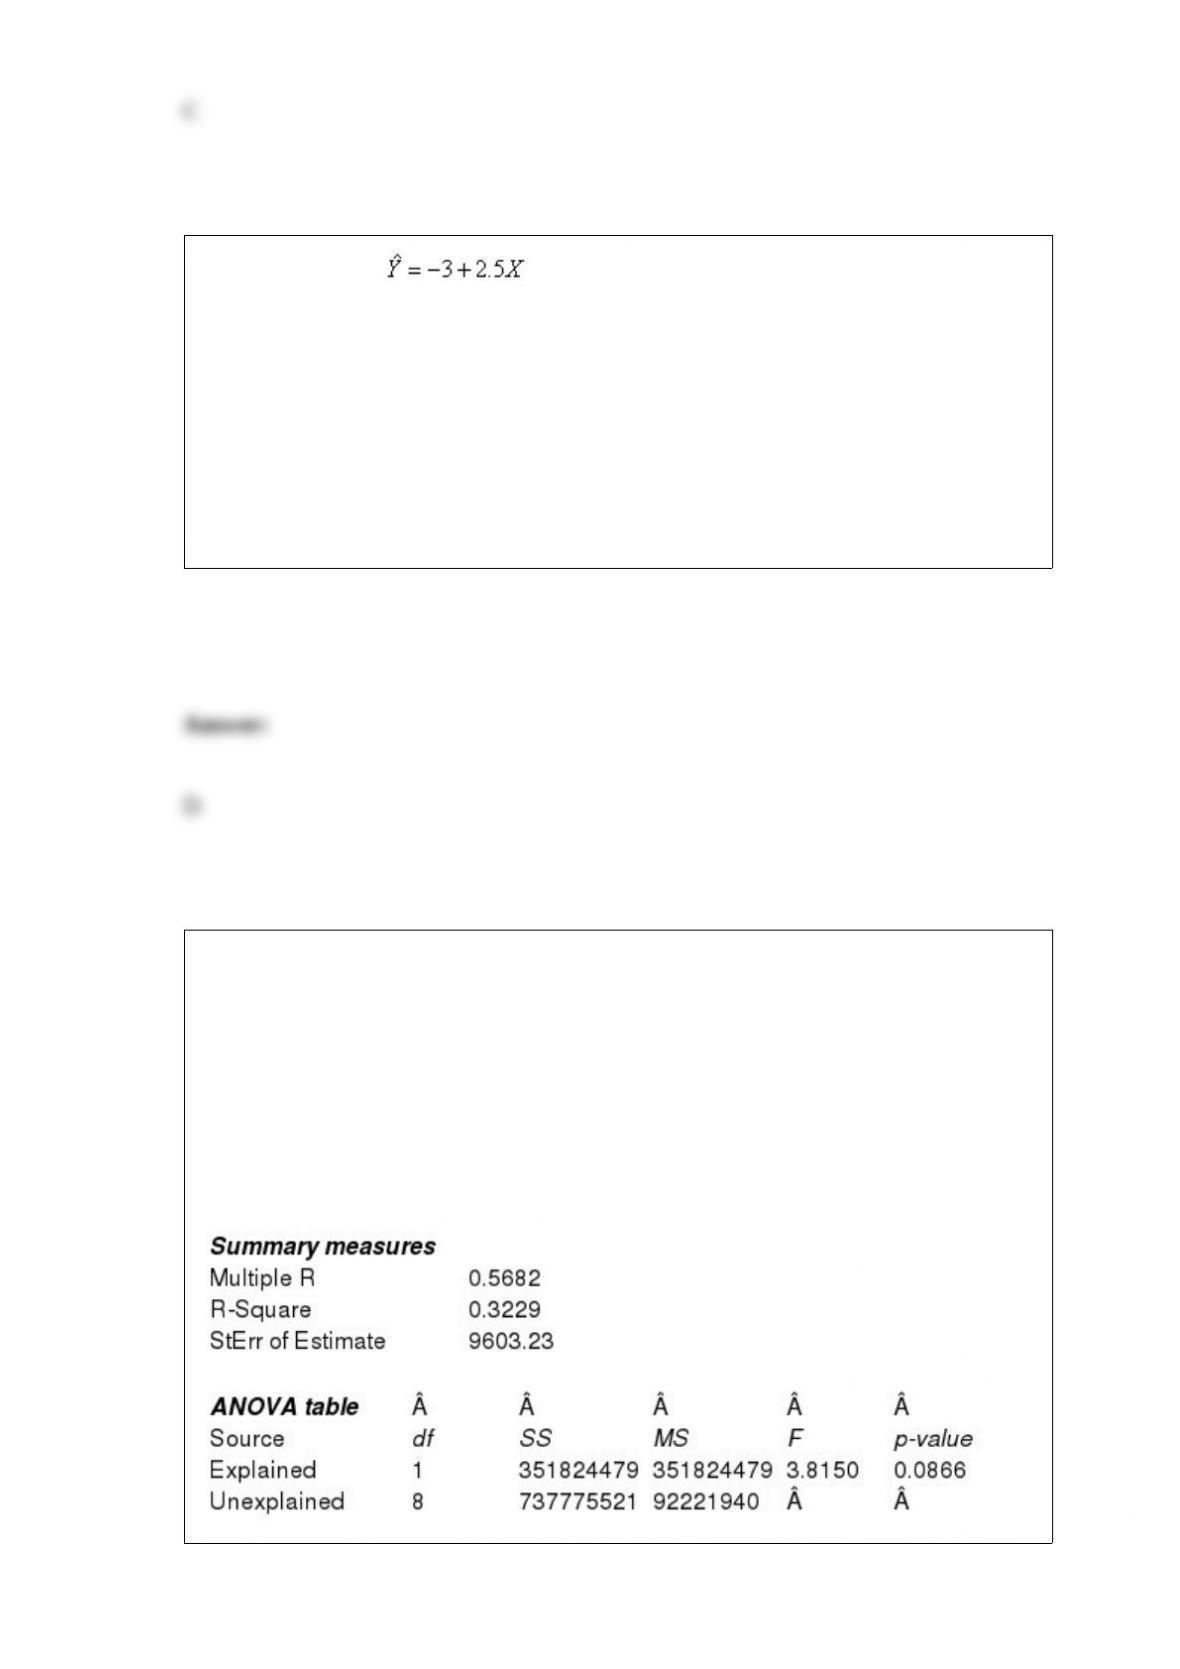
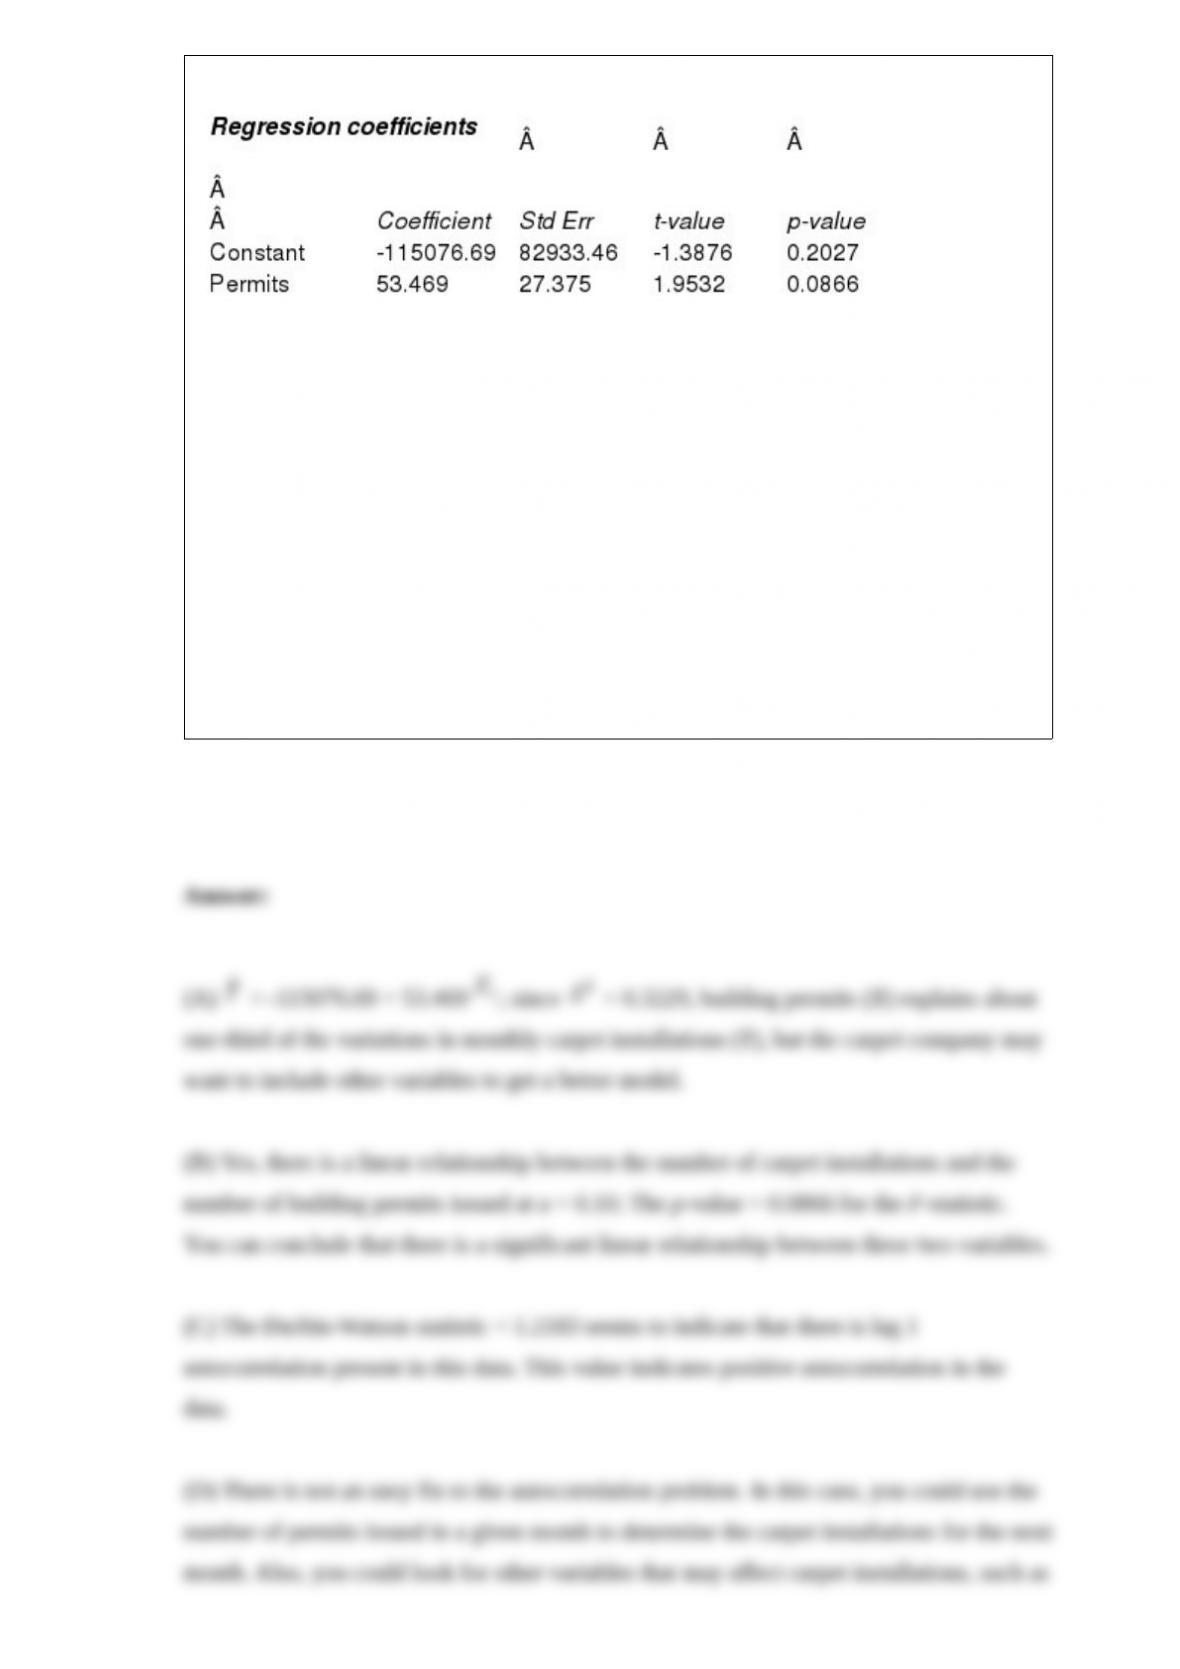
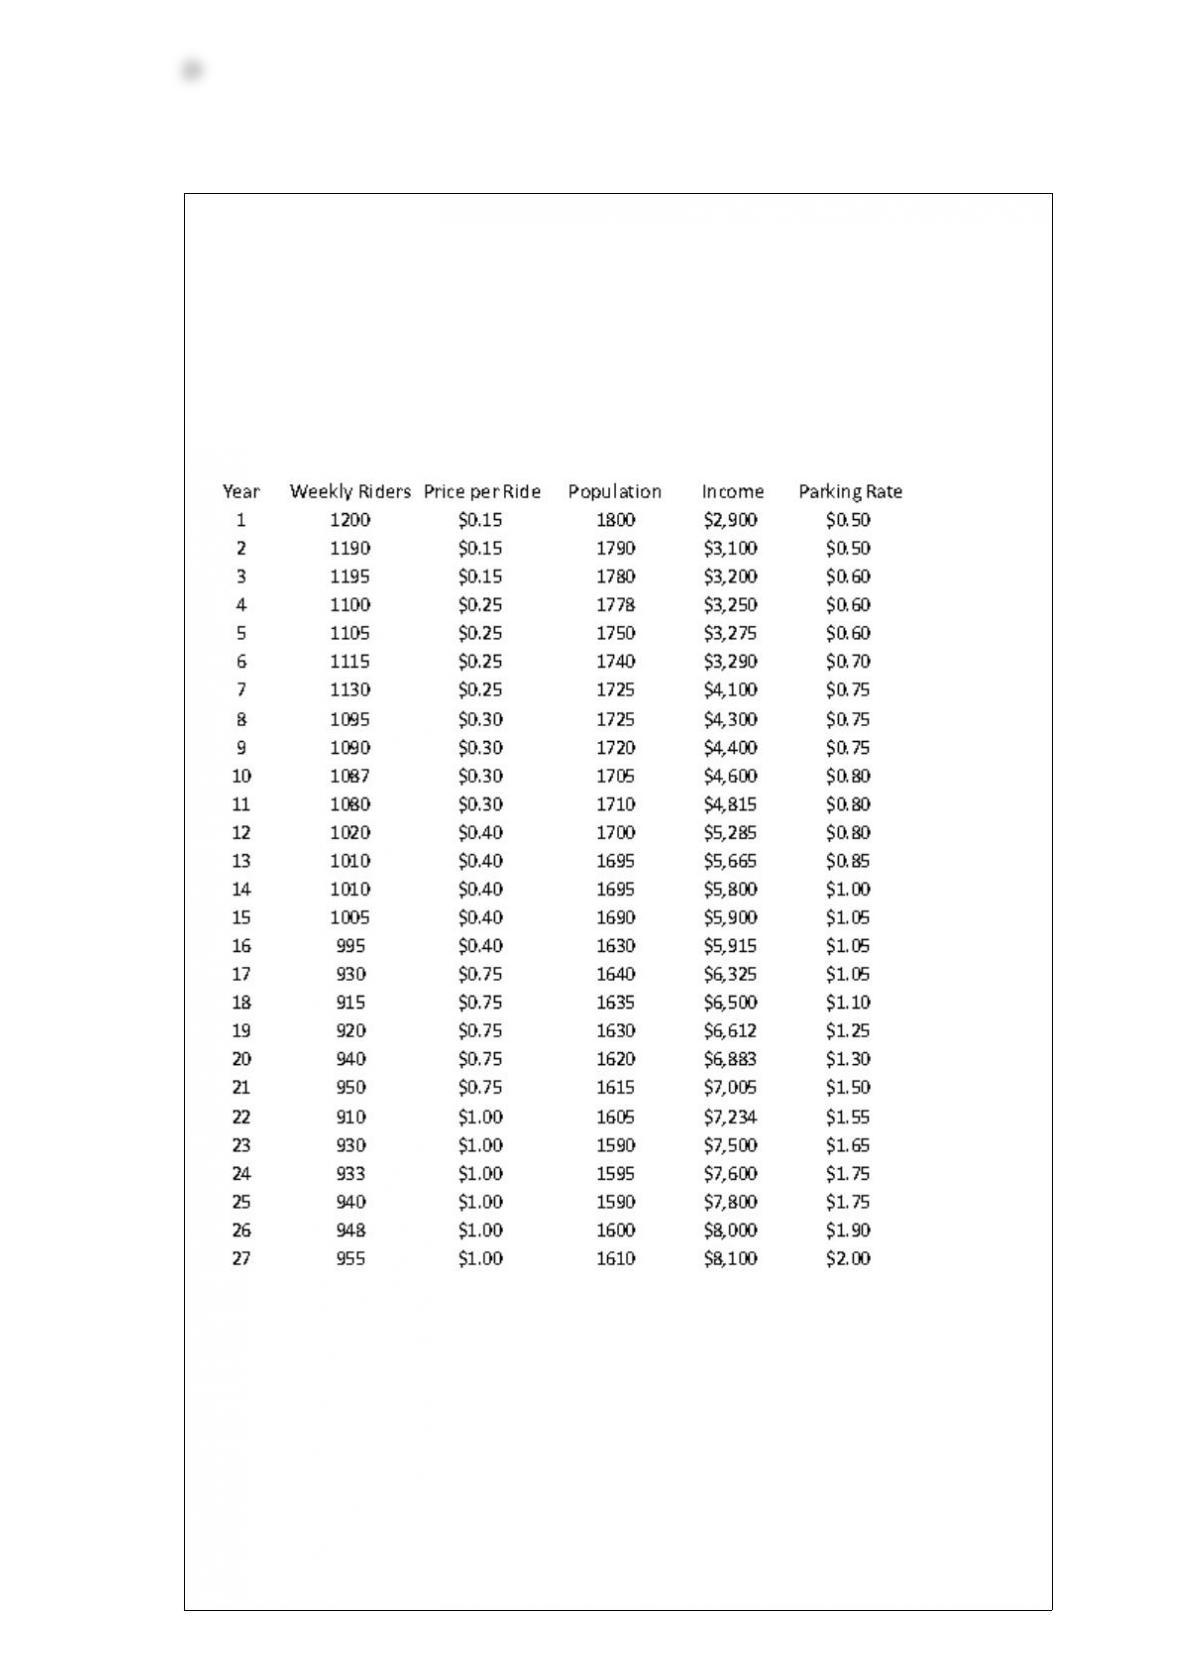
(A) Estimate the regression model. How well does this model fit the given data?
(B) Yes, there is a linear relationship between the number of carpet installations and the
number of building permits issued at a = 0.10; The p-value = 0.0866 for the F-statistic.
You can conclude that there is a significant linear relationship between these two
variables.
(C) The Durbin-Watson statistic for this data was 1.2183. Given this information what
would you conclude about the data?
(D) Given your answer in (C), would you recommend modifying the original regression
model? If so, how would you modify it?

The value k in the number of degrees of freedom, n-k-1, for the sampling distribution of
the regression coefficients represents:
a. the sample size
b. the population size
c. the number of coefficients in the regression equation, including the constant
d. the number of independent variables included in the equation
If two events are mutually exclusive, what is the probability that one or the other
occurs?
a. 0.25
b. 0.50
c. 1.00
d. Cannot be determined from the information given.

The appropriate hypothesis test for an ANOVA test is:
a.
b.
c.
d.
Which of the following can be obtained with a tornado chart?
a. The absolute change in expected value resulting from the change in each input
variable
b. The percent change in expected value resulting from the change in each input
variable
c. A ranking of the relative sensitivity of expected value to each input variable
d. None of these options
e. All of these options

In a minimum cost network flow model, the flow balance constraint for each
supplynode takes the form
a. Flow in Flow out + Net supply
b. Flow out Flow in + Net demand
c. Flow in = Flow out
d. Flow out Flow in + Net supply
e. Flow in Flow out + Net demand
Non-truthful response is a particular problem when:
a. sensitive questions are asked.
b. surveys are anonymous.
c. interviewers are not trained.
d. the sample is from an unusual population.
The equation of the line representing the constraint passes through the
points:
a.
b.

c.
d.
In a marketing and sales model, which of the following might be a good choice for a
discrete distribution to model the random timing of sales?
a. RAND()
b. Normal distribution
c. Binomial distribution
d. Exponential distribution
e. Poisson distribution
If residuals separated by one period are autocorrelated, this is called:
a. simple autocorrelation
b. redundant autocorrelation
c. time 1 autocorrelation
d. lag 1 autocorrelation

Which of the following statements are true:
a. A fairly recent alternative to algebraic modeling is spreadsheet modeling. Instead of
relating various quantities with algebraic equations and inequalities, we relate them in a
spreadsheet with cell formulas.
b. Data are usually meaningless until they are analyzed for trends, patterns,
relationships, and other useful information
c. Algebraic models, by means of algebraic equations and inequalities, specify a set of
relationships in a very precise way. Their main drawback is that they require an ability
to work with abstract mathematical symbols.
d. When we make inferences from data and search for relationships in data, or when we
use decision trees to help make decisions, we must deal with uncertainty.
e. All of these options
The idea of the chi”square test for independence is to:
a. compare the quantile-quantile (Q-Q) plot with what would be expected under
independence
b. compare the actual counts in a contingency table with what would be expected under
independence
c. compare the cumulative distribution with what would be expected under
independence
d. None of these options

Data that arise from counts are called:
a. continuous data
b. nominal data
c. counted data
d. discrete data
Which of the following is an Excel add-in for simulation?
a. PrecisionTree
b. TopRank
c. Solver
d. @Risk
e. StatTools
NARRBEGIN: SA_124_126
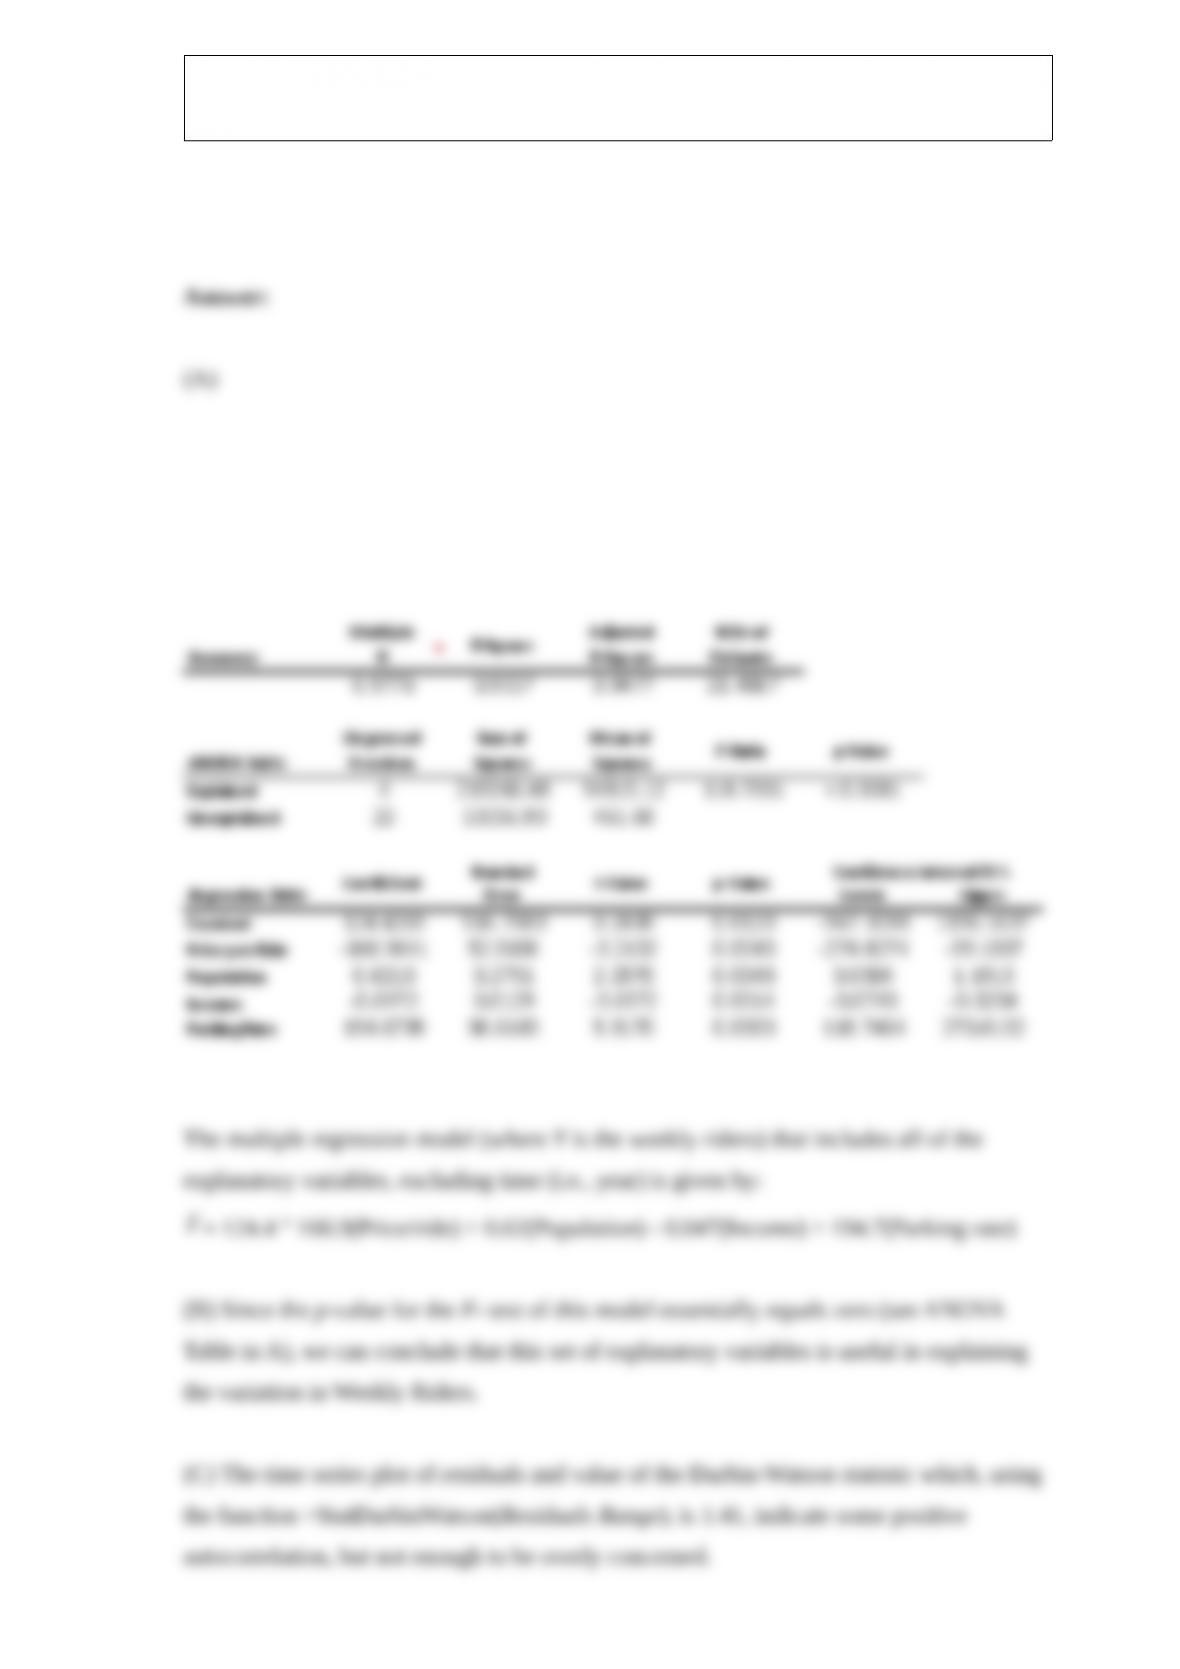
The manager of a commuter rail transportation system was recently asked by his
governing board to predict the demand for rides in the large city served by the
transportation network. The system manager has collected data on variables thought to
be related to the number of weekly riders on the city’s rail system. The table shown
below contains these data.
The variables “weekly riders” and “population” are measured in thousands, and the
variables “price per ride”, “income”, and “parking rate” are measured in dollars.
NARREND
(A) Estimate a multiple regression model using all of the available explanatory
variables.
(B) Conduct and interpret the result of an F– test on the given model. Employ a 5%
level of significance in conducting this statistical hypothesis test.
(C) Is there evidence of autocorrelated residuals in this model? Explain why or why not.

If the mean of an exponential distribution is 2, then the value of the parameter is
a. 4
b. 2
c. 1
d. 0.5
One-way ANOVA is often used in situations where:
a. there are two populations
b. randomly selected populations
c. randomized experiments with a single population
d. none of these options

There is approximately _____ % chance that any particular will be within two
standard deviations of the population mean ( ).
a. 90
b. 95
c. 99
d. 99.7
If two events are mutually exclusive, what is the probability that both occur at the same
time?
a. 0.00
b. 0.50
c. 1.00
d. Cannot be determined from the information given.

The Central Limit Theorem (CLT) is generally valid for:
a. n > 5
b. n > 10
c. n > 20
d. n > 30
e. any size n
NARRBEGIN: SA_98_102
An automobile rental company wants to predict the yearly maintenance expense (Y) for
an automobile using the number of miles driven during the year ( ) and the age of the
car ( , in years) at the beginning of the year. The company has gathered the data on
10 automobiles and run a regression analysis with the results shown below:.
NARREND
(A) Use the information above to estimate the linear regression model.
(B) Interpret each of the estimated regression coefficients of the regression model in
(A).
(C) Identify and interpret the coefficient of determination ( ), for the model in (A).
(D) Identify and interpret the adjusted for the model in (A).
Given that Z is a standard normal random variable, P(-1.0 Z1.5) is
a. 0.7745
b. 0.8413
c. 0.0919
d. 0.9332

Which of the following is the relevant sampling distribution for regression coefficients?
a. Normal distribution
b. t-distribution with n-1 degrees of freedom
c. t-distribution with n-1-k degrees of freedom
d. F-distribution with n-1-k degrees of freedom
NARRBEGIN: SA_73_74
A market research consultant hired by Coke Classic Company is interested in
estimating the difference between the proportions of female and male customers who
favor Coke Classic over Pepsi Cola in Chicago. A random sample of 200 consumers
from the market under investigation showed the following frequency distribution.
NARREND
(A) Construct a 95% confidence interval for the difference between the proportions of
male and female customers who prefer Coke Classic over Pepsi Cola.
(B) Interpret the constructed confidence interval.

After calculating the sample size needed to estimate a population proportion to within
0.05, you have been told that the maximum allowable error (B) must be reduced to just
0.025. If the original calculation led to a sample size of 1000, the sample size will now
have to be:
a. 2000
b. 4000
c. 1000
d. 8000
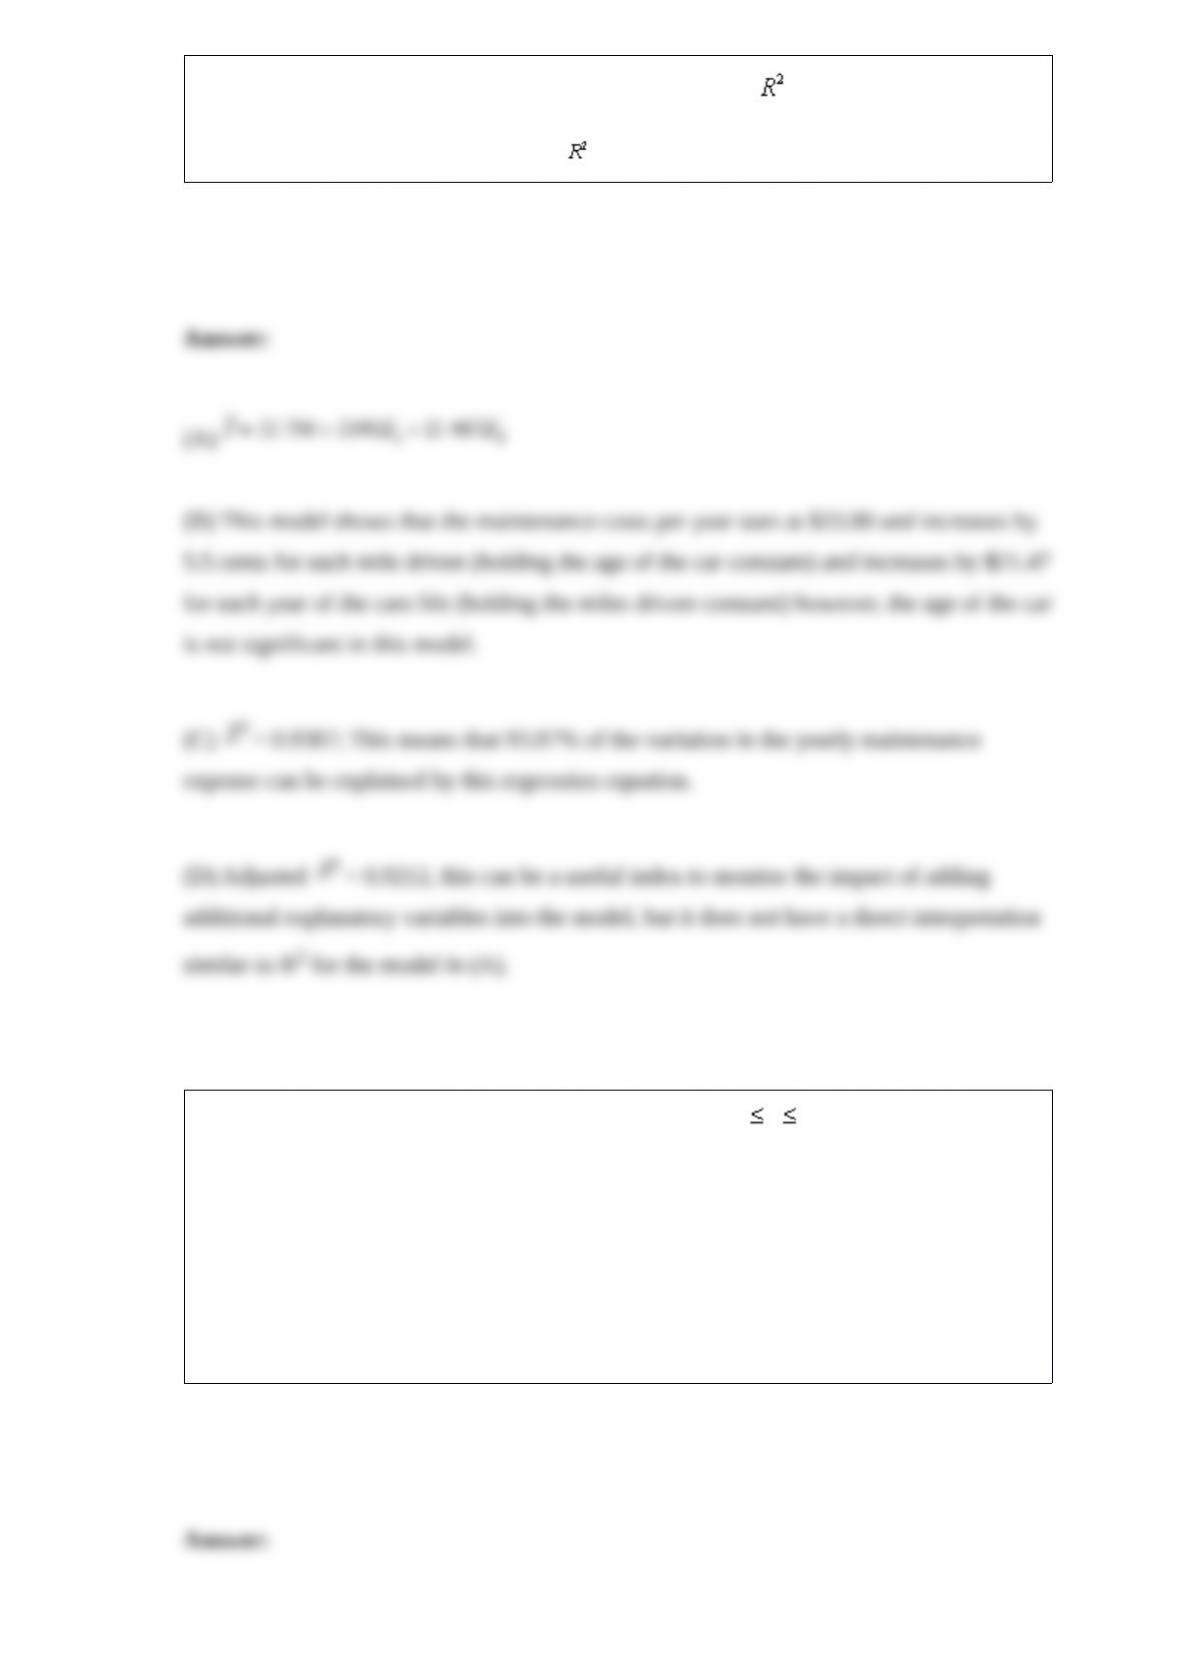
NARRBEGIN: SA_101_107
The personnel department of a large corporation wants to estimate the family dental
expenses of its employees to determine the feasibility of providing a dental insurance
plan. A random sample of 12 employees in 2004 reveals the following family dental
expenses (in dollars): 115, 370, 250, 93, 540, 225, 177, 425, 318, 182, 275, and 228.
Use StatTools for your calculations.

NARREND
(A) Construct a 90% confidence interval estimate of the mean family dental expenses
for all employees of this corporation.
(B) What assumption about the population distribution must be made to answer (A)?
(C) Interpret the 90% confidence interval constructed in (A).
(D) Suppose you used a 95% confidence interval in (A). What would be your answer?
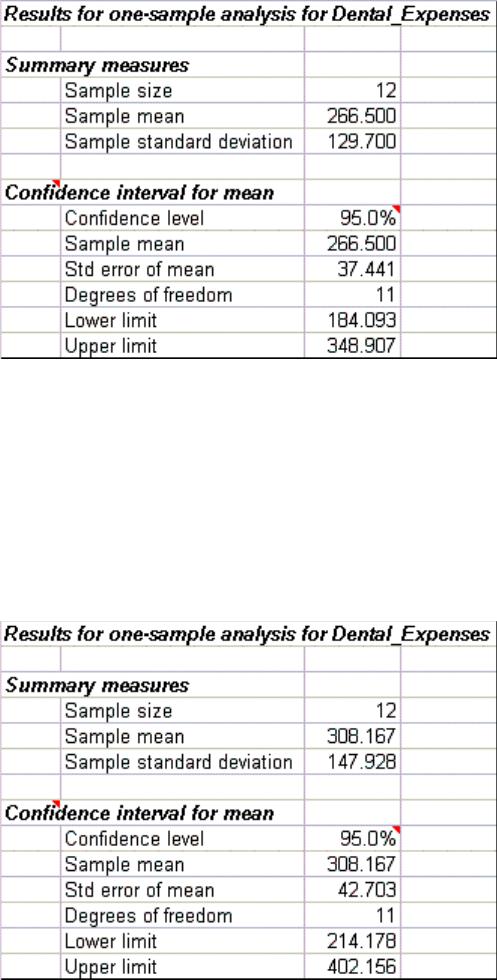
(E) Suppose the fourth value were 593 instead of 93. What would be your answer to
(A)? What effect does this change have on the confidence interval?
(F) Construct a 90% confidence interval estimate for the standard deviation of family
dental expenses for all employees of this corporation.
(G) Interpret the 90% confidence interval constructed in (E).
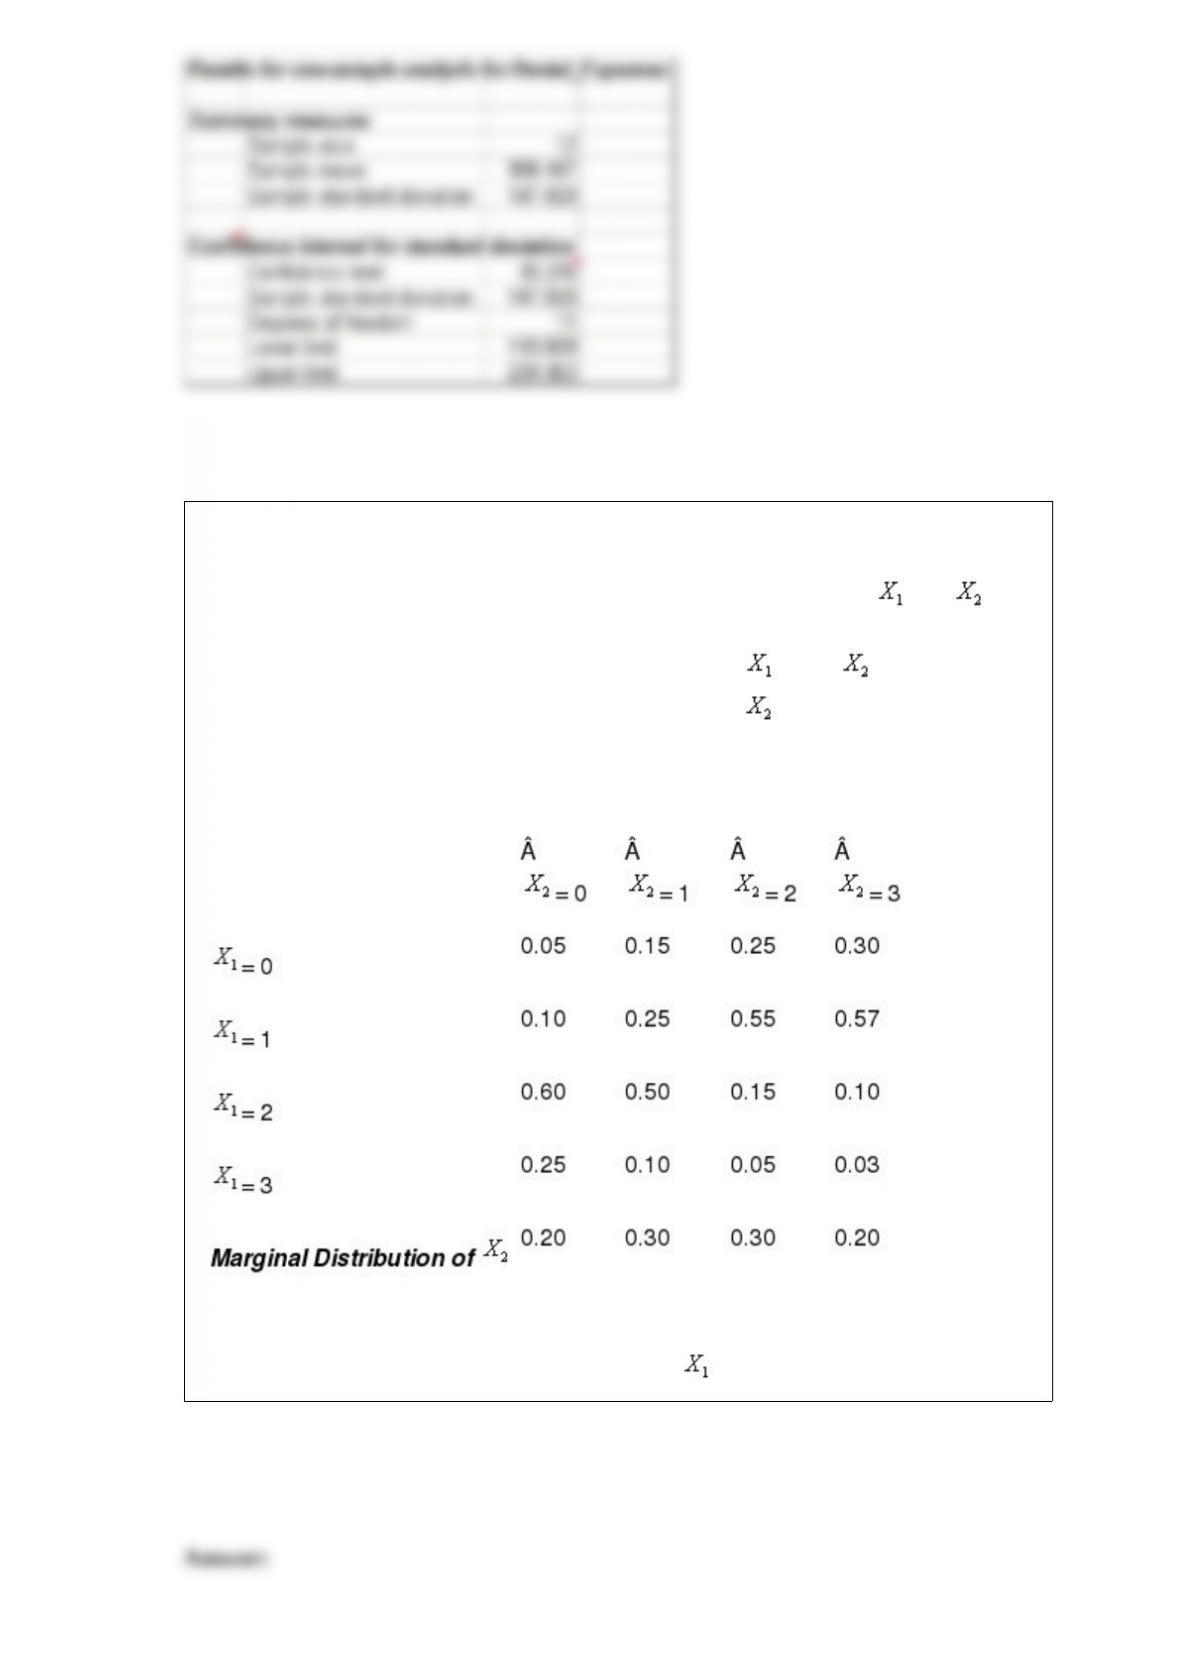
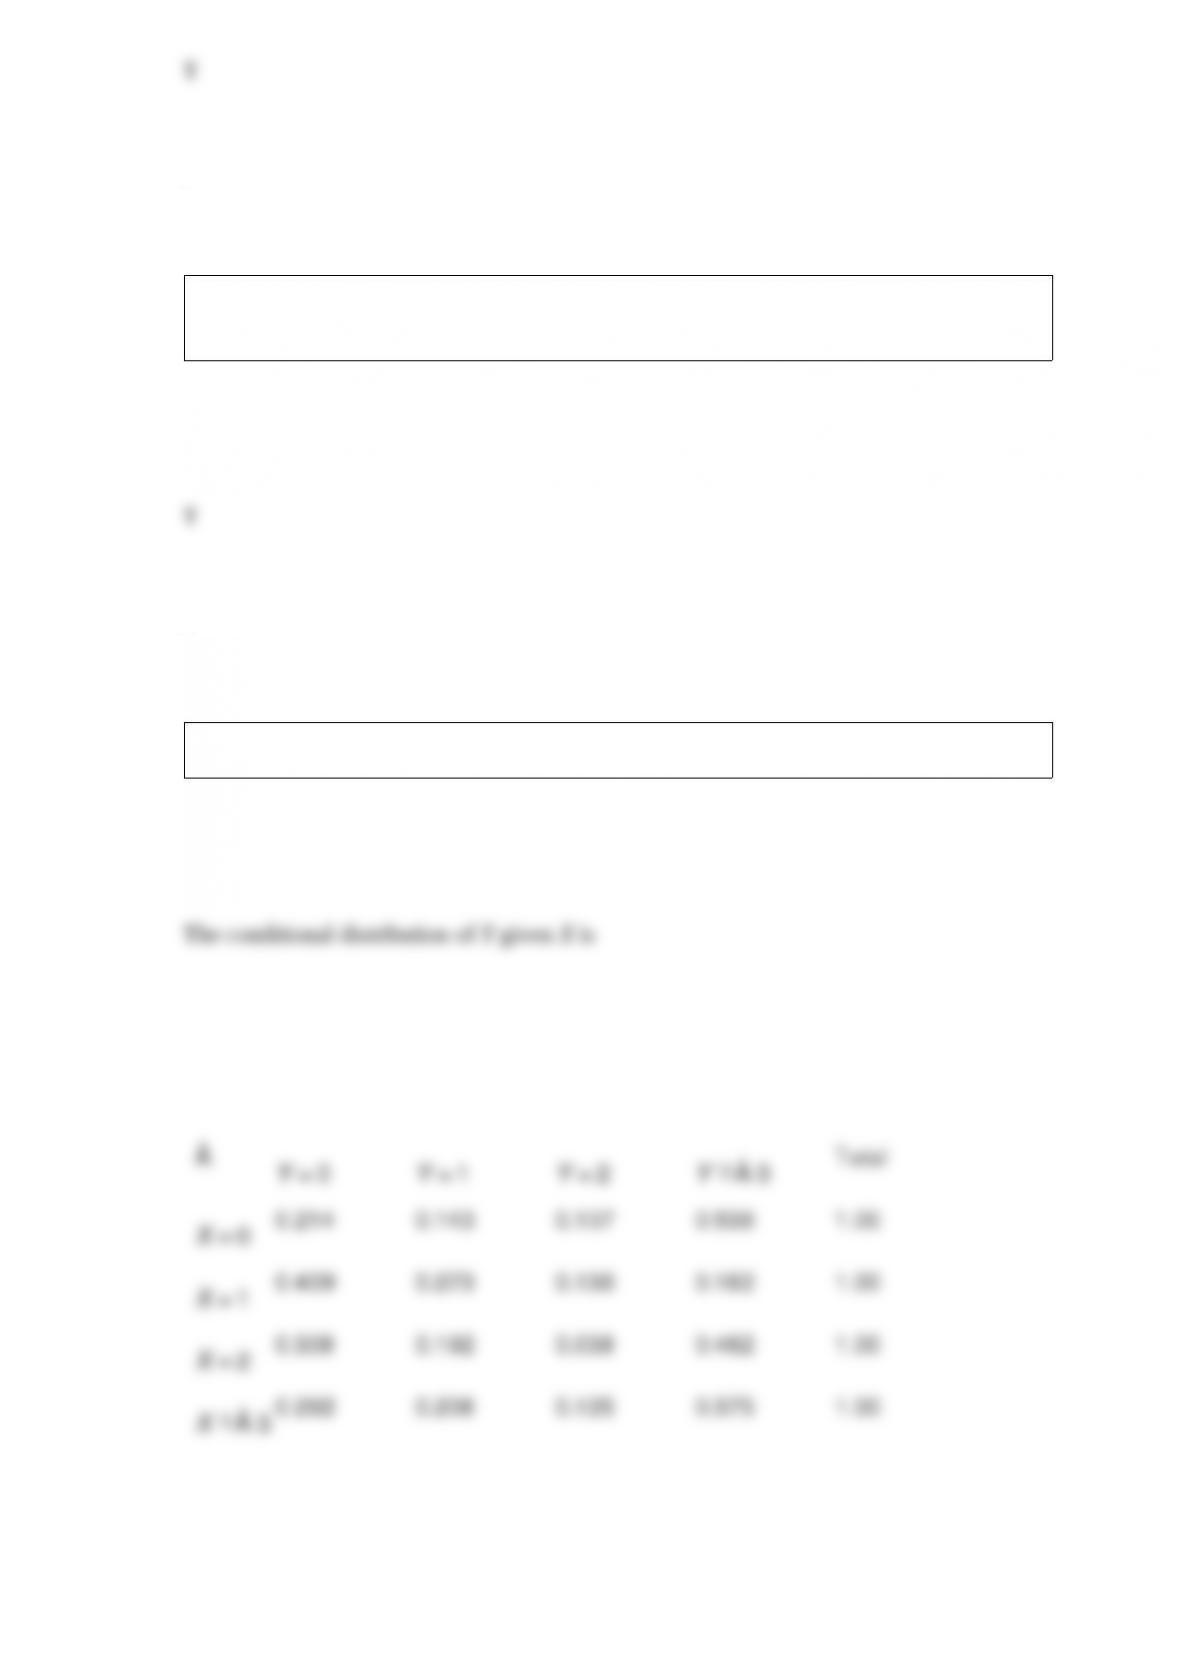
NARRBEGIN: SA_84_90
A sporting goods store sells two competing brands of softball bats. Let and be
the numbers of the two brands sold on a typical day at the store. Based on the store
historical data, the conditional probability distribution of given is assessed and
provided in the table below. The marginal distribution of is also given in the bottom
row of the table.
Sales of Brand 1, Given sales of Brand 2
NARREND
Determine the marginal probability distribution of .

NARRBEGIN: SA_117_120
The time it takes a technician to fix a computer problem is exponentially distributed
with a mean of 15 minutes.
NARREND
What is the probability that it will take a technician less than 10 minutes to fix a
computer problem?
Graphical models can be very helpful for simple problems. For complex problems,
however, graphical models usually fail to show the important elements of a problem
and how they are related.
A time series is any variable that is measured over time in sequential order.

Reduced costs indicate how much the objective coefficient of a decision variable that is
currently 0 or at its upper bound must change before that the value of that variable
changes.
In order to test the significance of a multiple regression model involving 4 explanatory
variables and 40 observations, the numerator and denominator degrees of freedom for
the critical value of F are 4 and 35, respectively.
NARRBEGIN: SA_86_90
A statistics professor has just given the final examination in his introductory statistics
course. In particular, he is interested in learning how his class of 50 students performed
on this exam. The data are shown below.
NARREND
A cannery claims that its sardine cans have a net weight of 8 oz., with a standard
deviation of 0.1 oz. You take a simple random sample of 30 cans and encounter a
sample mean of 7.85 oz. Are you inclined to believe the claim?
It is customary to approximate the standard error of the sample mean by substituting
the sample standard deviation s for in the formula: SE( ) = .
A list of all members of the population from which we can choose a sample is called a
frame, and the potential sample members are called sampling units.

If A and B are independent events with P(A) = 0.40 and P(B) = 0.50, then P(A/B) is
0.50.
NARRBEGIN: SA_91_103
A sample of 1000 households was selected in Los Angeles to determine information
concerning consumer behavior. Among the questions asked was “Do you enjoy
shopping for clothing?” Of 480 males, 272 answered yes. Of 520 females, 448
answered yes.
NARREND
Give an example of a joint event.
A random variable is a function that associates a numerical value with each possible
outcome of a random phenomenon.
One method of diagnosing heteroscedasticity is to plot the residuals against the
predicted values of Y, then look for a change in the spread of the plotted values.
Calculate the conditional distribution of Y given X.
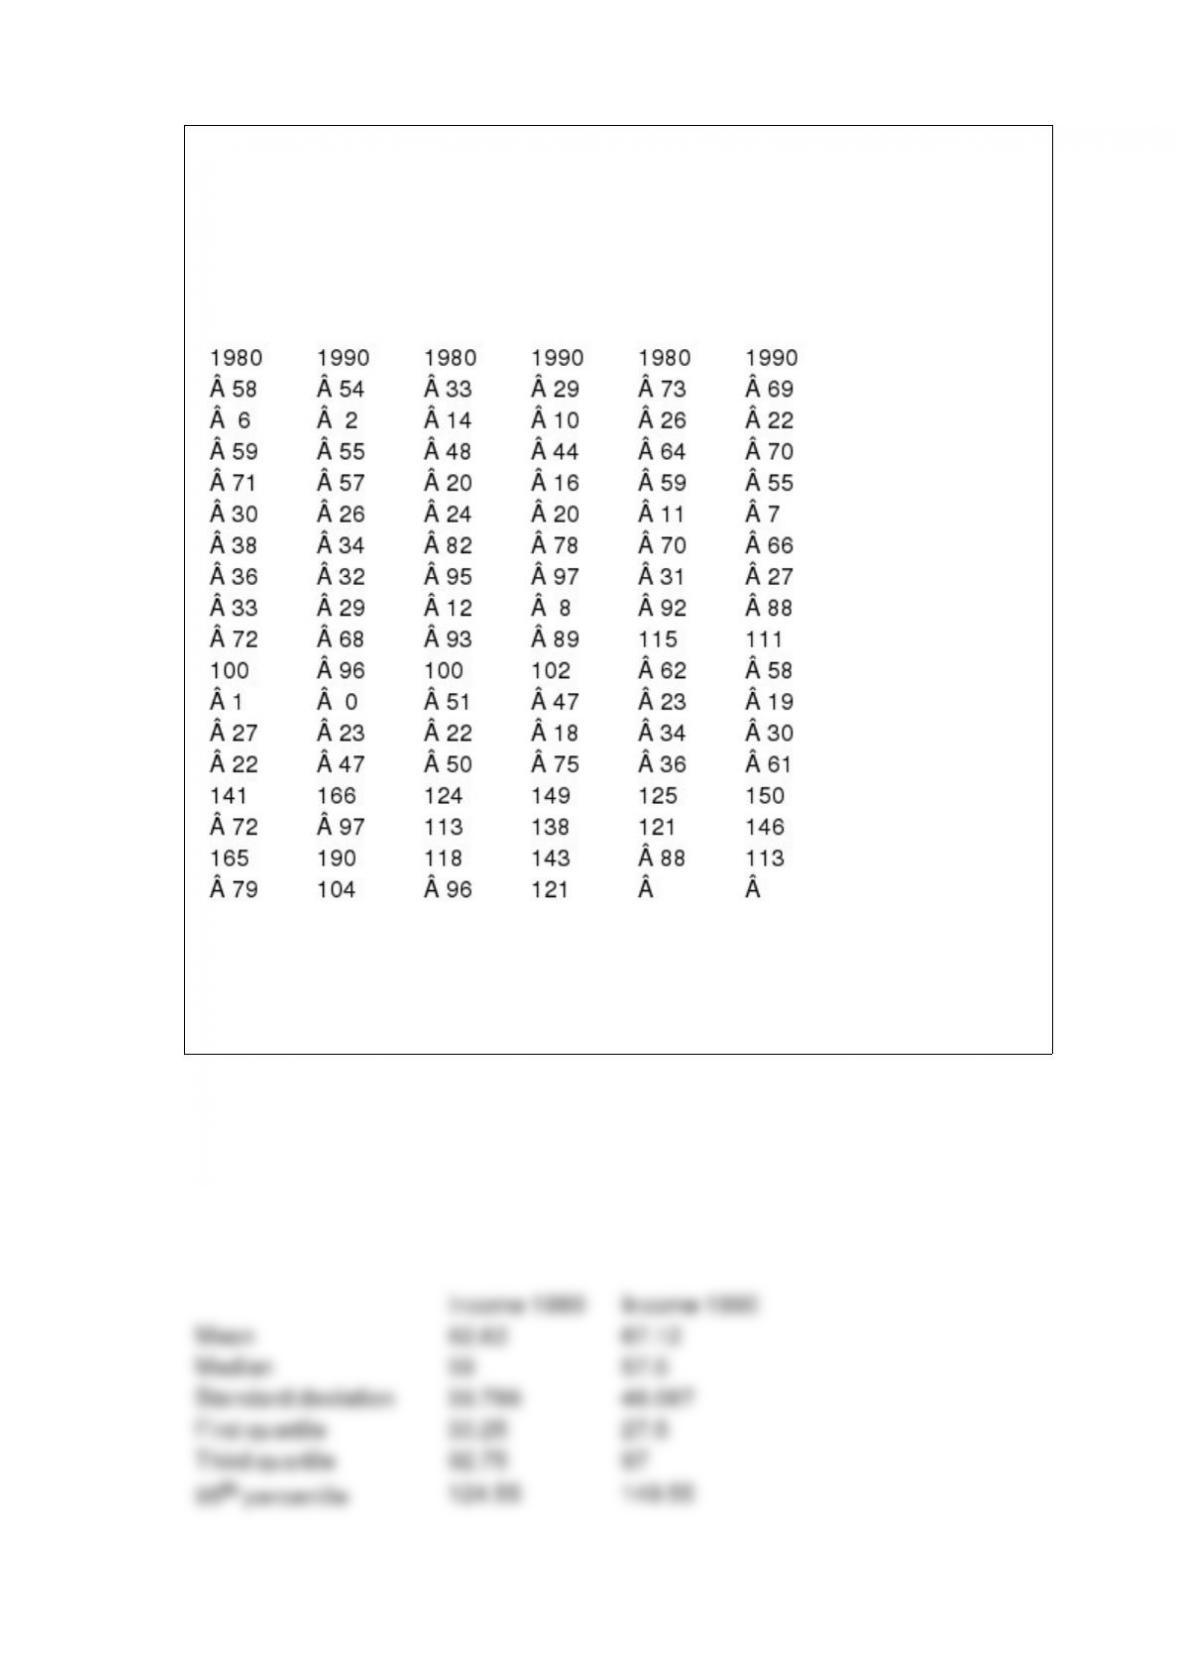
NARRBEGIN: SA_76_78
The data shown below contains family incomes (in thousands of dollars) for a set of 50
families; sampled in 1980 and 1990. Assume that these families are good
representatives of the entire United States.
NARREND
Find the mean, median, standard deviation, first and third quartiles, and the 95th
percentile for family incomes in both years.
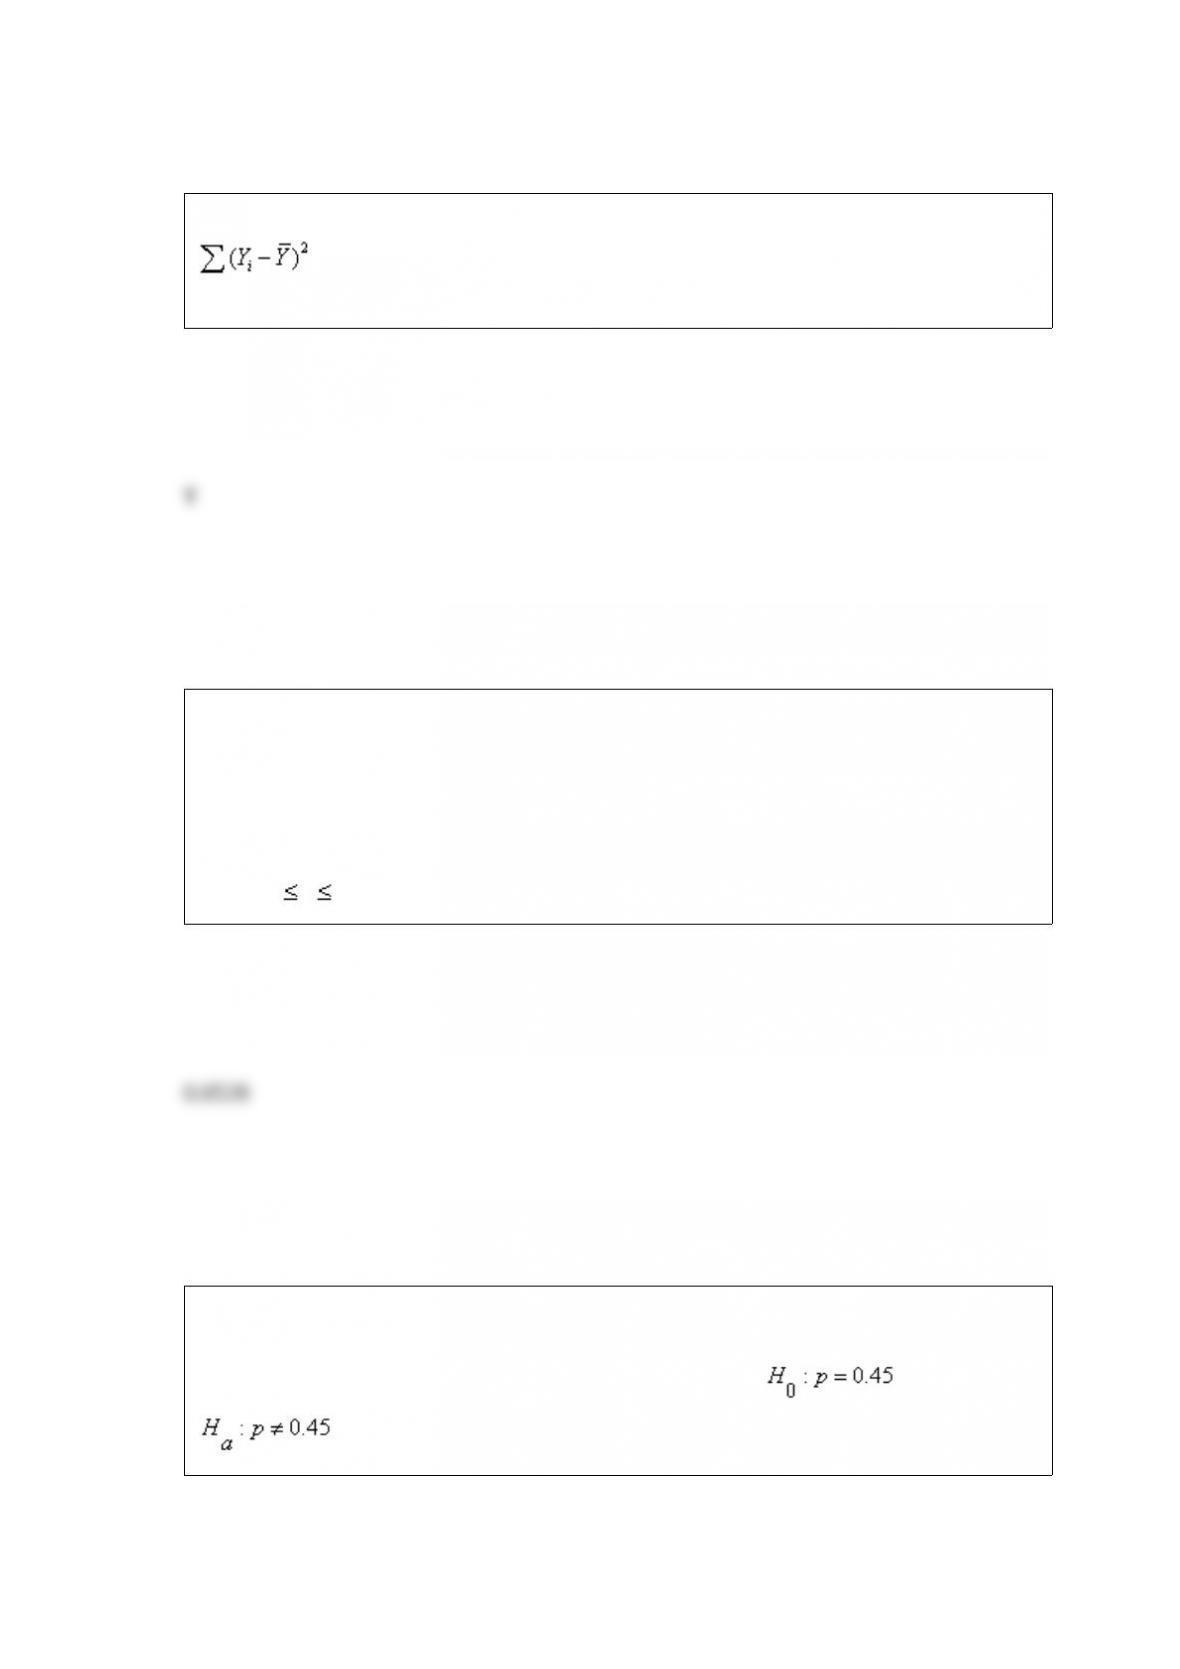
In regression analysis, the total variation in the dependent variable Y, measured by
and referred to as SST, can be decomposed into two parts: the explained
variation, measured by SSR, and the unexplained variation, measured by SSE.
NARRBEGIN: SA_91_94
Consider a binomial random variable X withn = 5 and p = 0.40.
NARREND
Find P(2 X4).
A professor of statistics refutes the claim that the proportion of Republican voters in
Michigan is at most 45%. To test the claim, the hypotheses: ,
, should be used.