
NARRBEGIN: SA_115_116
A used car salesman in a small town states that, on the average, it takes him 5 days to
sell a car. Assume that the probability distribution of the length of time between sales is
exponentially distributed.
NARREND
What is the probability that he will have to wait between 6 and 10 days before making
another sale?
The standard error of the sampling distribution of the sample proportion ,when the
sample size n = 50 and the population proportion p = 0.25, is 0.00375.
The multiple R for a regression is the correlation between the observed Y values and the
fitted Y values.
NARRBEGIN: SA_79_83
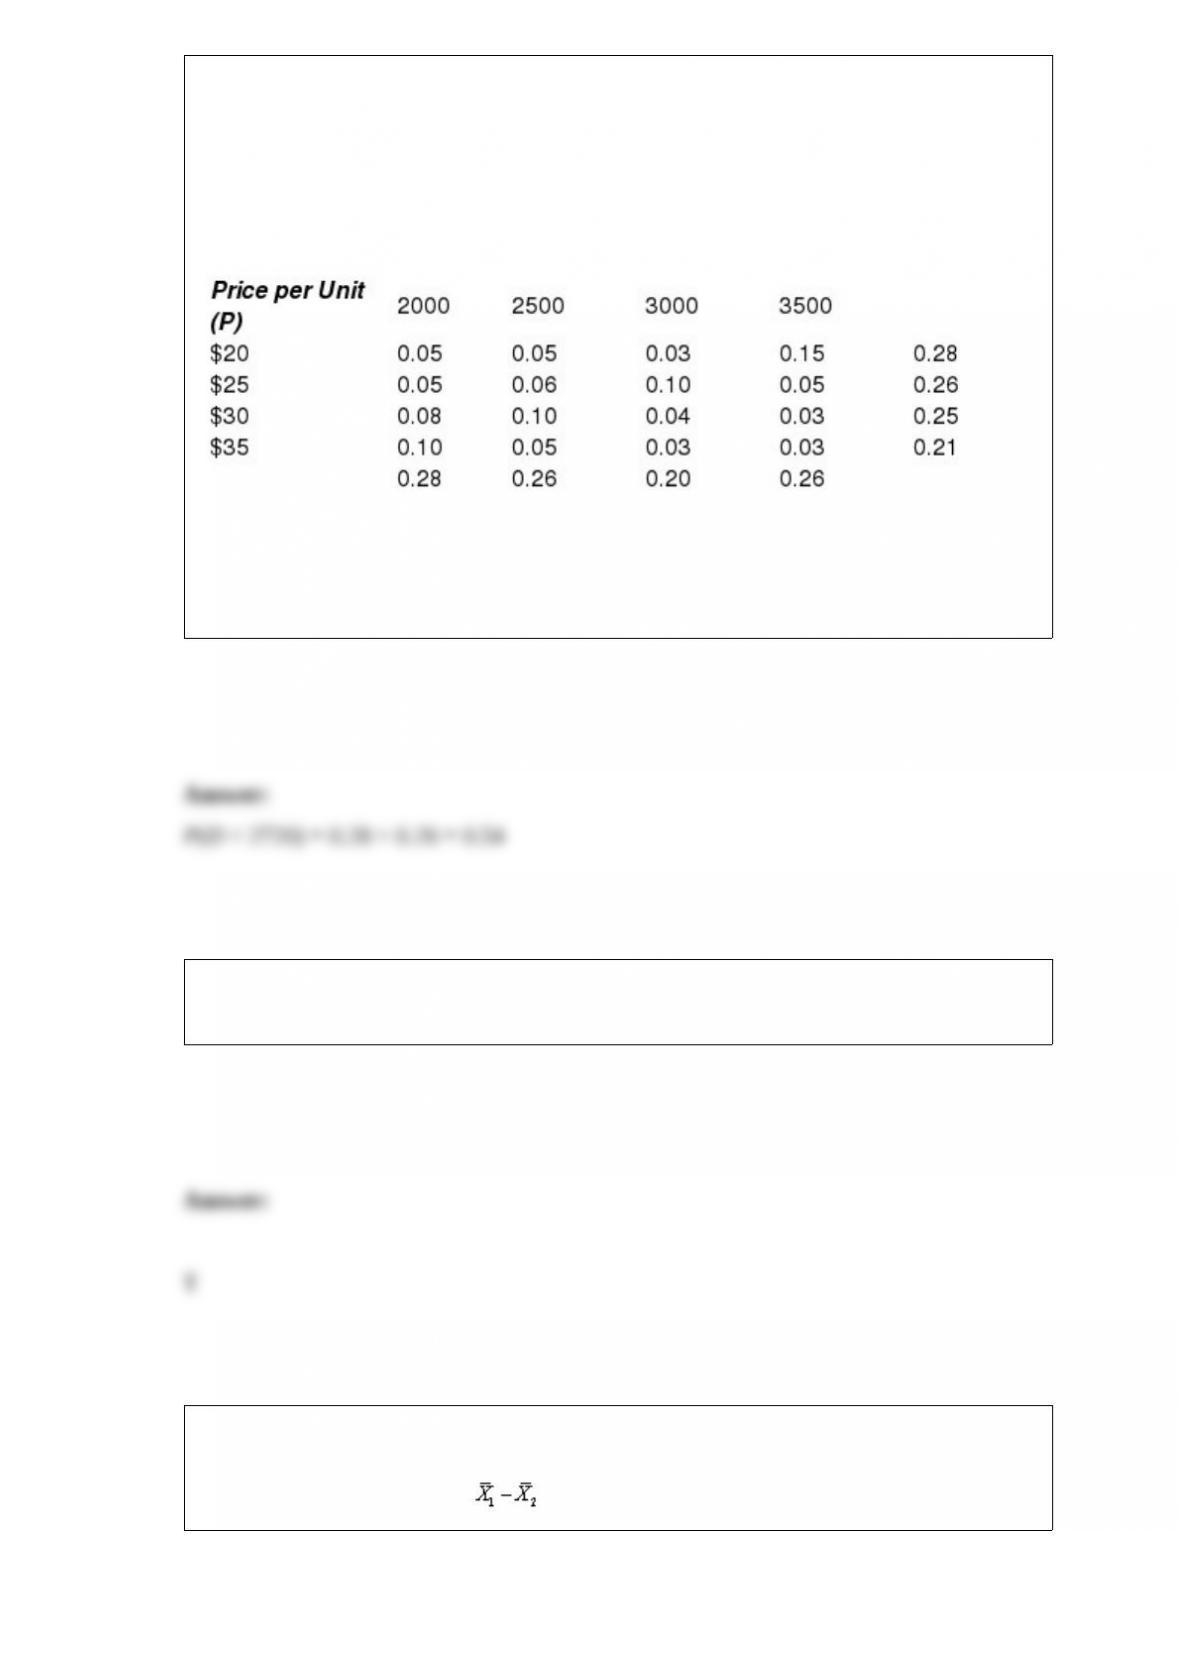
Suppose that the manufacturer of a particular product assesses the joint distribution of
the price per unit (P) and demand (D) for its product in the upcoming quarter as
presented below. Use this information to answer the following questions.
Demand (D)
NARREND
What is the probability that the demand of this product will be below its mean in the
upcoming quarter?
An example of a joint category of two variables is the count of all non-drinkers who are
also nonsmokers.
If two random samples of size 40 each are selected independently from two populations
whose variances are 35 and 45, then the standard error of the sampling distribution of
the sample mean difference, , equals 1.4142.
What changes, if any, would you suggest to improve the forecast?
For some types of integer programming problems, their LP relaxation solutions are
optimal.
NARRBEGIN: SA_79_82
The Waco Tire Company (WTC) is considering expanding production to meet possible
increases in demand. WTC’s alternatives are to construct a new plant, expand the
existing plant, or do nothing in the short run. It will cost them $1 million to build a new
facility and $600,000 to expand their existing facility. The market for this particular
product may expand, remain stable, or contract. ETC’s marketing department estimates
the probabilities of these market outcomes as 0.30, 0.45, and 0.25, respectively. The
expected revenue for each alternative is presented in the table below.

NARREND
Formulate a payoff table that specifies WTC’s payoff (in dollars) associated with each
possible decision and each market condition in the future.
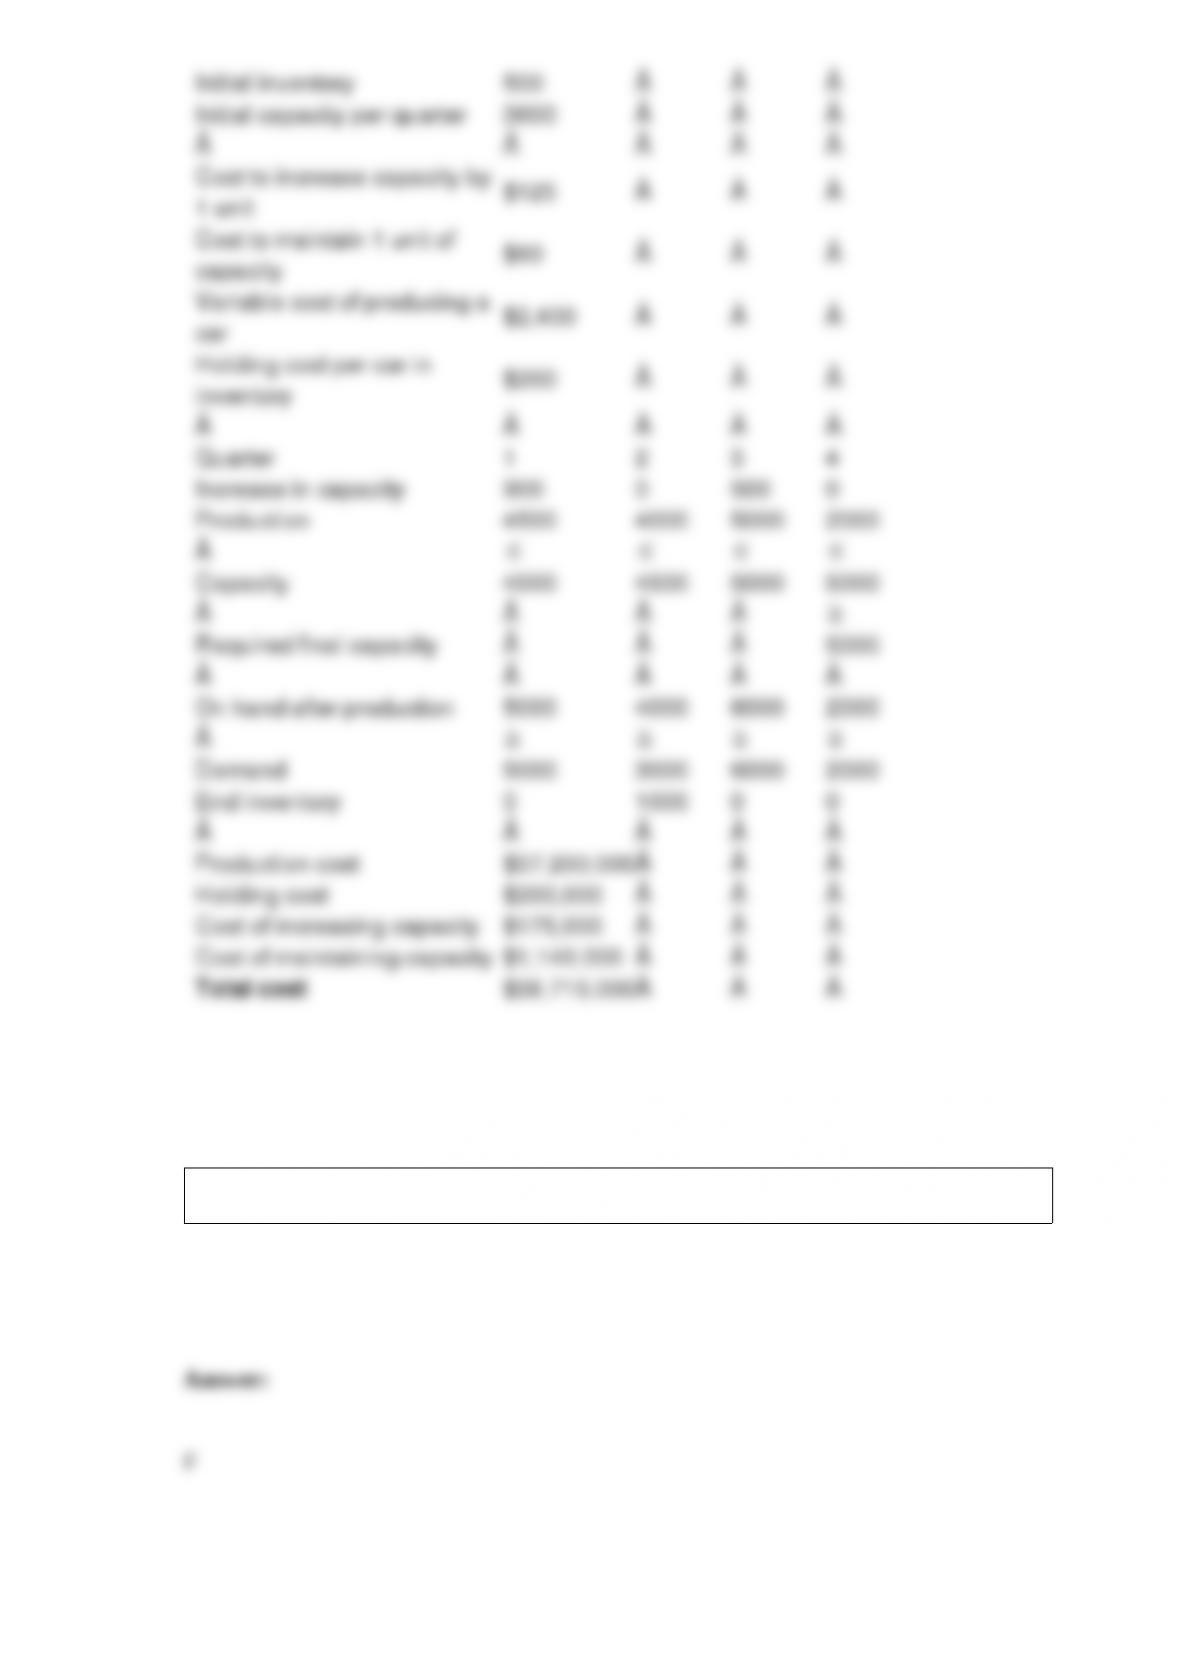
An auto company must meet (on time) the following demands for cars: 5000 in quarter
1; 3000 in quarter 2; 6000 in quarter 3; 2000 in quarter 4. At the beginning of quarter 1,
there are 500 autos in stock. The company has the capacity to produce at most 3600
cars per quarter. At the beginning of each quarter, the company can change production
capacity. It costs $125 to increase quarterly production capacity by one unit. It also
costs $60 per quarter to maintain each unit of production capacity (even if it is unused
during the current quarter). The variable cost of producing a car is $2400. A holding
cost of $200 per car is assessed against each quarter’s ending inventory. It is required
that at the end of quarter 4, plant capacity must be at least 5000 cars. Determine how to
minimize the total cost incurred during the next four quarters.
A common distribution for modeling product lifetimes is the binomial distribution

Interpret the model you developed in Question 139. Does it help you assess the agency’s
claim? What should the agency conclude about the relationship between service interval
and maintenance costs?
The difference between the first and third quartiles is called the interquartile range.
Suppose that one equation has 3 explanatory variables and an F-ratio of 49. Another
equation has 5 explanatory variables and an F-ratio of 38. The first equation will always
be considered a better model.
In decision trees, a decision node (a square) is a time when the result of an uncertain
event becomes known.
NARRBEGIN: SA_84_90
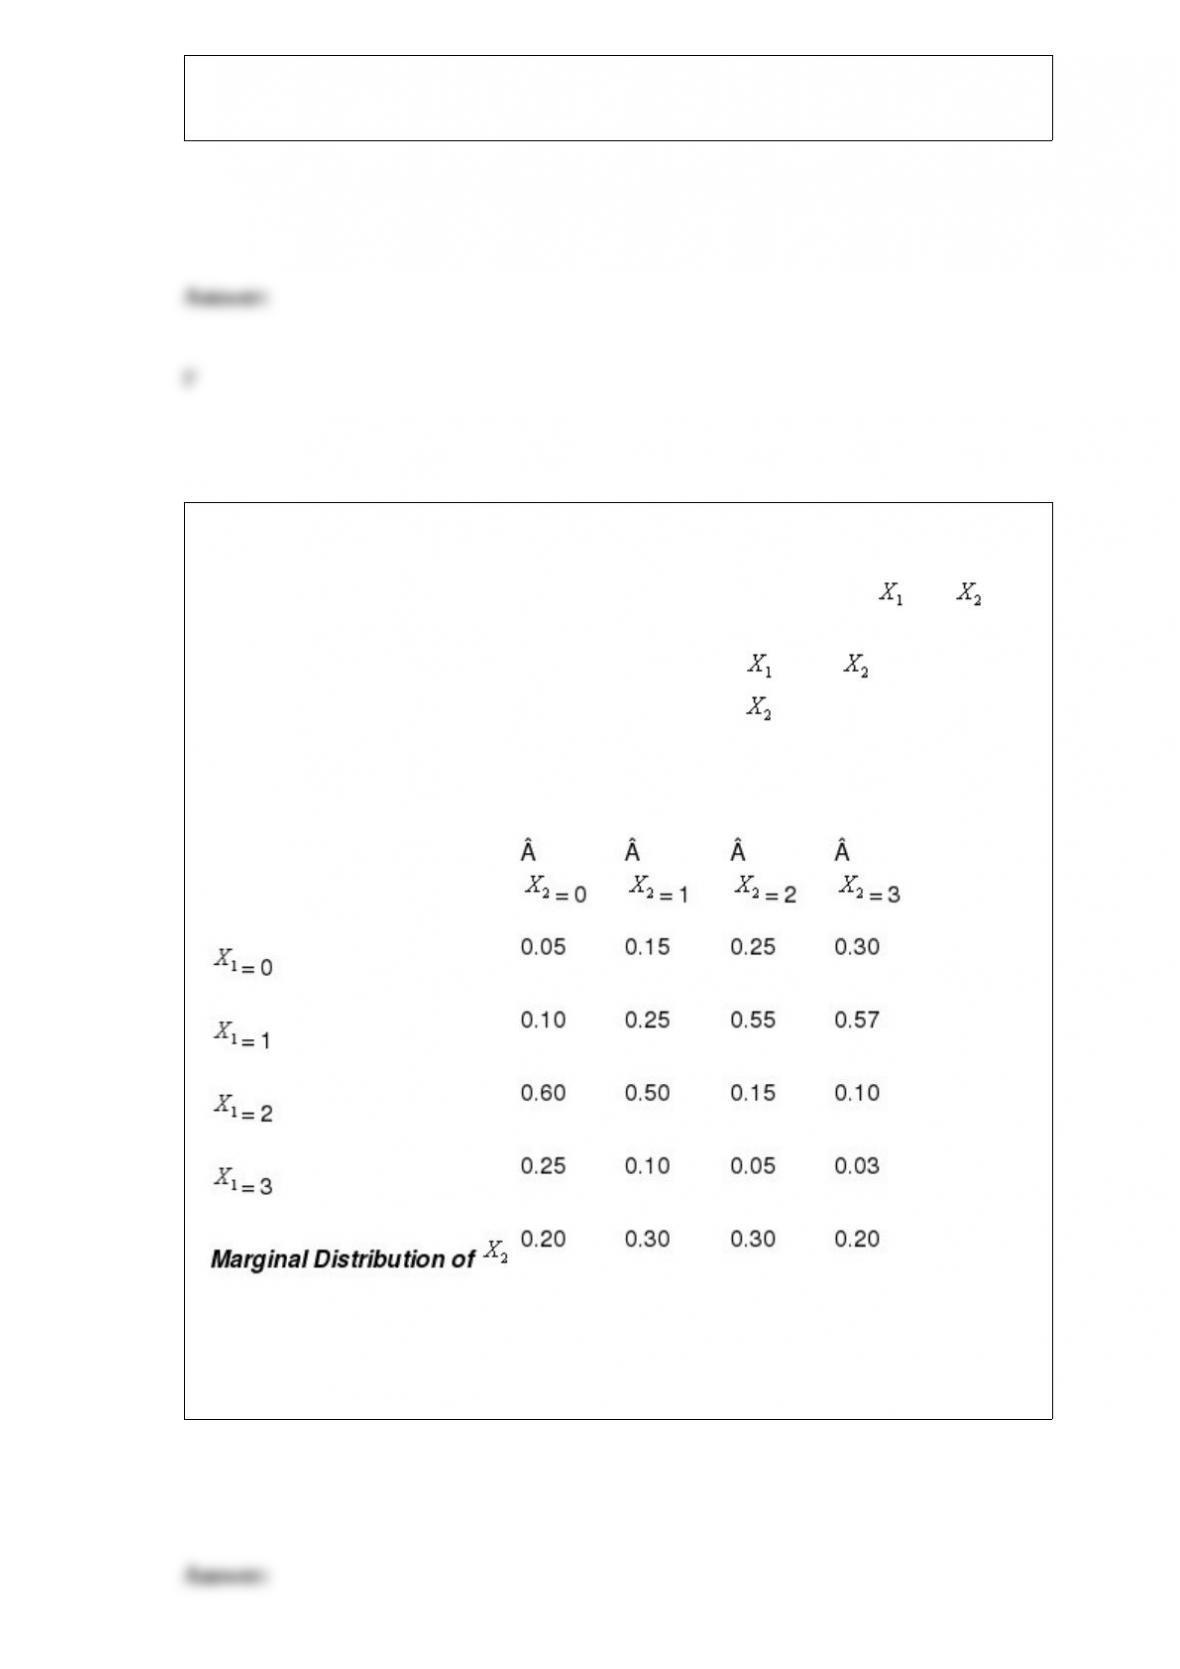
A sporting goods store sells two competing brands of softball bats. Let and be
the numbers of the two brands sold on a typical day at the store. Based on the store
historical data, the conditional probability distribution of given is assessed and
provided in the table below. The marginal distribution of is also given in the bottom
row of the table.
Sales of Brand 1, Given sales of Brand 2
NARREND
What is the probability of observing the sale of no more than two brand 2 bats on a
given day at this sporting goods store?

You think you have a 90% chance of passing your statistics class. This is an example of
subjective probability.