
The effect of a logarithmic transformation on a variable that is skewed to the right by a
few large values is to “squeeze” the values together and make the distribution more
symmetric
The coefficients for logarithmically transformed explanatory variables should be
interpreted as the percent change in the dependent variable for a 1% percent change in
the explanatory variable.
NARRBEGIN: SA_57_64
Amanda is a recent college graduate, and has just started her first job. She would like to
know if she saves $5,000 per year out of her salary over the next 30 years what the
distribution of the value of her retirement fund after 30 years. She has decided that she
will invest all her money in the stock market that she estimates has a return that is
normally distributed with mean 12% per year and standard deviation 25%.
NARREND
What is the probability that Amanda will have less than $500,000 in her retirement
account after 30 years?

Half of the job applicants scored below what value?
Both ordinal and nominal variables are categorical.
There are generally two steps in solving an optimization problem, model development
and optimization.
If a sample has 20 observations and a 95% confidence estimate for is needed, the
appropriate value of t-multiple is 2.093

To deseasonalize an observation (assuming a multiplicative model of seasonality),
multiply it by the appropriate seasonal index.
A discrete distribution is useful for many situations, either when the uncertain quantity
is not really continuous (the number of televisions demanded, for example) or when
you want a discrete approximation to a continuous variable.
Correlation is a single-number summary of a scatterplot
In multiple regression, the problem of multicollinearity affects the t-tests of the
individual coefficients as well as the F-test in the analysis of variance for regression,
since the F-test combines these t-tests into a single test.
A probability sample is a sample in which the sampling units are chosen from the
population by means of a random mechanism such as a random number table.
NARRBEGIN: SA_87_90
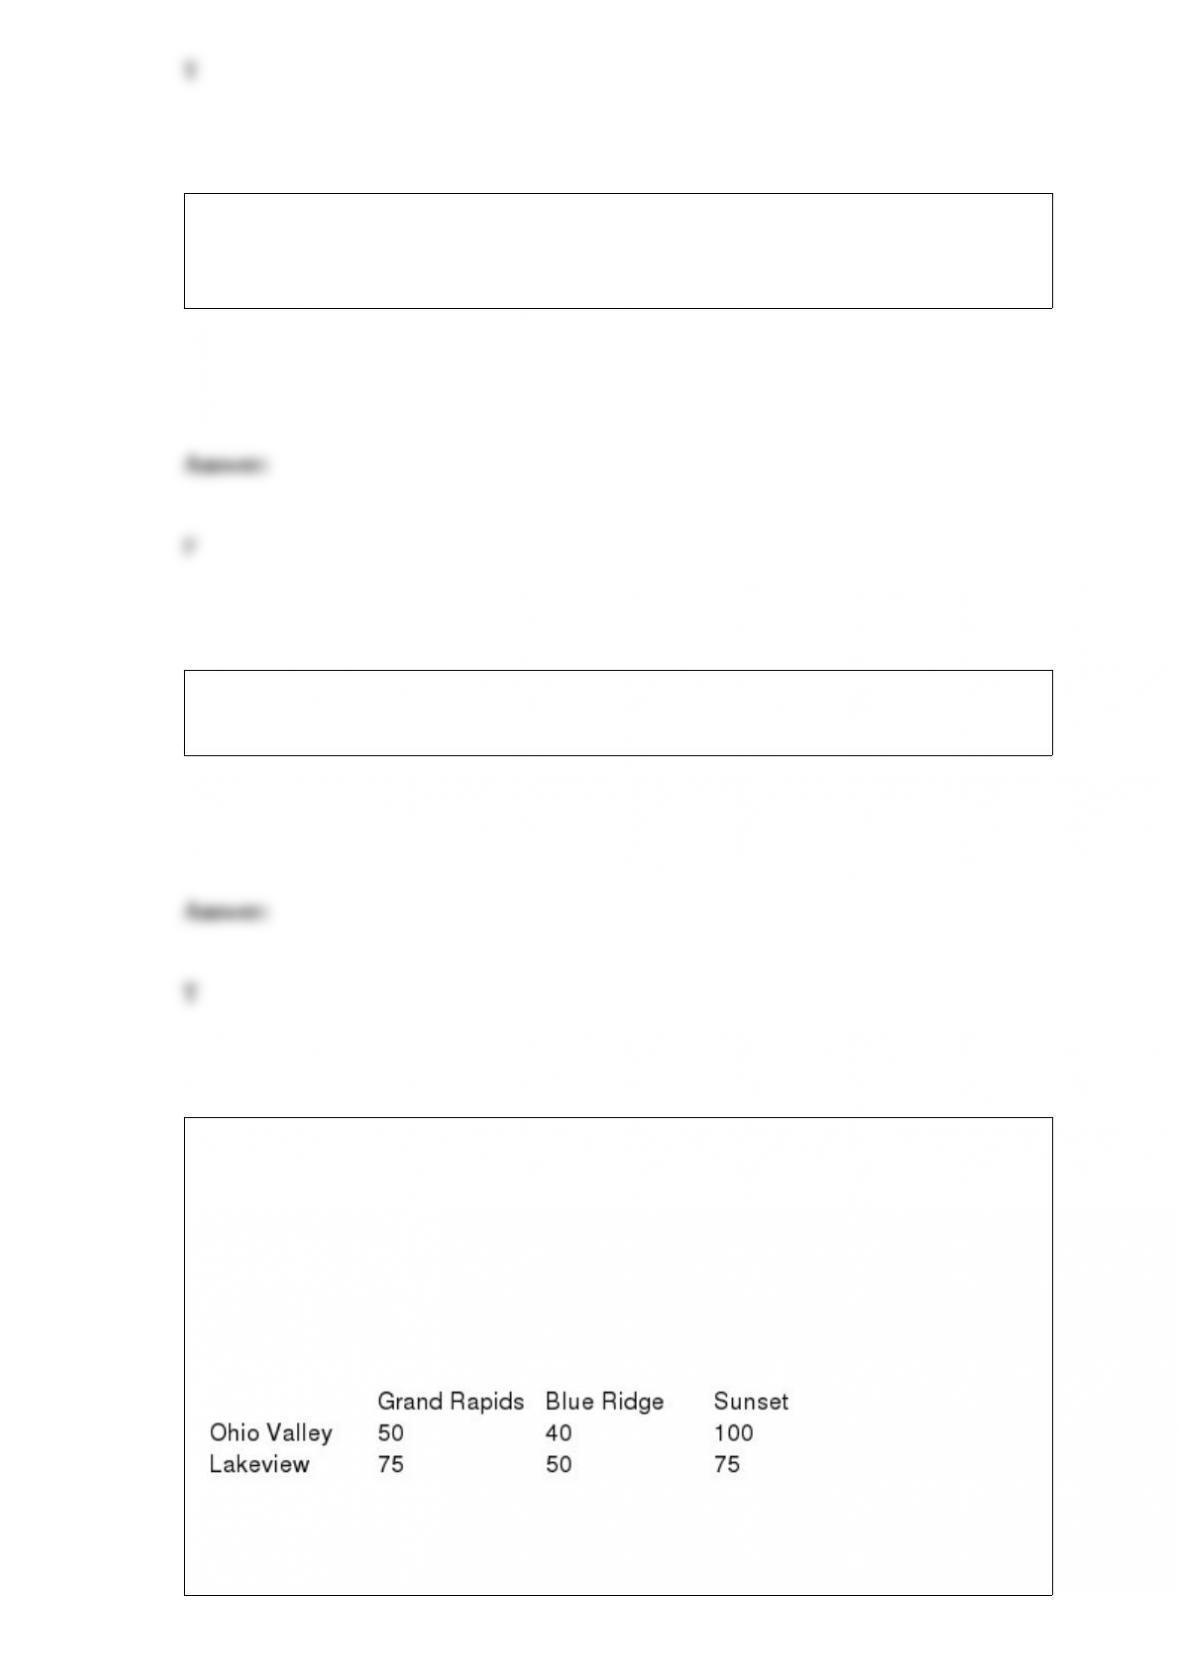
Sinclair Plastics operates two chemical plants which produce polyethylene; the Ohio
Valley plant which produces 5000 tons per month and the Lakeview plant which can
produce 7000 tons per month. Sinclair sells its polyethylene to three different GM auto
plants, Grand Rapids (demand = 3000 tons per month), Blue Ridge (demand = 5000
tons per month), and Sunset (demand = 4000 tons per month). The costs of shipping
between the respective plants is shown in the table below:
NARREND
What are the constraints in this problem?

Approximate the percentage of these Internet users who are in the 58-71 age group.