
Suppose a company sells two different products, x and y, for net profits of $5 per unit
and $10 per unit, respectively. The slope of the line representing the objective function
is:
a. 0.5
b. -0.5
c. 2
d. -2
Suppose there are 500 accounts in a population. You sample 50 of them and find a
sample mean of $500. What would be your estimate for the population total?
a. $5,000
b. $50,000
c. $250,000
d. $500,000
e. None of the above
NARRBEGIN: SA_85_88

The College of Arts and Sciences at a Midwestern university currently has three parking
lots, each containing 160 spaces. Two hundred faculty members have been assigned to
each lot. On a peak day, the probability of a lot 1 parking sticker holder showing up is
73%, a lot 2 parking sticker holders showing up is 75%, and a lot 3 parking sticker
holder showing up is 77%.
NARREND
(A) What are the appropriate probability distributions to model the number of faculty
members showing up in each lot?
(B) Given the current situation, estimate the probability that on a peak day, at least one
faculty member with a sticker will be unable to find a parking space. Assume that the
number who shows up at each lot is independent of the number who shows up at the
other two lots.
(C) Suppose that faculty members are allowed to park in any lot. Does this help solve
the problem? Why or why not?
(D) Suppose that the numbers of faculty who show up at the three lots are correlated,
with each correlation equal to 0.80. Does your answer to (C) change? Why or why not?
The analysis of variance (ANOVA) technique analyzes the variance of the data to
determine whether differences exist between the population means.
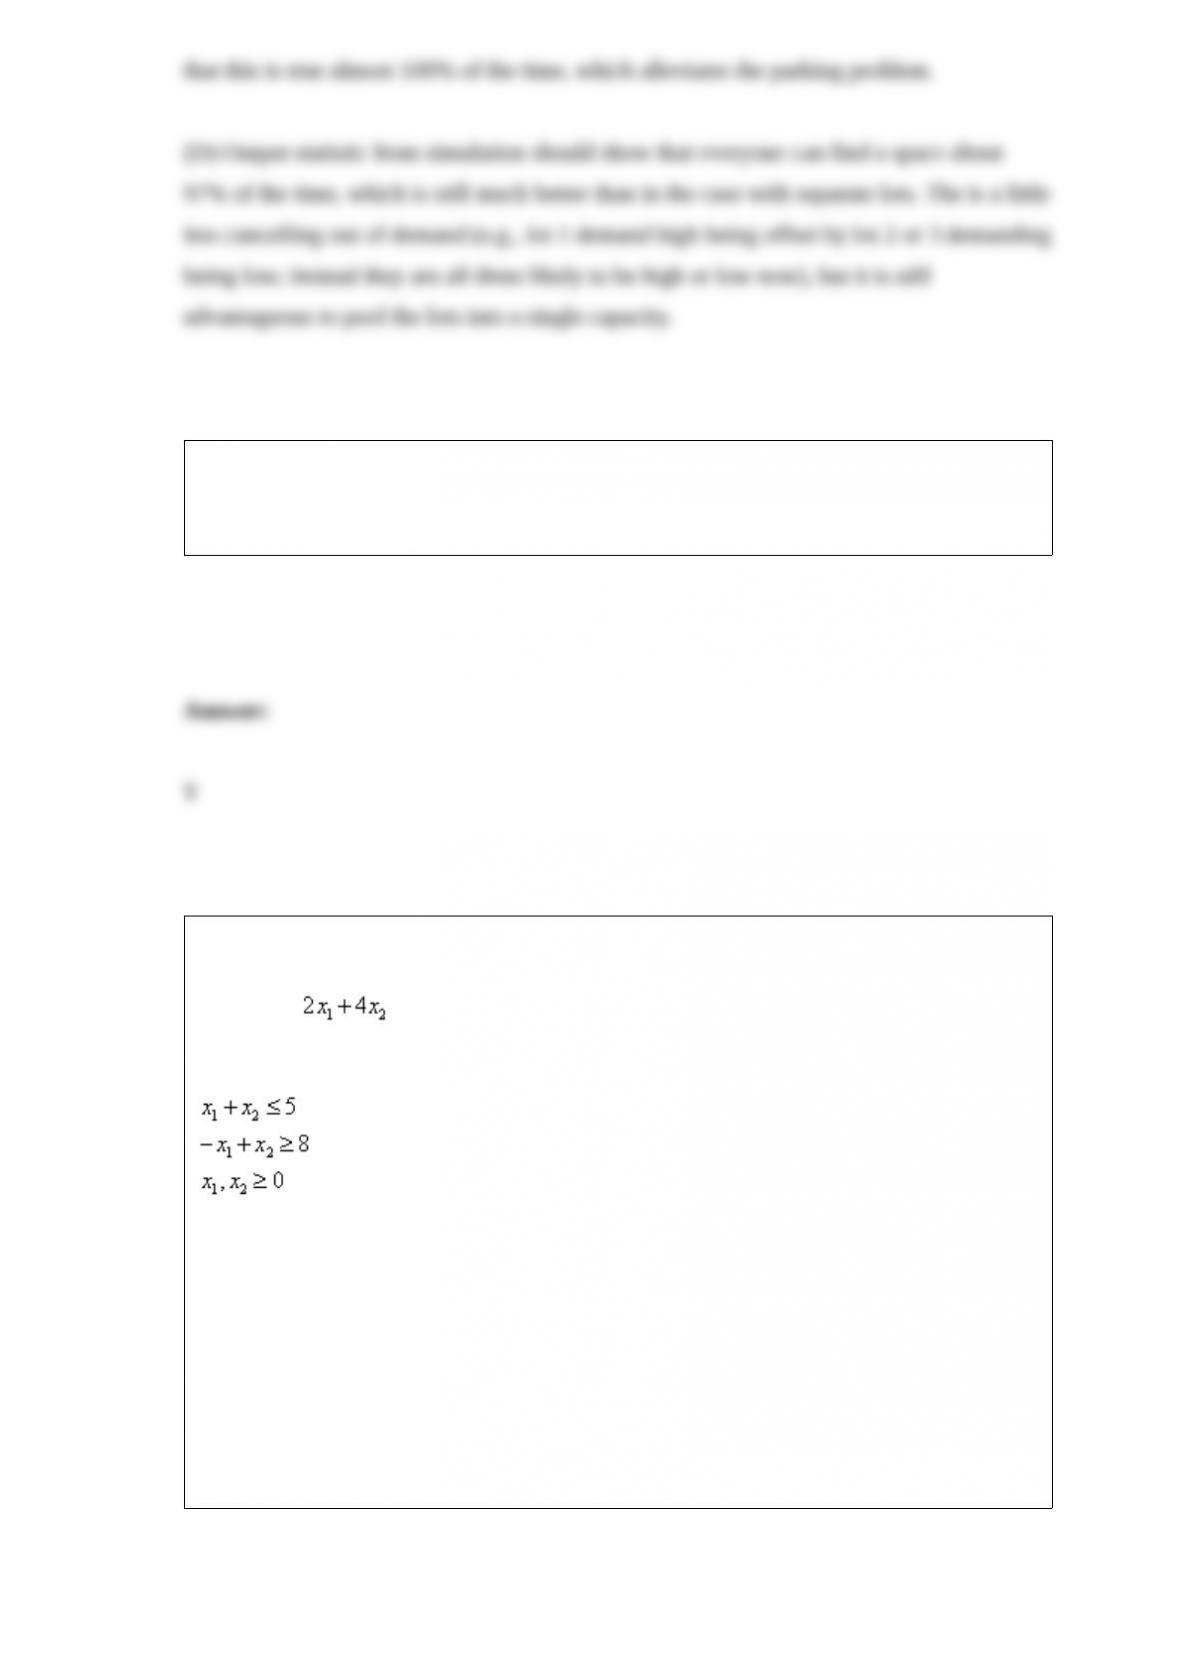
Consider the following linear programming problem:
Maximize
Subject to
The above linear programming problem:
a. has only one optimal solution
b. has more than one optimal solution
c. exhibits infeasibility
d. exhibits unboundedness

Forecasting models can be divided into three groups. They are:
a. time series, optimization, and simulation methods
b. judgmental, extrapolation, and econometric methods
c. judgmental, random, and linear methods
d. linear, non-linear, and extrapolation methods
The percentage of variation ( ) can be interpreted as the fraction (or percent) of
variation of the
a. explanatory variable explained by the independent variable
b. explanatory variable explained by the regression line
c. response variable explained by the regression line
d. error explained by the regression line

Which of the following statements are false?
a. Contingency tables are traditional statistical terms for pivot tables that list counts.
b. Time series plot is a chart showing behavior over time of a time series variable.
c. Pivot table is a table in Excel that summarizes data broken down by one or more
numerical variables.
d. None of these options
NARRBEGIN: SA_60_61
The employee benefits manager of a medium size business would like to estimate the
proportion of full-time employees who prefer adopting plan A of three available health
care plans in the coming annual enrollment period. A reliable frame of the company’s
employees and their tentative health care preferences are available. Using Excel, the
manager chose a random sample of size 50 from the frame. There were 17 employees in
the sample who preferred plan A.
NARREND
(A) Construct a 99% confidence interval for the proportion of company employees who
prefer plan A. Assume that the population consists of the preferences of all employees
in the frame.
(B) Interpret the 99% confidence interval constructed in (A).
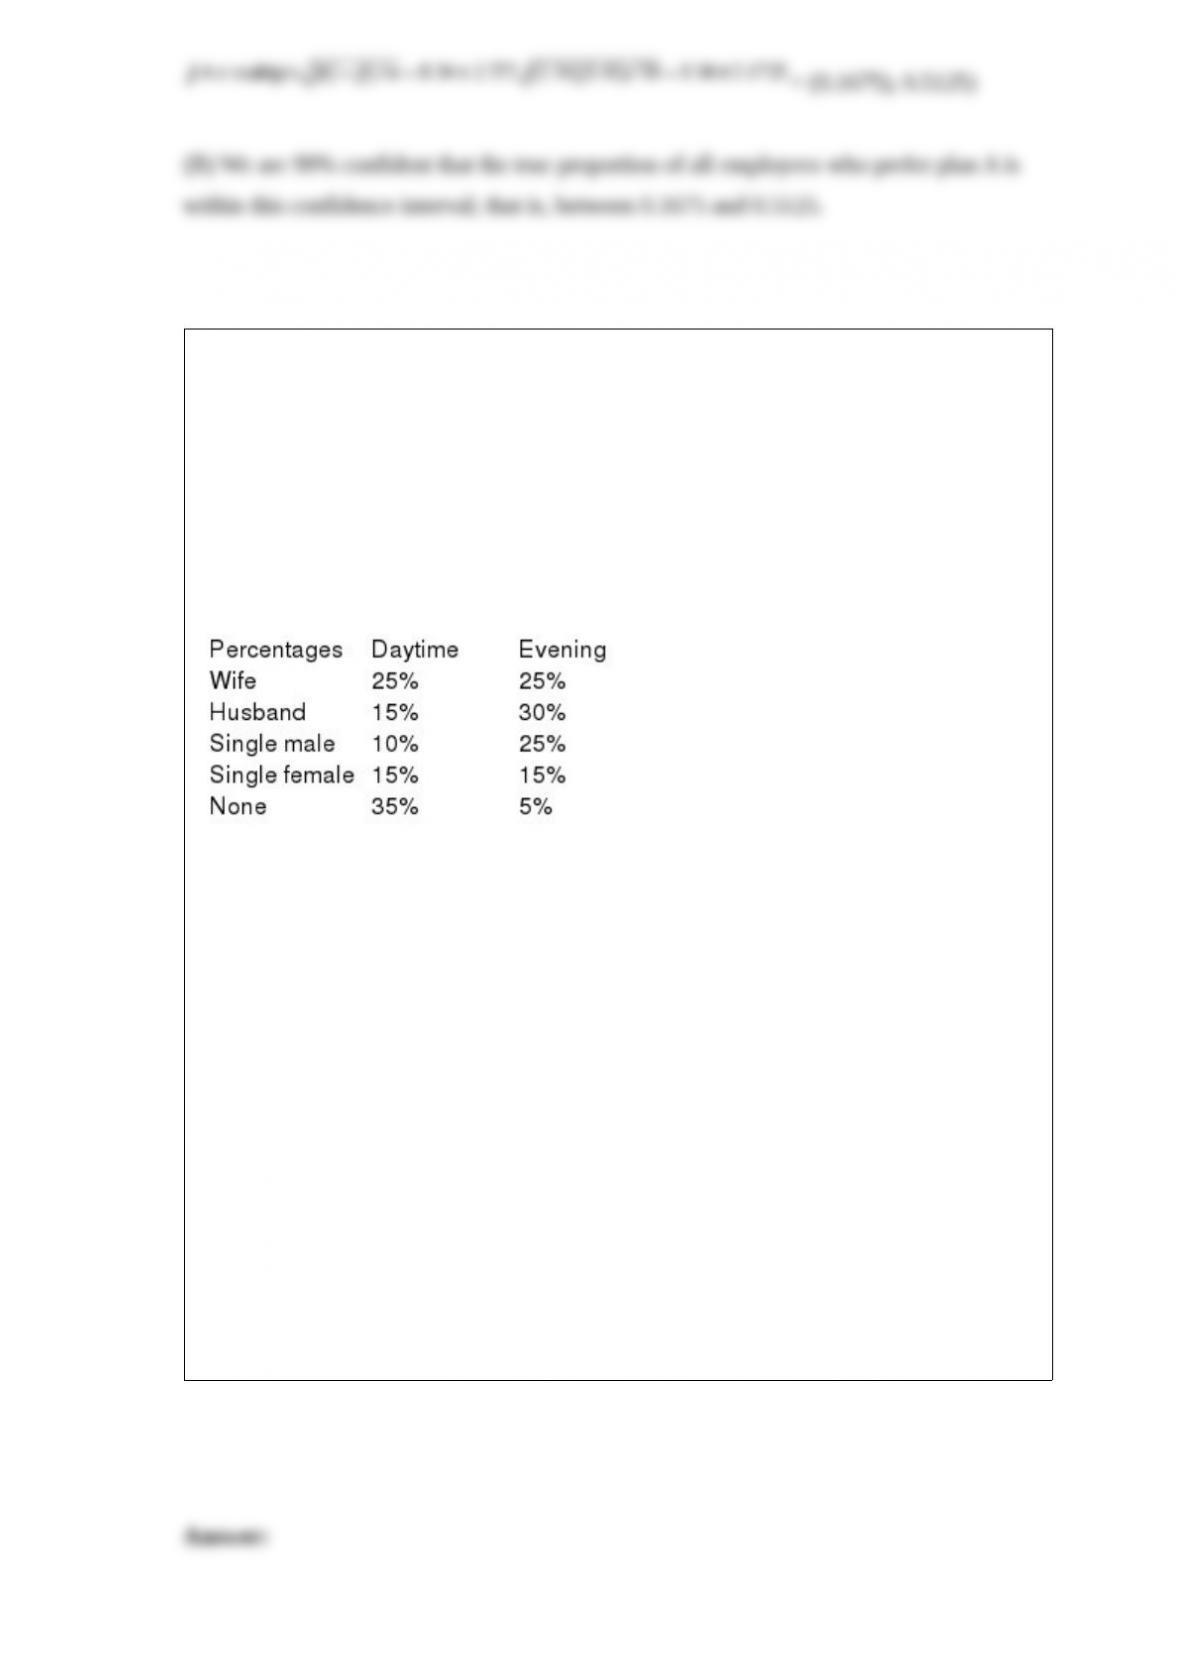
NARRBEGIN: SA_76_82
A marketing research professor is conducting a telephone survey and needs to contact at
least 160 wives, 140 husbands, 110 single adult males, and 120 single adult females. It
costs $2 to make a daytime call and $4 (because of higher labor costs) to make an
evening call. The table shown below lists the expected results. For example, 10% of all
daytime calls are answered by a single male, and 15% of all evening calls are answered
by a single female. Because of a limited staff, at most half of all phone calls can be
evening calls. Determine how to minimize the cost of completing the survey.
NARREND
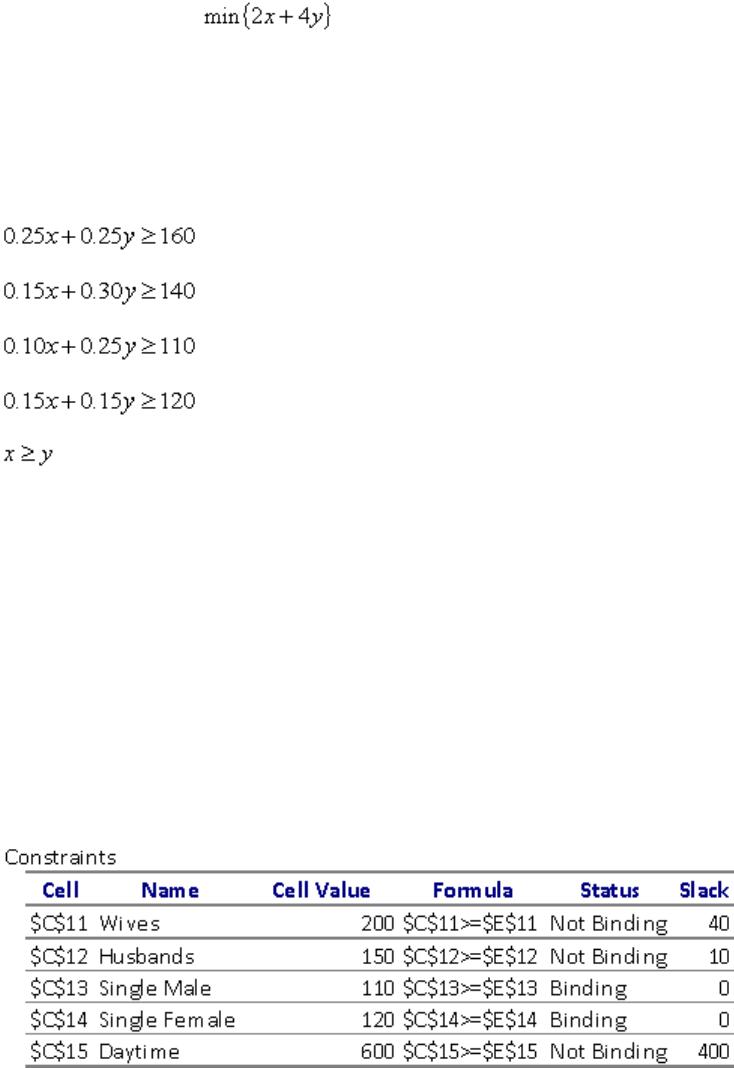
(A) What is the objective function in this problem?
(B) What are the constraints in this problem? Write an algebraic expression for each.
(C) Find an optimal solution to the problem using the formulation given in (A) and (B).
What is the call plan, and what is the total cost?
(D) Implement the model in (C) in Excel Solver and obtain an answer report. Which
constraints are binding on the optimal solution?
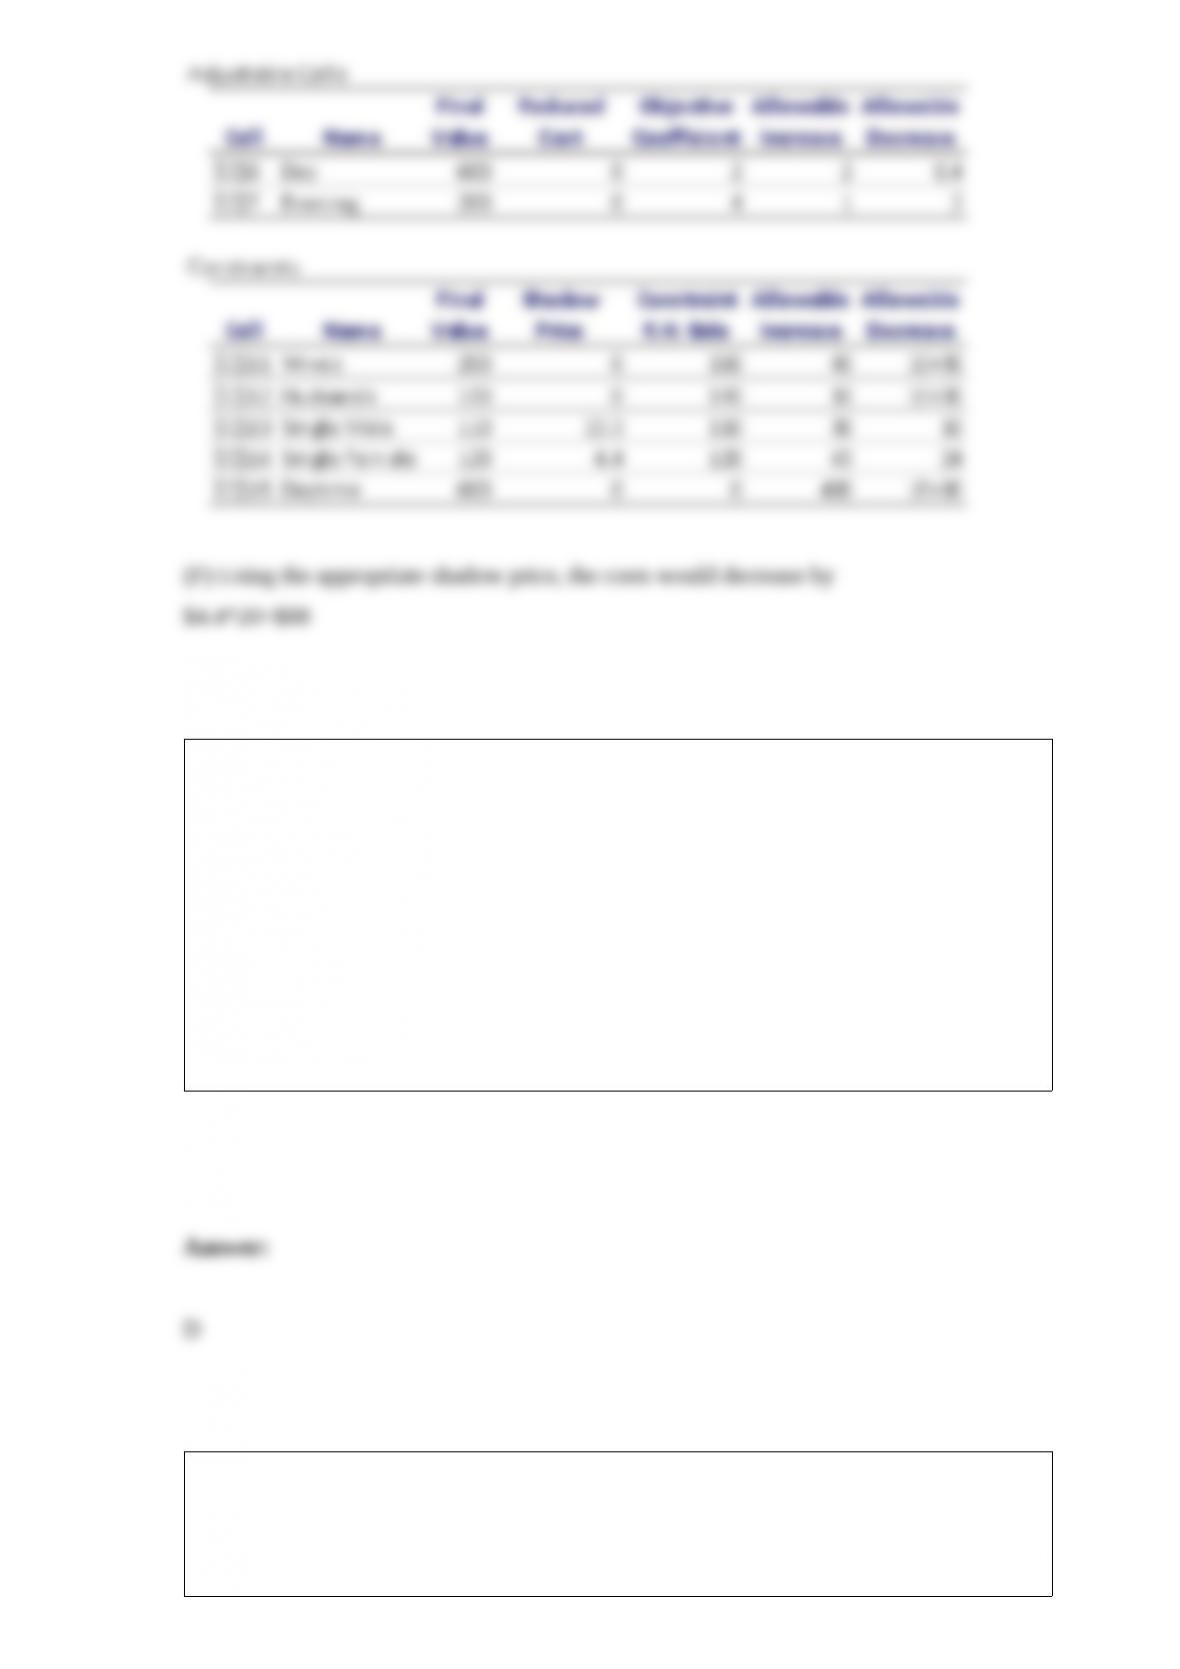
(E) Obtain a sensitivity report for the model in (D). If the professor could cut the cost of
evening calls from $4 to $3, what would the new calling plan be?
(F) Again using the sensitivity report obtained for (E), suppose the professor could get
by with just 100 calls for single females. What would the call costs be in that case?
Explain your answer.
The main issue in marketing and sales models is:
a. the amount invested in marketing
b. the timing of marketing
c. the profit from sales
d. the timing of sales
e. the tradeoff between marketing and sales
Cash balance models are an example of which of the following types of simulation
application?
a. Operations models

b. Financial models
c. Marketing models
d. Games of chance
e. None of these options
Time series data often exhibits which of the following characteristics?
a. homoscedasticity
b. heteroscedasticity
c. autocorrelation
d. multicollinearity
The optimal solution to any linear programming model is:
a. the maximum objective function line
b. the minimum objective function line
c. the corner point of a polygon

d. the maximum or minimum of a parabola
In a random series, successive observations are probabilistically independent of one
another. If this property is violated, the observations are said to be:
a. autocorrelated
b. intercorrelated
c. causal
d. seasonal
In aggregate planning models, which of the following statements are correct?
a. The number of workers available influences the possible production levels
b. We allow the workforce level to be modified each month through the hiring and
firing of workers
c. We eventually allow demand to be backlogged; that is, demand need not be met on
time
d. All of these options

The deterministic (non-simulation) approach, using best guesses for the uncertain
inputs, is:
a. better to use in complicated real world applications.
b. a good estimate of what the answer will be using a simulation approach.
c. generally not the appropriate model.
d. the preferred approach when there is correlation between input variables.
In formulating a transportation problem as linear programming model, which of the
following statements are correct?
a. There is one constraint for each supply location
b. There is one constraint for each demand location
c. The sum of decision variables out of a supply location is constrained by the supply at
that location
d. The sum of decision variables out of all supply locations to a specific demand
location is constrained by the demand at that location
e. All of these options
NARRBEGIN: SA_103_105
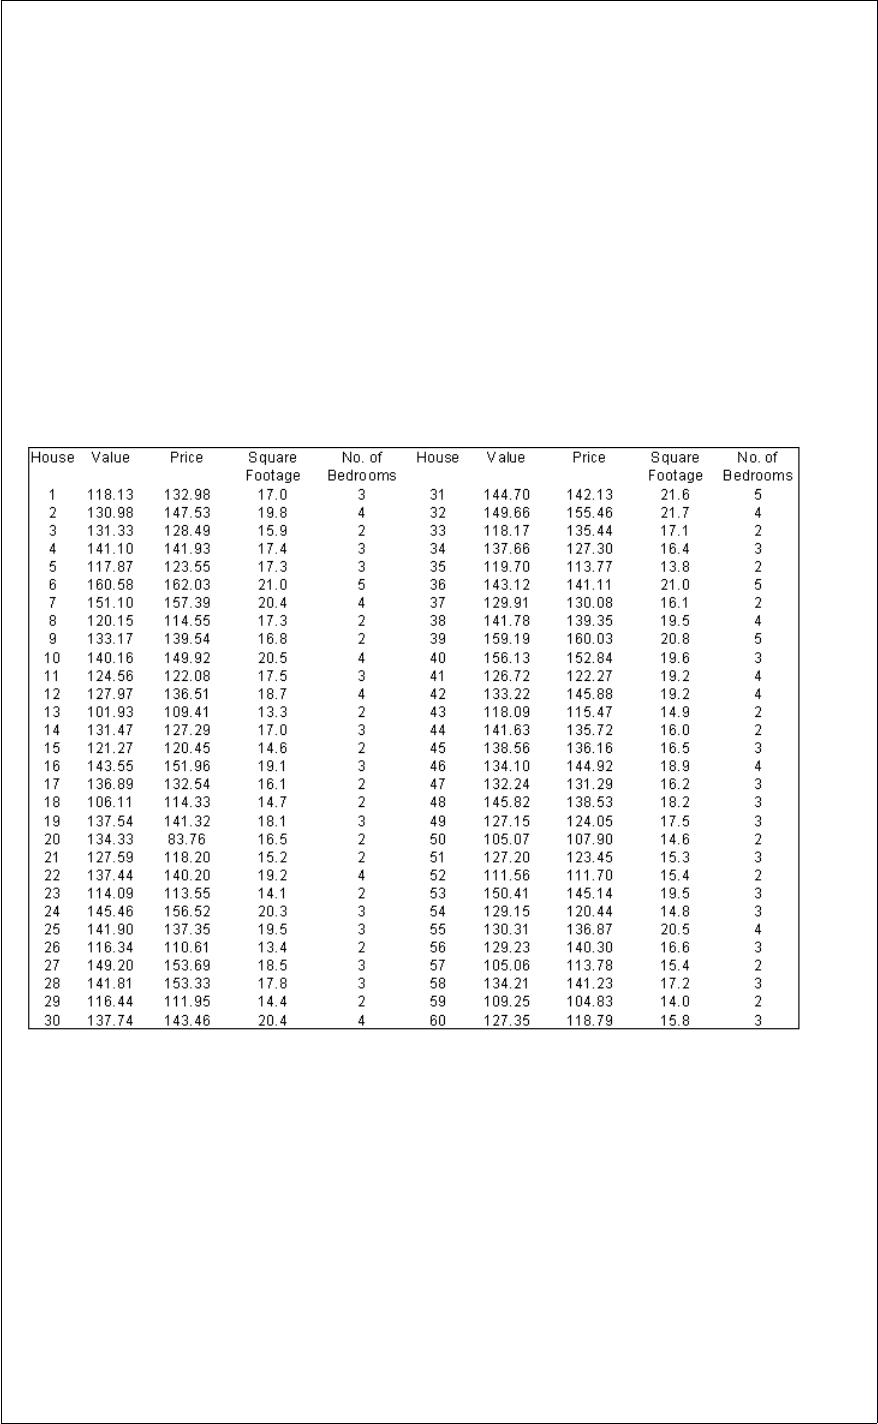
Sally Bird of Big Rapids Realty has received data on 60 houses that were recently sold
in Mecosta County in Michigan. The data are recorded in the table shown below.
Included in this data set are observations for each of the following variables:
The appraised value of each house (in thousands of dollars)
The selling price of each house (in thousands of dollars)
The size of each house (in hundreds of square feet)
The number of bedrooms in each house
NARREND
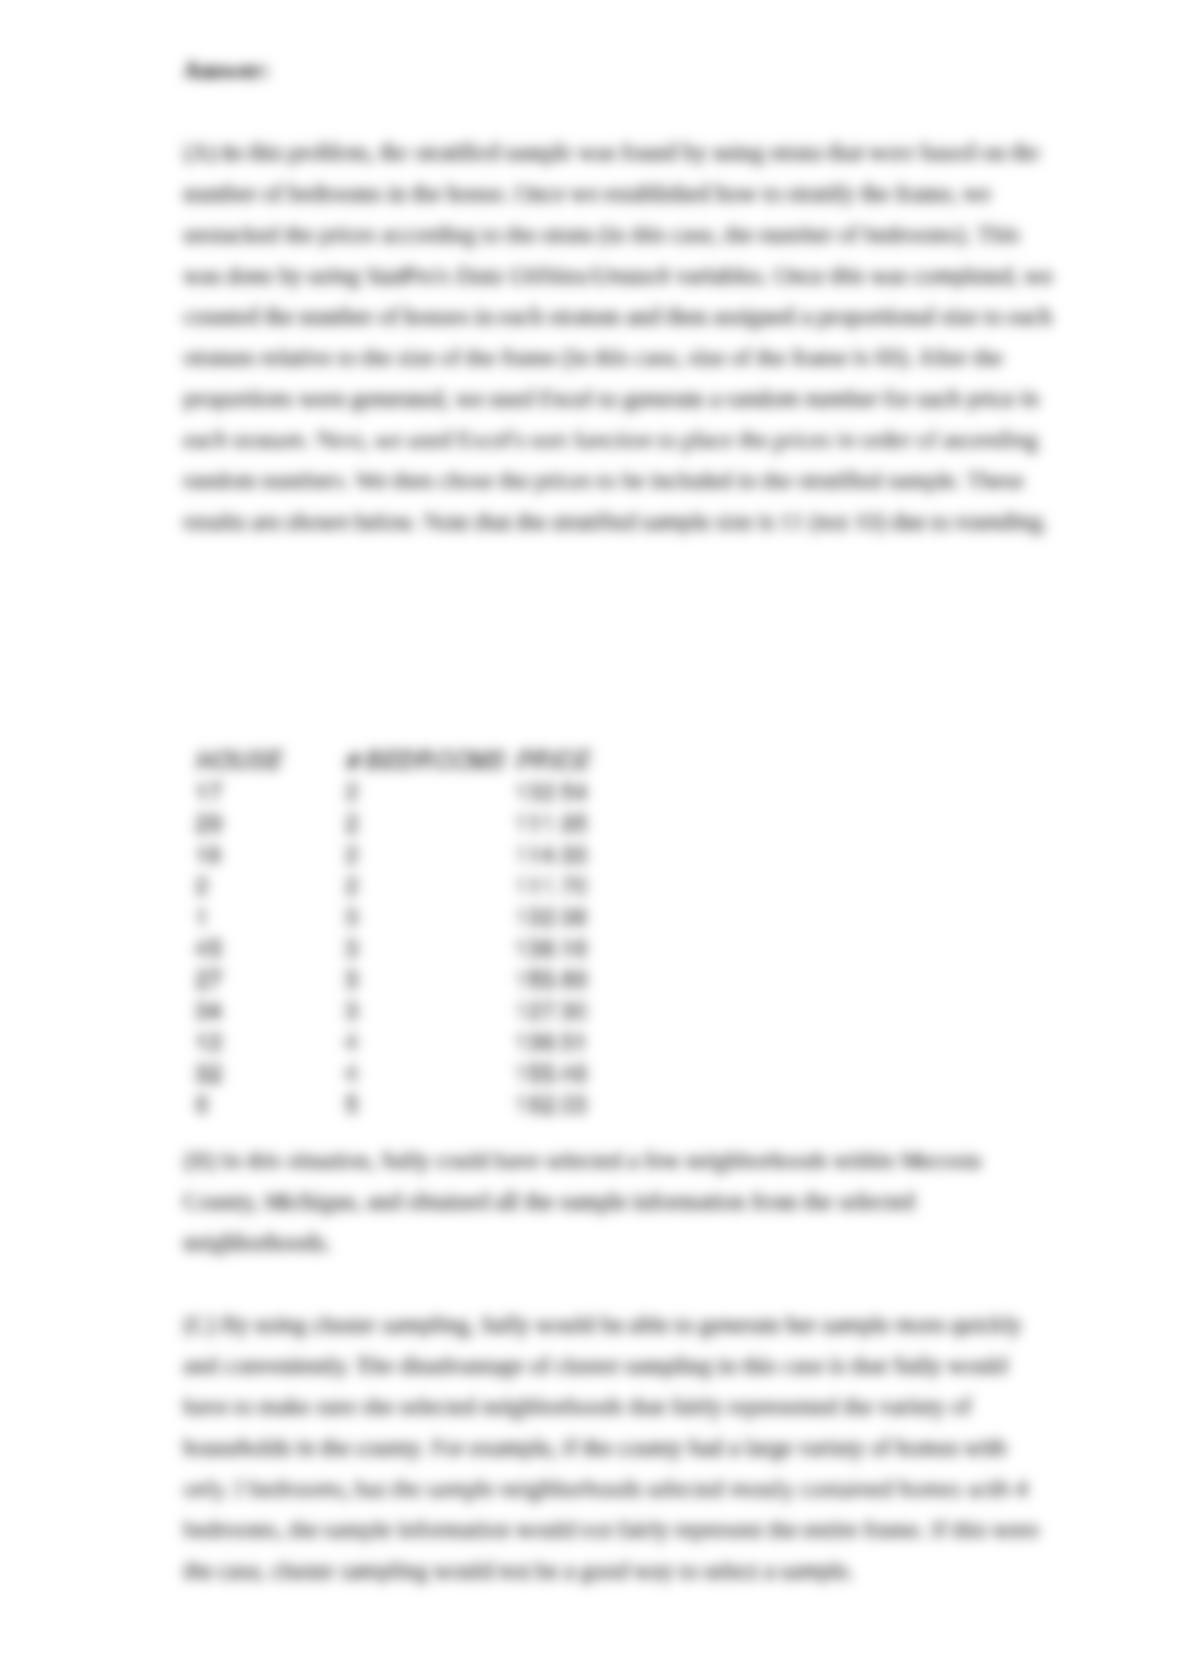
(A) Suppose that Sally wishes to examine a representative subset of these 60 houses
that has been stratified by the number of bedrooms. Use Excel to assist her by finding
such a stratified sample of size 10 with proportional sample sizes.
(B) Explain how Sally could apply cluster sampling in selecting a sample of size 15
from this frame.
(C) What are the advantages and disadvantages of employing cluster sampling in this
case?

When using exponential smoothing, if you want the forecast to react quickly to
movements in the series, you should choose:
a. values of near 1
b. values of near 0
c. values of midway between 0 and 1
d. it depends on the data set
Which of the following would be considered a definition of an outlier?
a. An extreme value for one or more variables
b. A value whose residual is abnormally large in magnitude
c. Values for individual explanatory variables that fall outside the general pattern of the
other observations
d. All of these options
The approximate standard error of the sample mean is calculated as:

a.
b.
c.
d.
As the sample size increases, the t-distribution becomes more similar to the ________
distribution.
a. normal
b. exponential
c. multinominal
d. chi-square
e. binomial
Bidding for contracts is an example of which of the following types of simulation
model application?
a. Operations models

b. Financial models
c. Marketing models
d. Games of chance
e. None of these options
Which of the following is not a consideration when determining appropriate sample
size?
a. The cost of sampling
b. The timely collection of the data
c. Interviewer fatigue
d. The likelihood of nonsampling error
Which pair of the following tests is used to test for normality?
a. A t-test and an ANOVA test
b. An Empirical cumulative distribution function test and an F-test
c. A Chi-Square test and a Lilliefors test

d. A Quantile-Quantile plot and a p-value test
Numerical variables can be subdivided into which two types?
a. Diverse and categorical
b. Discrete and continuous
c. Nominal and progressive
d. Cross-sectional and discrete
Related to the runs test, if you use a Z-statistic and you get a Z value greater than 2.0,
this means that there is evidence of in the series
a. randomness
b. nonrandomness
c. nonnormality
d. heteroscedasticity

If two events are independent, what is the probability that they both occur?
a. 0
b. 0.50
c. 1.00
d. Cannot be determined from the information given
The test statistic in an ANOVA analysis is:
a. the t-statistic
b. the z-statistic
c. the F-statistic
d. the Chi-square statistic

You are trying to estimate the average amount a family spends on food during a year. In
the past, the standard deviation of the amount a family has spent on food during a year
has been approximately $1200. If you want to be 99% sure that you have estimated
average family food expenditures within $60, how many families do you need to
survey?
Cross-sectional data are data on a population at a distinct point in time, whereas time
series data are data collected across time.
NARRBEGIN: SA_121_124
A continuous random variable X has the probability density function: f(x) = 2 , 0
NARREND What is the probability that X is at most 2?
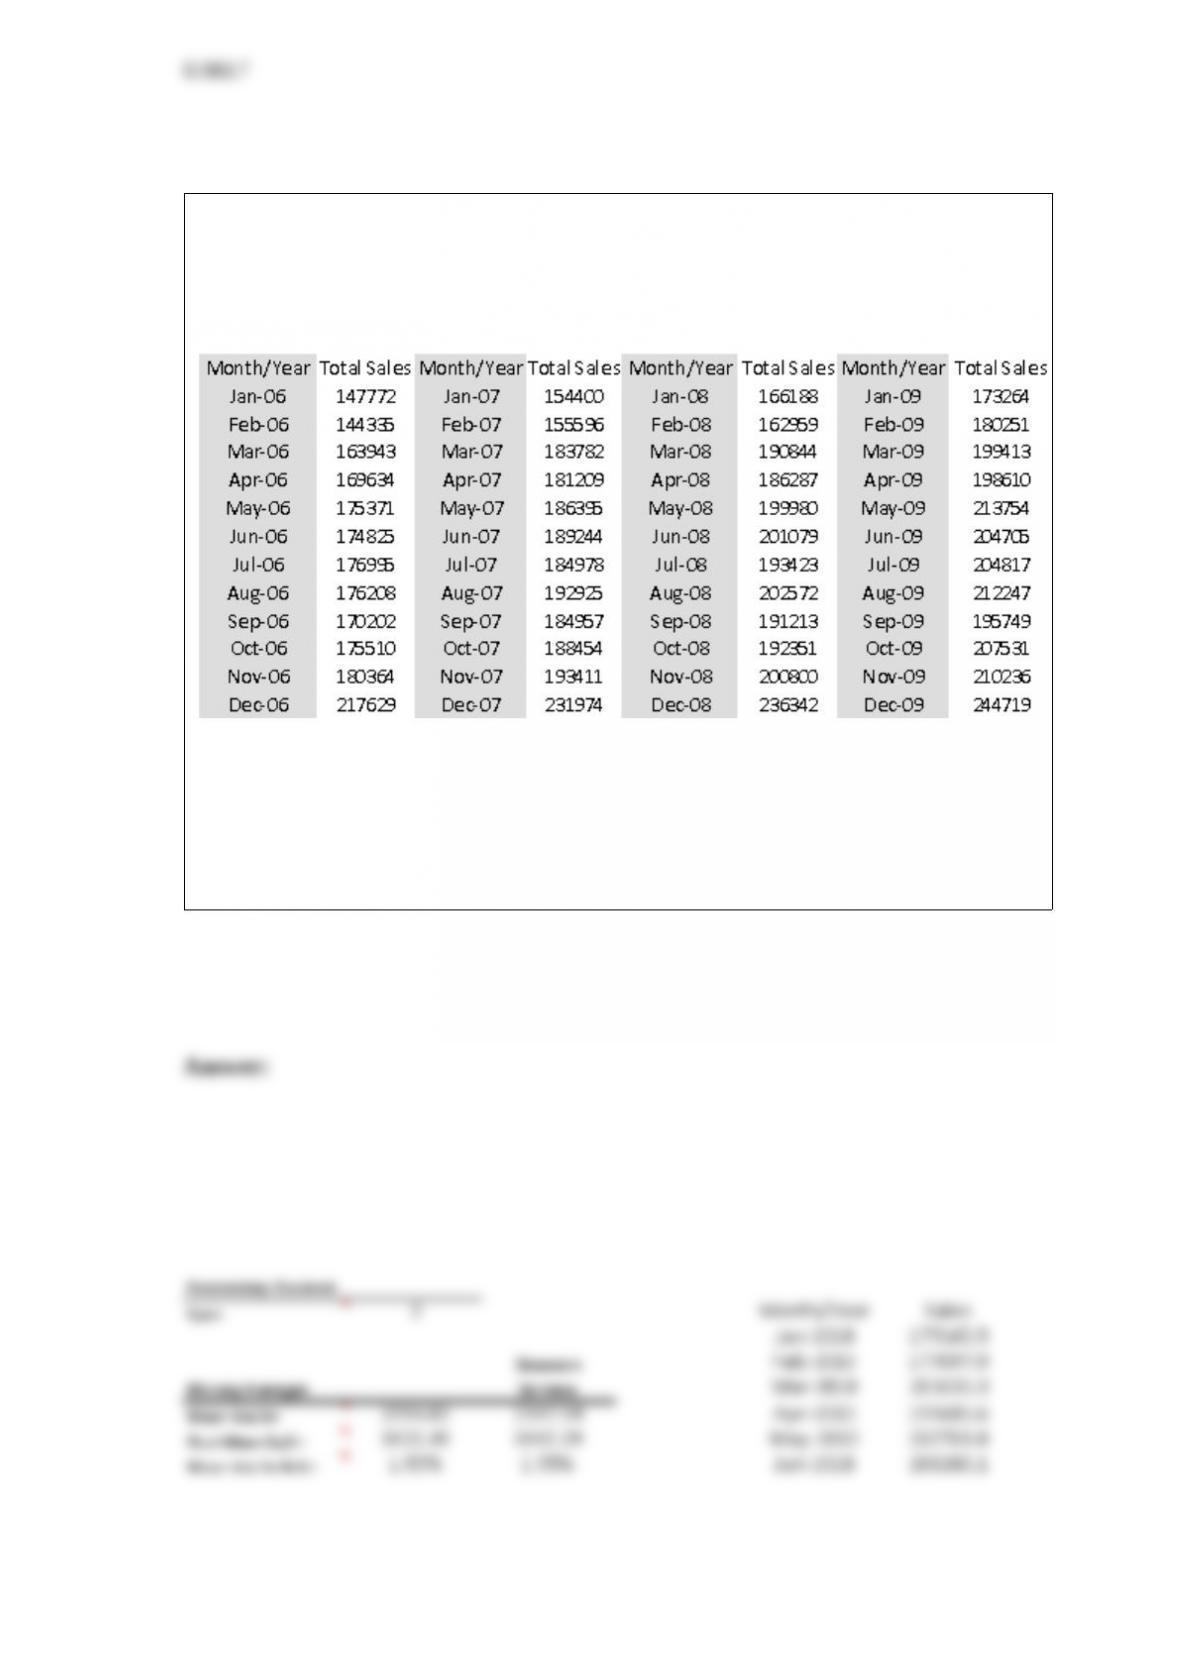
NARRBEGIN: SA_84_87
The data shown below contains total monthly retail sales (in dollars) a small sporting
goods store for the years 2006-2008.
NARREND
Use the method of moving averages with an appropriate span to forecast retail sales for
the first half of 2009. Do you obtain a good fit? Do you have confidence in your
forecast? Explain your answers.
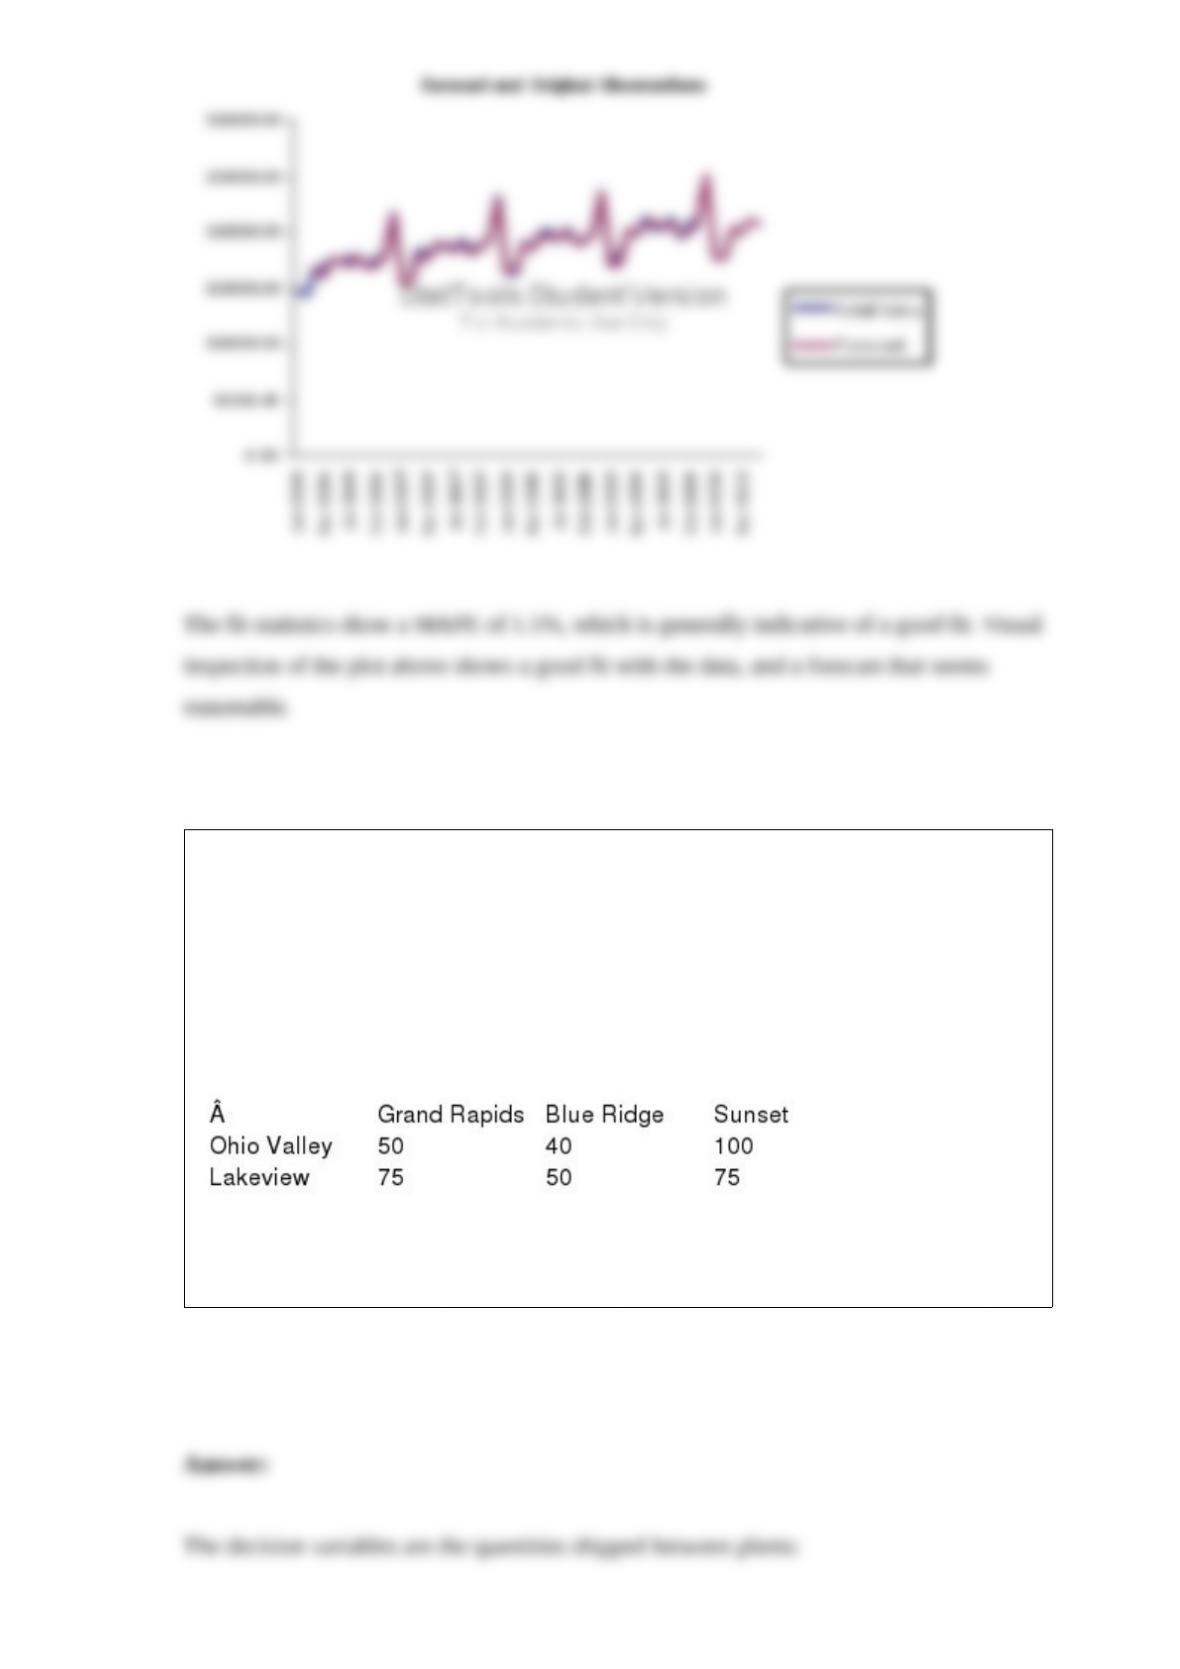
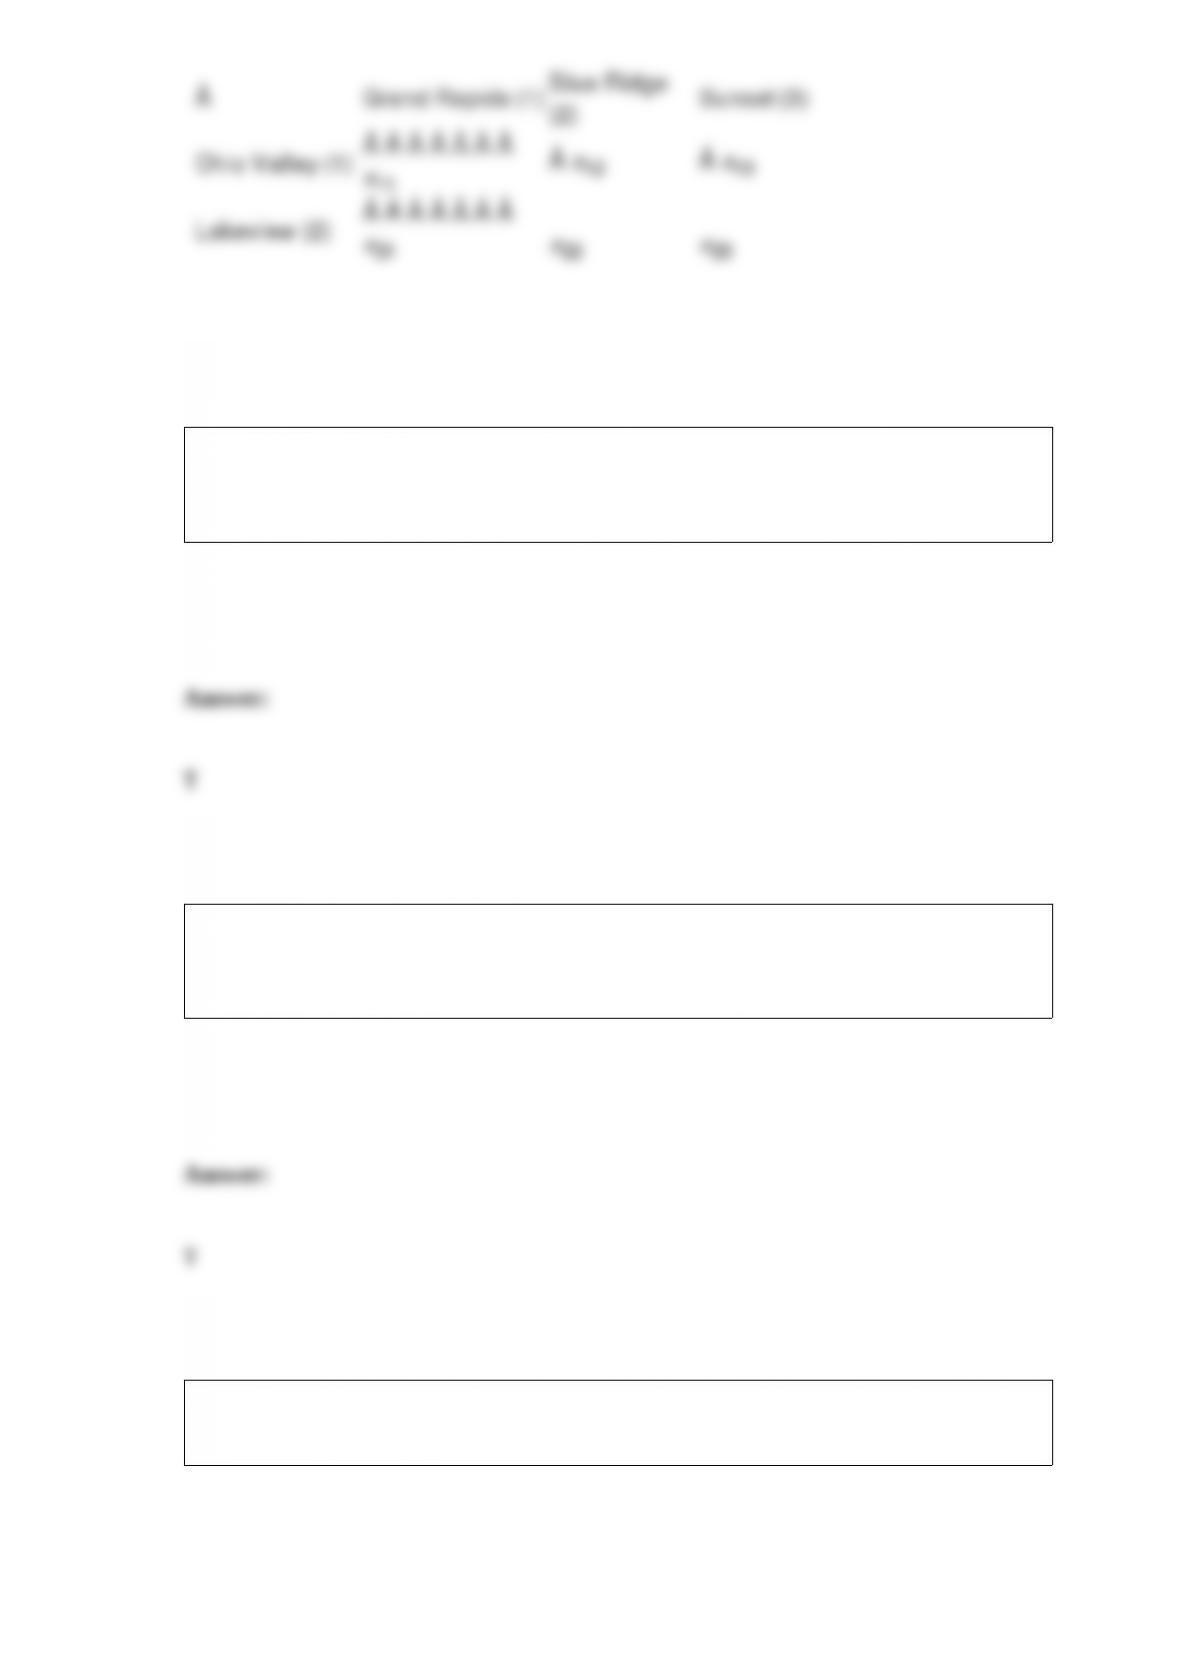
NARRBEGIN: SA_87_90
Sinclair Plastics operates two chemical plants which produce polyethylene; the Ohio
Valley plant which produces 5000 tons per month and the Lakeview plant which can
produce 7000 tons per month. Sinclair sells its polyethylene to three different GM auto
plants, Grand Rapids (demand = 3000 tons per month), Blue Ridge (demand = 5000
tons per month), and Sunset (demand = 4000 tons per month). The costs of shipping
between the respective plants is shown in the table below:
NARREND
What are the decision variables in this problem?
For a given probability of success p that is not too close to 0 or 1, the binomial
distribution tends to take on more of a symmetric bell shape as the number of trials n
increases.
The most common form of autocorrelation is positive autocorrelation, where large
observations tend to follow large observations and small observations tend to follow
small observations.
The binomial distribution is a continuous distribution that is not far behind the normal
distribution in order of importance.

Bayes’ is useful in determining the value of perfect information (EVPI).
NARRBEGIN: SA_107_111
Suppose that the number of customers arriving each hour at the only checkout counter
at a local convenience store is approximately Poisson distributed with an expected
arrival rate of 30 customers per hour. Let X represent the number of customers arriving
per hour. The probabilities associated with X are shown below.
P(X < 5) = 0.0000, P(X < 10) = 0.0000, P(X < 15) = 0.0009,
P(X < 20) = 0.0219, P(X < 25) = 0.1572, P(X < 30) = 0.4757
P(X = 30) = 0.0726, P(X = 31) = 0.0703, P(X = 32) = 0.0659,
P(X = 33) = 0.0599, P(X = 34) = 0.0529, P(X = 35) = 0.0453
NARREND
What is the probability that fewer than 33 customers arrive at this checkout counter in a
given hour?
An operations management professor is interested in how her students performed on her
midterm exam. The histogram shown below represents the distribution of exam scores
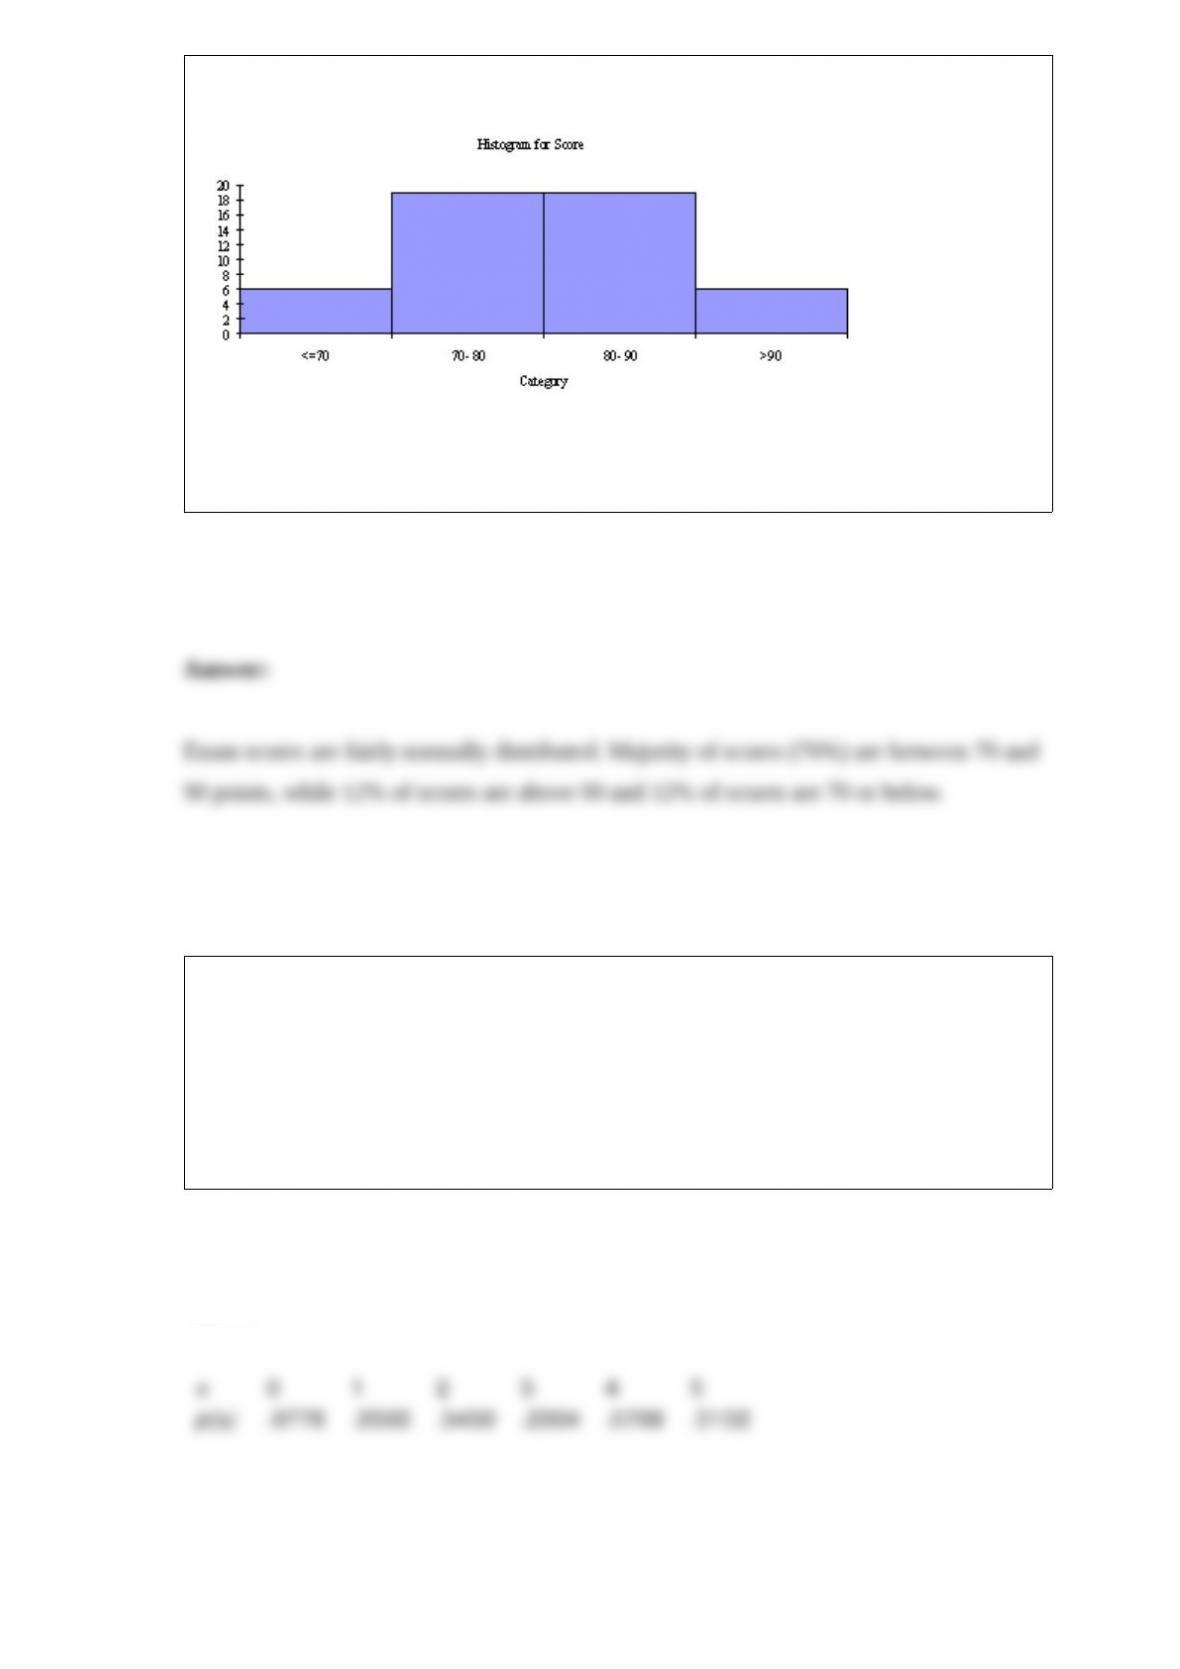
(where the maximum score is 100) for 50 students.
Based on this histogram, how would you characterize the students’ performance on this
exam?
NARRBEGIN: SA_91_94
Consider a binomial random variable X withn = 5andp = 0.40.
NARREND
Find the probability distribution of X.

NARRBEGIN: SA_95_97
A financial analyst collected useful information for 30 employees at Gamma
Technologies, Inc. These data include each selected employees gender, age, number of
years of relevant work experience prior to employment at Gamma, number of years of
employment at Gamma, the number of years of post-secondary education, and annual
salary.
NARREND
Indicate the type of data for each of the six variables included in this set.
If a scatterplot of residuals shows a parabola shape, then a logarithmic transformation
may be useful in obtaining a better fit

NARRBEGIN: SA_78_85
Suppose we want to choose capacity for a plant that will produce a new drug. In
particular, we want to choose the capacity that maximizes discounted expected profit
over the next 10 years. We have the following information:
Demand for the drug is expected to be normally distributed ~ Normal (50,000, 12,000).
A unit of capacity costs $16 to build.
The number of units produced will equal the demand, up to capacity limits.
The revenue per unit is $3.70 and the cost per unit is $0.20 (variable cost).
The maintenance cost per unit of capacity is $0.40 (fixed cost).
The discount rate is 10%.
NARREND
Which simulation yields the largest median NPV?
NARRBEGIN: SA_86_91
In this example we are estimating the net present value of introducing a new drug to
market. We have the following information about the market:
The market size is 1,000,000 and is projected to grow at an average 5%, with a standard
deviation of 1%, over the next ten years.
The market share captured at entry is projected to be between 20% and 70%, with most
likely value 40%.
Three competitors may enter the market in the future, with each one having a 40%
probability of entry per year.
For each new competitor per year, the market share goes down by 20%.
The marginal profit per unit is $1.80.
We want to evaluate the project over ten years, using a discount rate of 10%.
NARREND
Develop an @Risk model to estimate the NPV given an assumed capacity. What are the
variable inputs and outputs?
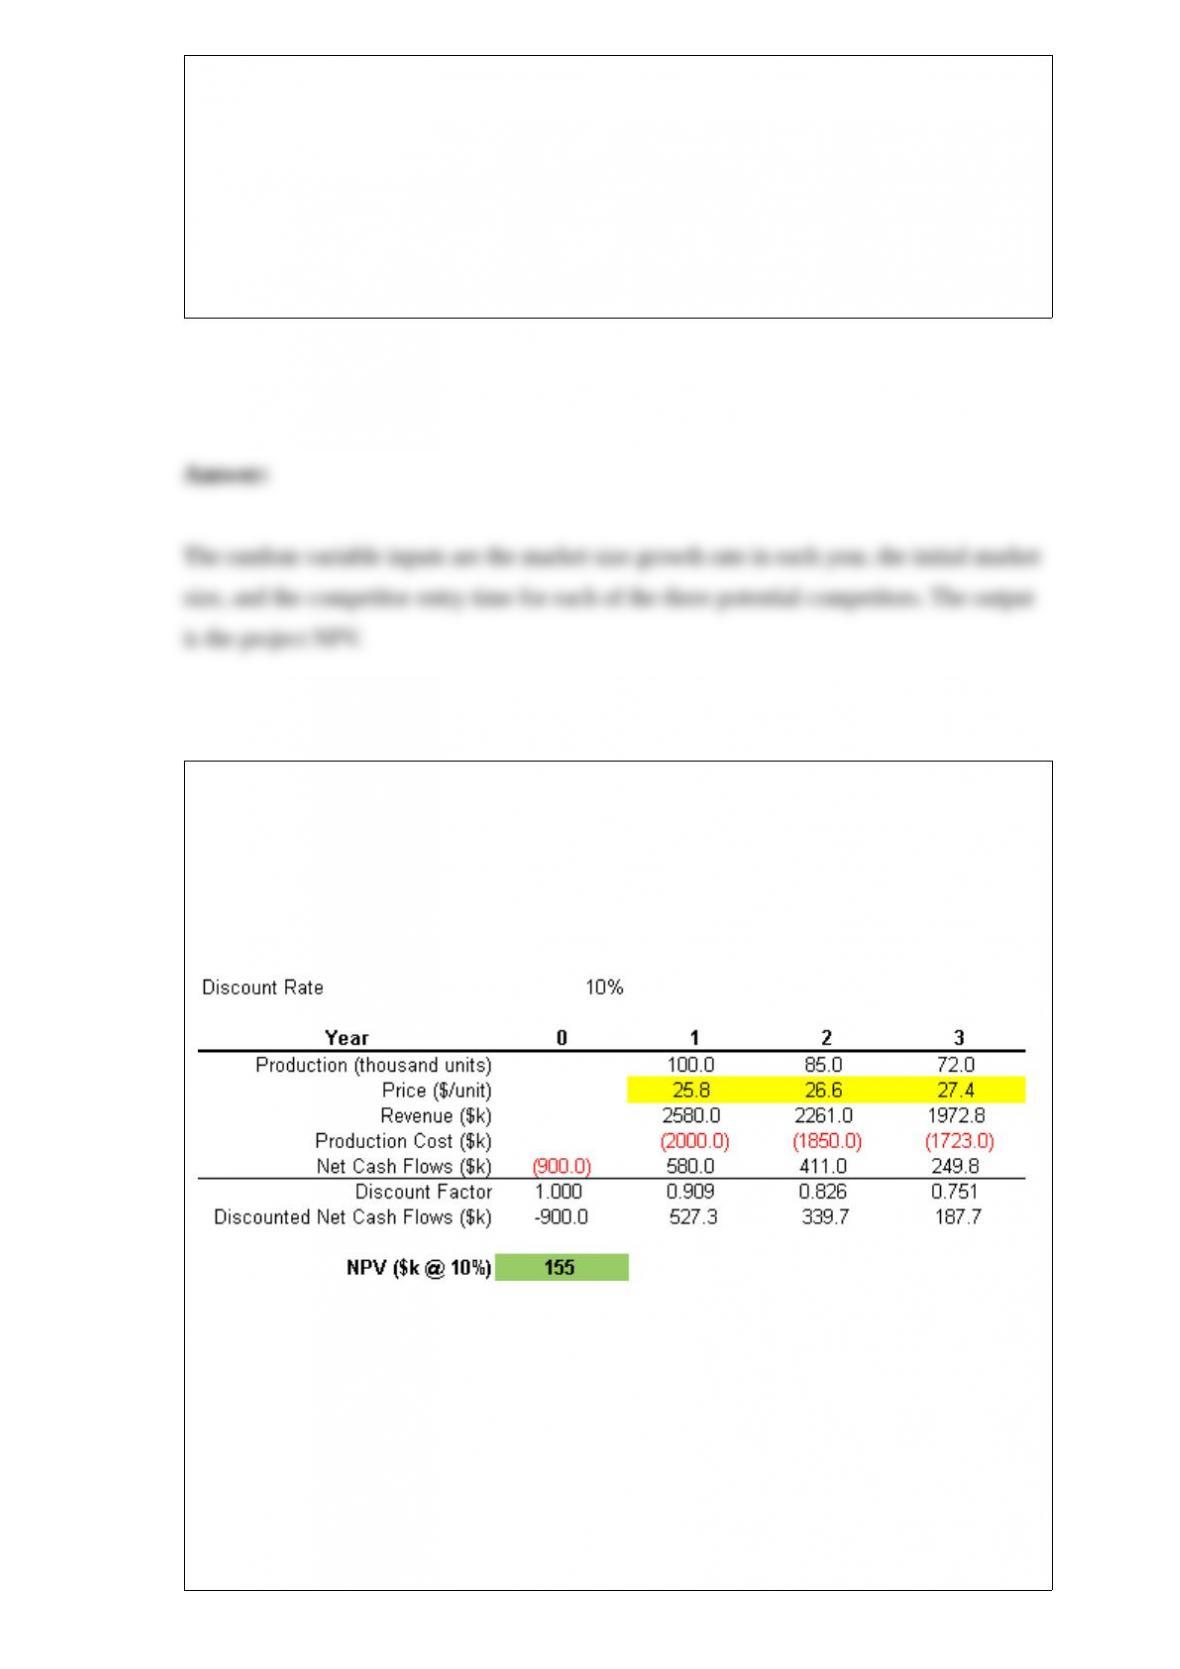
NARRBEGIN: SA_51_56
A firm is considering investing $0.9M in a typical industrial manufacturing application
with a three year production planning cycle under a forecasted market price
environment. A simple three-period project pro forma cash flow sheet for this project is
shown below:
In the pro forma, the production and price forecast in each period translate to revenue,
which can then be netted of production costs to arrive at the expected cash flow in each
period. The cash flows are then be discounted at a rate that is commensurate with the
riskiness of the project (here, assumed to be 10%).
NARREND
The Net Present Value (NPV) is the sum of the discounted cash flows. What is the NPV
of the project, including the required investment?

If A and B are two independent events with P(A) = 0.20 and P(B) = 0.60, then P(A and
B) = 0.80