
In a multistage decision problem, decisions and outcomes alternate. That is, a decision
maker makes a decision, then some uncertainty is resolved, then the decision maker
makes a second decision, then some further uncertainty is resolved, and so on.
NARRBEGIN: SA_104_113
Suppose that patrons of a restaurant were asked whether they preferred beer or whether
they preferred wine. 60% said that they preferred beer. 70% of the patrons were male.
80% of the males preferred beer.
NARREND
Suppose a randomly selected patron is a female. What is the probability that the patron
prefers wine?
Counts for categorical variable are often expressed as percentages of the total.
The advantage that the coefficient of correlation has over the covariance is that the
former has a set lower and upper limit.
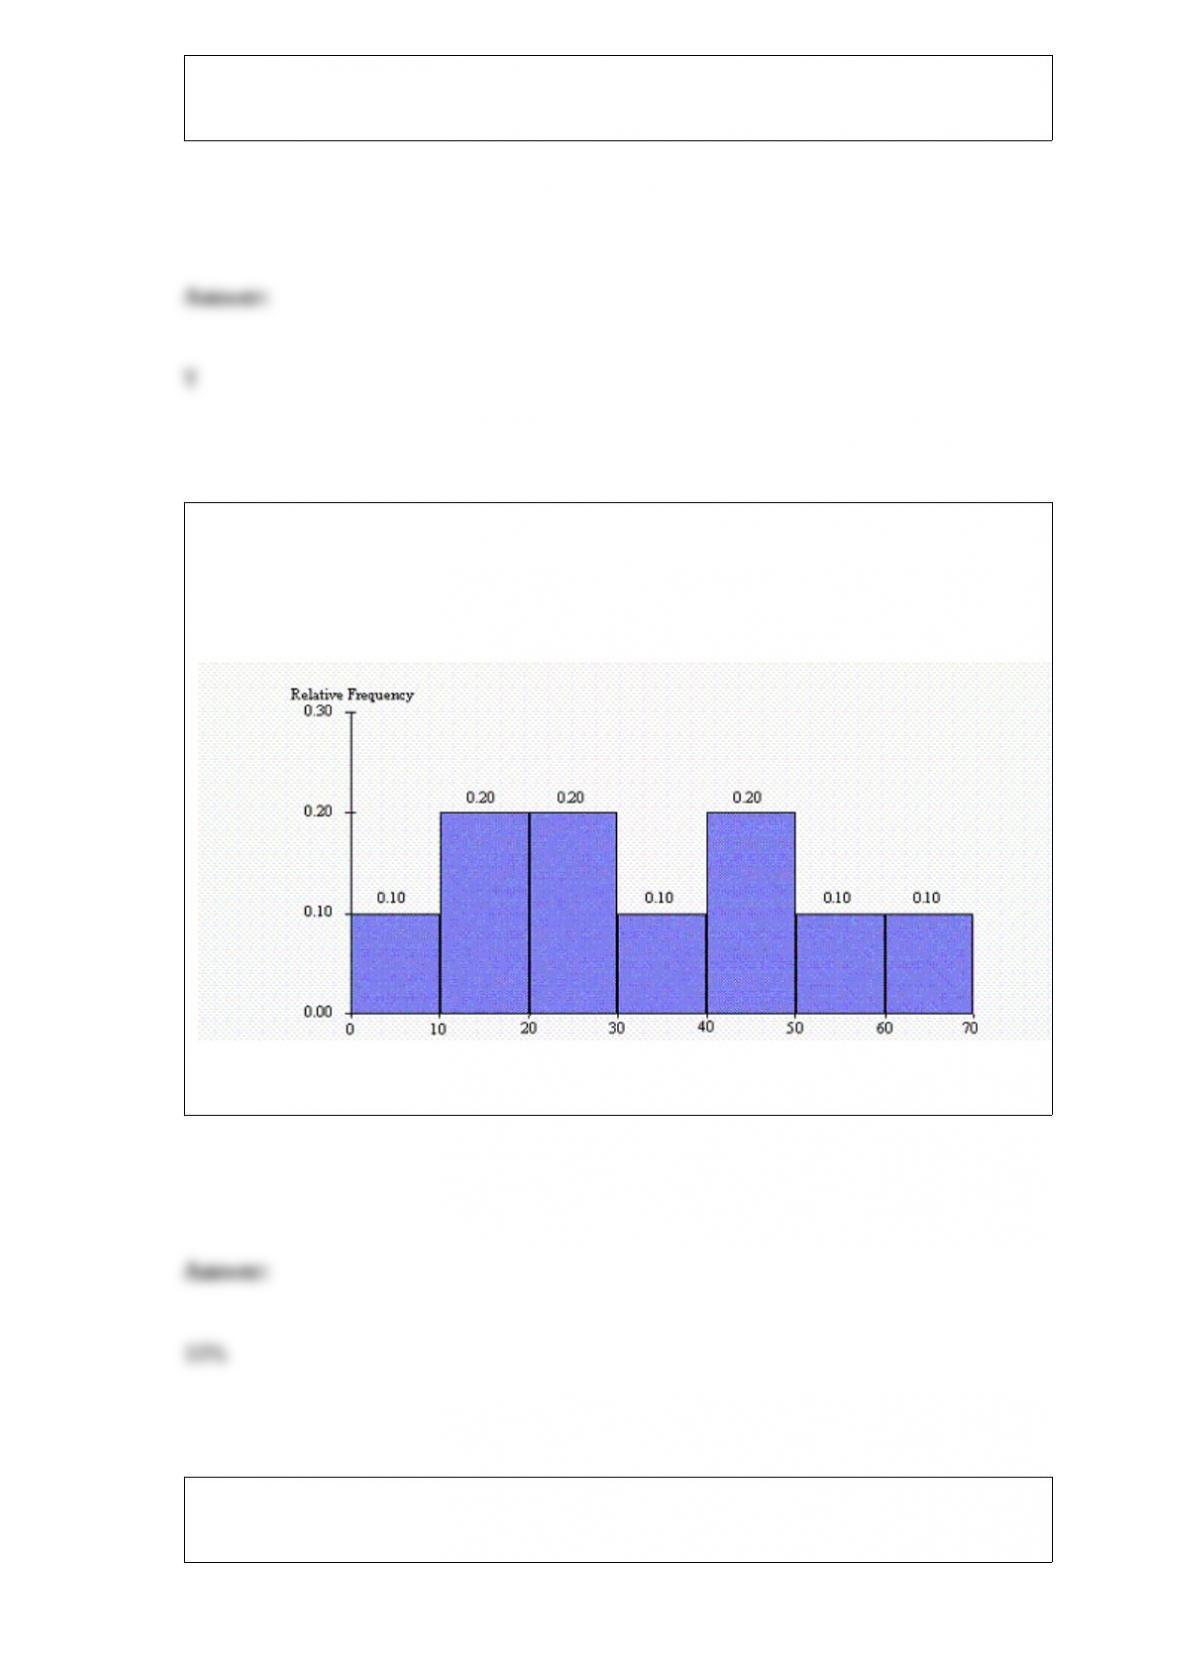
NARRBEGIN: SA_98_103
The histogram below represents scores achieved by 250 job applicants on a personality
profile.
NARREND What percentage of the job applicants scored between 30 and 40?
Distribution is a general term used to describe the way data are distributed, as indicated
by a frequency table or histogram.
It helps to ensure that Solver can find a solution to a linear programming problem if the
model is well-scaled; that is, all of the numbers are of roughly the same magnitude.
The executive also fairly confident that the company really wants to hire her, and she
thinks she may be able to negotiate a lower strike price ($40) and a larger number of
shares in the option (3,00 shares). What would be the value of the options in that case?
Using the standard normal distribution, the Z– score representing the 99th percentile is
2.326.
The scatterplot is a graphical technique used to describe the relationship between two
numerical variables.

A low p“value provides evidence for accepting the null hypothesis and rejecting the
alternative.
NARRBEGIN: SA_104_105
A motorcycle company is determining its production schedule for the next four
quarters. Demands for motorcycles are forecasted to be 40 in quarter 1; 70 in quarter 2;
50 in quarter 3; 20 in quarter 4. The company incurs four types of costs:
It costs the company $400 to manufacture each motorcycle
A holding cost of $100 per motorcycle left in inventory is incurred at the end of each
quarter.
Increasing production from one quarter to the next incurs costs for training employees.
It is estimated that a cost of $700 per motorcycle is incurred if production is increased
from one quarter to the next.
Decreasing production from one quarter to the next incurs costs for severance pay,
decreasing morale, and so forth. It is estimated that a cost of $600 per motorcycle is
incurred if production is decreased from one quarter to the next.
All demands must be met on time, and a quarter’s production can be used to meet
demand for the current quarter (as well as future quarters). During the quarter
immediately preceding quarter1, 50 motorcycles were produced. Assume that at the
beginning of quarter 1, no motorcycles are in inventory.
NARREND
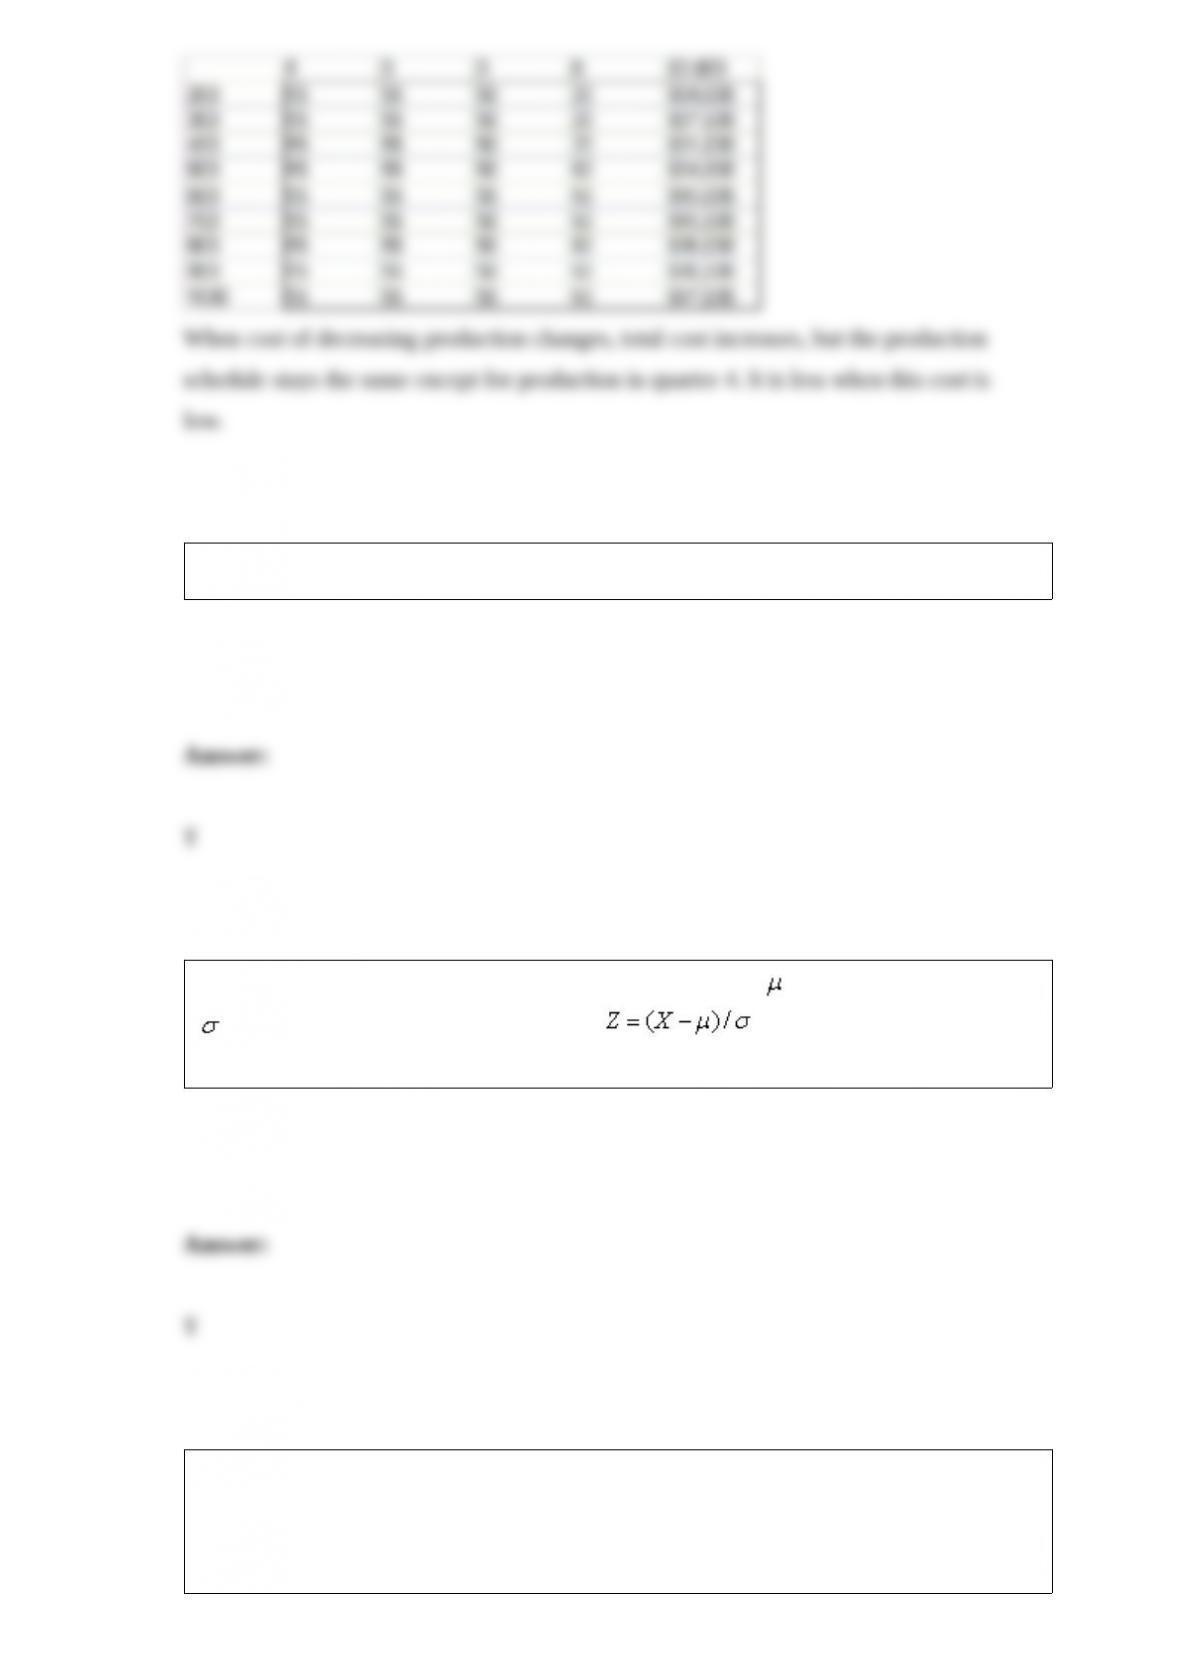
Discuss how the company’s optimal production schedule would be affected by a change
in the cost of decreasing production from one quarter to the next.
The flaw of averages is the reason deterministic models can be very misleading.
If the random variable X is normally distributed with mean and standard deviation
, then the random variable Z defined by is also normally distributed
with mean 0 and standard deviation 1.
NARRBEGIN: SA_108_112
The following values have been calculated using the TDIST and TINV functions in
Excel. These values come from a t- distribution with 15 degrees of freedom.
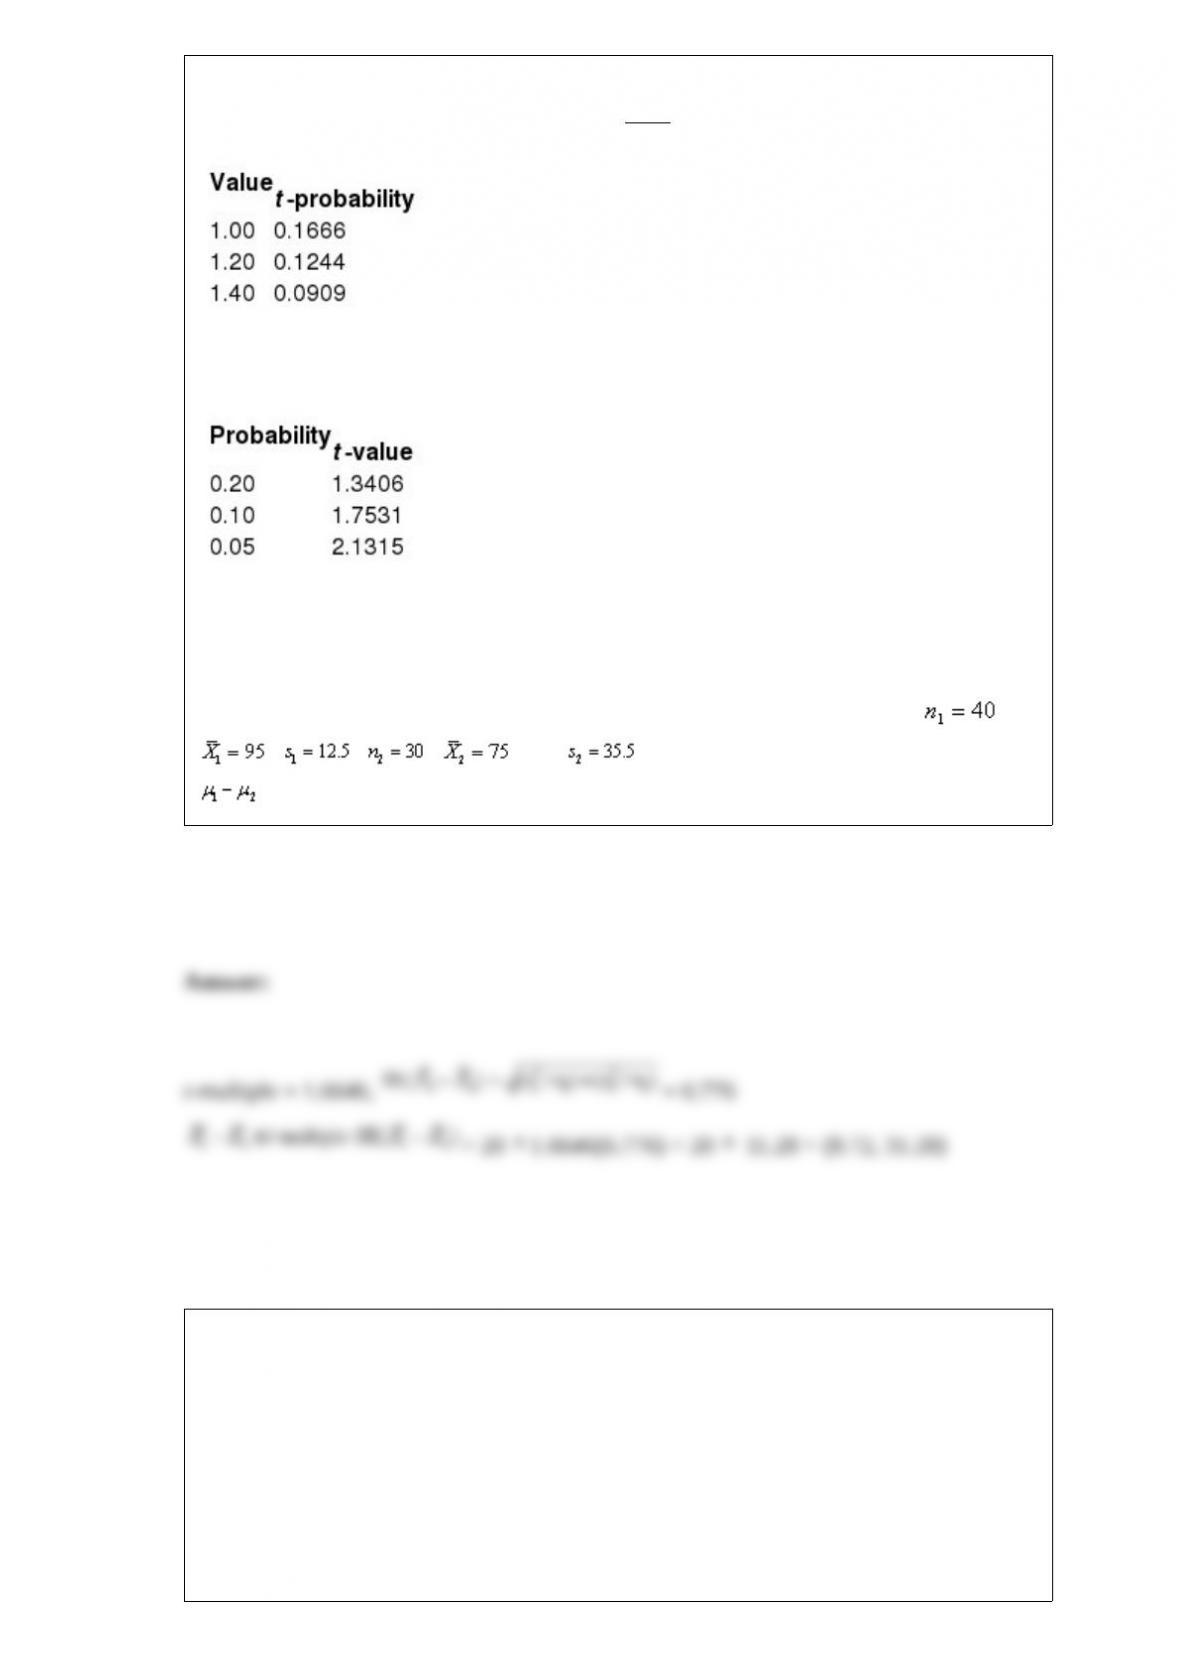
These values represent the probability to the right of the given positive values.
These values represent the positive t- value for a given probability in both tails (sum of
both tails).
NARREND
In constructing confidence interval estimate for the difference between the means of
two populations, where the unknown population variances are assumed not to be equal,
summary statistics computed from two independent samples are as follows: ,
, , , , and . Construct 90% confidence interval for
.
NARRBEGIN: SA_113_120
An oil company is planning to drill three exploratory wells in different areas of West
Texas. The company estimates that each of these wells, independent of the others, has
about a 30% chance of being successful.
NARREND
What is the probability that none of the oil wells will be successful?

A global optimal solution is not necessarily the best solution overall.
What percentage of these Internet users who are married.
Tornado charts and spider charts can be used to determine which input variables have
the most impact on the expected value in a decision problem

NARRBEGIN: SA_117_120
The time it takes a technician to fix a computer problem is exponentially distributed
with a mean of 15 minutes.
NARREND
What is the probability that it will take a technician between 10 to 15 minutes to fix a
computer problem?