
We should include an interaction variable in a regression model if we believe that the
effect of one explanatory variable on the response variable Y depends on the value of
another explanatory variable .
The purpose of using the moving average is to take away the short-term seasonal and
random variation, leaving behind a combined trend and cyclical movement.
NARRBEGIN: SA_72_81
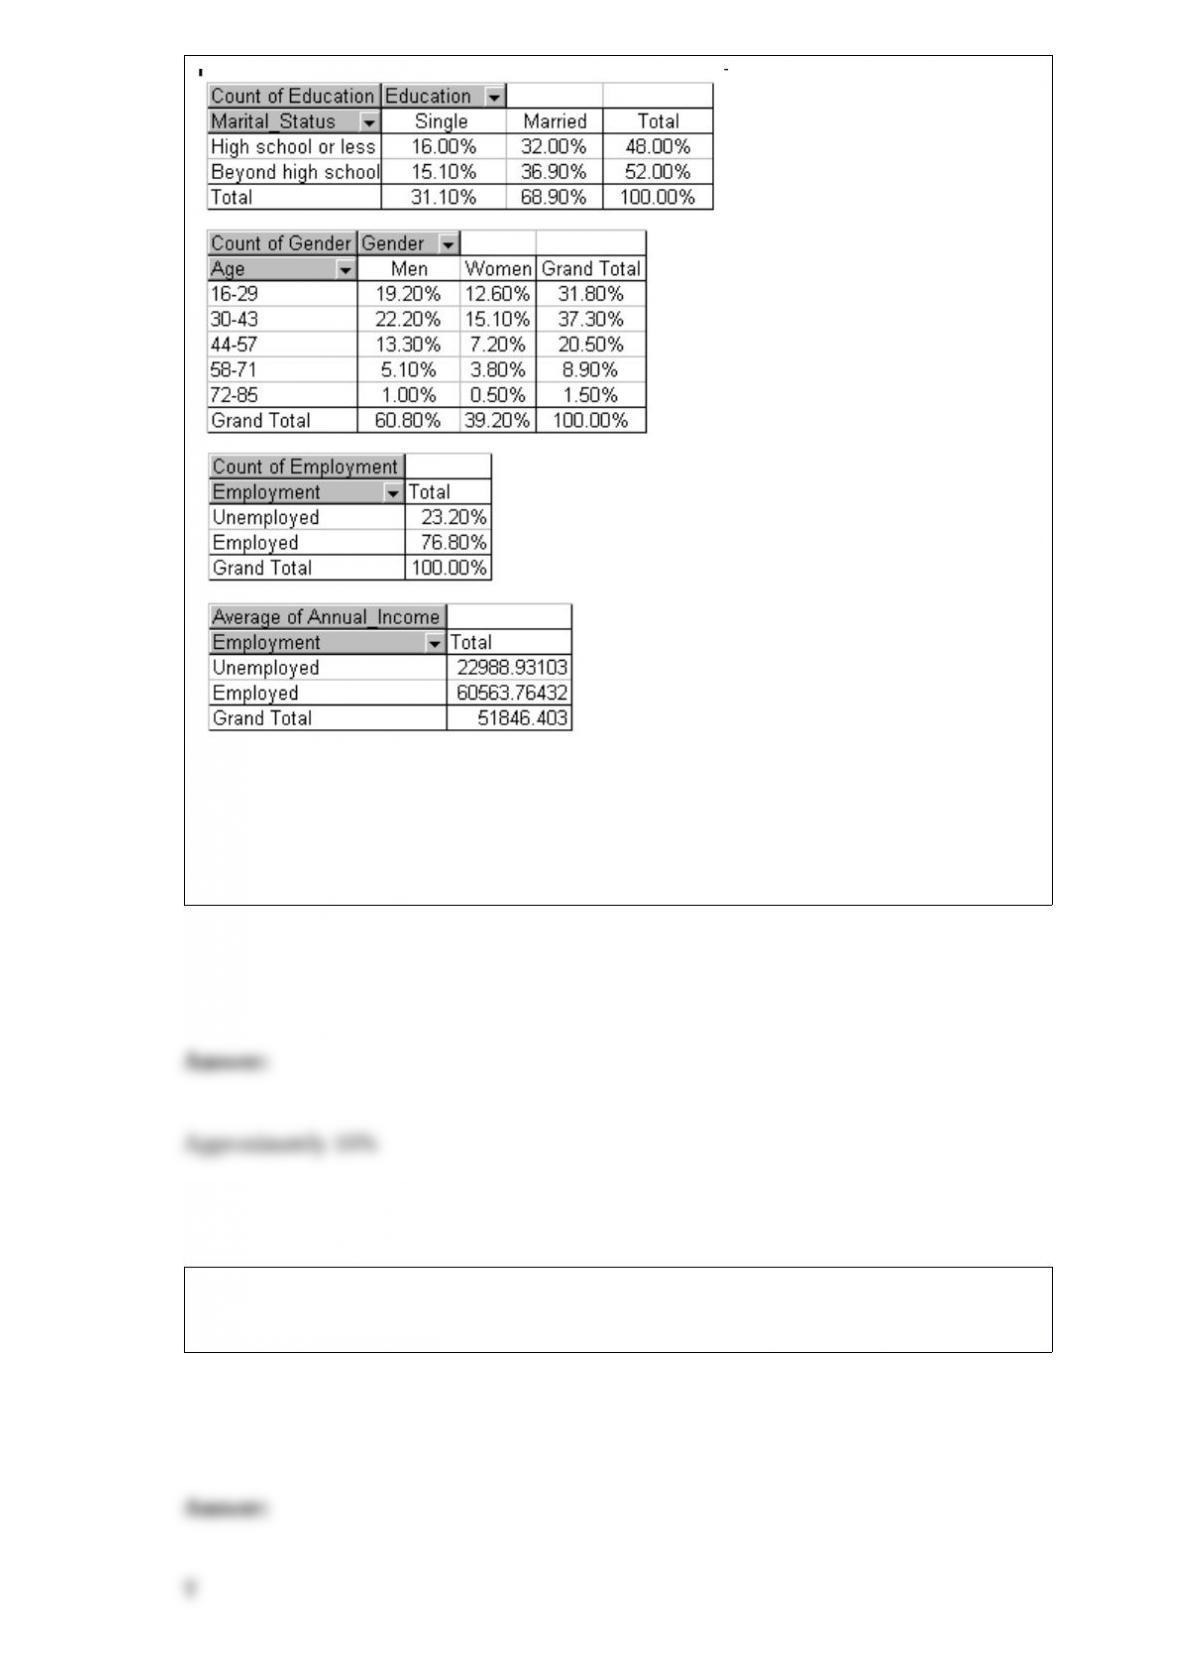
A recent survey data collected from 1000 randomly selected Internet users. The
characteristics of the users include their gender, age, education, marital status and
annual income. Using Excel, the following pivot tables were produced.
NARREND
Approximate the percentage of these Internet users who are single with no formal
education beyond high school.
Suppose A and B are mutually exclusive events where P(A) = 0.2 and P(B) = 0.5, then
P(A or B) = 0.70.

NARRBEGIN: SA_107_111
Suppose that the number of customers arriving each hour at the only checkout counter
at a local convenience store is approximately Poisson distributed with an expected
arrival rate of 30 customers per hour. Let X represent the number of customers arriving
per hour. The probabilities associated with X are shown below.
P(X < 5) = 0.0000, P(X < 10) = 0.0000, P(X < 15) = 0.0009,
P(X < 20) = 0.0219, P(X < 25) = 0.1572, P(X < 30) = 0.4757
P(X = 30) = 0.0726, P(X = 31) = 0.0703, P(X = 32) = 0.0659,
P(X = 33) = 0.0599, P(X = 34) = 0.0529, P(X = 35) = 0.0453
NARREND
What is the probability that at least 20 customers, but fewer than 30 customers arrive at
this checkout counter in a given hour?
What other data would you need to be more confident that increased income inequality
leads to lower unemployment?
If we want to model a random stock price, we should do so with an unbounded
symmetric probability distribution.

Using @RISK summary functions such as RISKMEAN, RISKPERCENTILE, and
others allows us to capture simulation results in the same worksheet as the simulation
model.
NARRBEGIN: SA_56_61
A popular retail store knows that the distribution of purchase amounts by its customers
is approximately normal with a mean of $30 and a standard deviation of $9. Below you
will find normal probability and percentile calculations related to the customer purchase
amounts.
Probability Calculations
P(Sales < $ 15.00) = 0.048, P(Sales < $ 20.00) = 0.133,
P(Sales < $ 25.00) = 0.289, P(Sales < $ 35.00) = 0.711
Percentiles Calculations
1st Percentile = $9.06, 5th Percentile = $15.20,
95th Percentile = $44.80, 99th Percentile = $50.94
NARREND
What two dollar amounts, equidistant from the mean of $30, such that 90% of all
customer purchases are between these values?

Multiple regression represents an improvement over simple regression because it allows
any number of response variables to be included in the analysis.
Analysts often plan a simulation so that the confidence interval for the mean of some
important output will be sufficiently narrow. The reasoning is that narrow confidence
intervals imply more precision about the estimated mean of the output variable.
If two samples contain the same number of observations, then the data must be paired.
The moving average method is perhaps the simplest and one of the most
frequently-used extrapolation methods.
Side”by”side box”plots are typically a good way to begin the analysis when comparing
two populations.
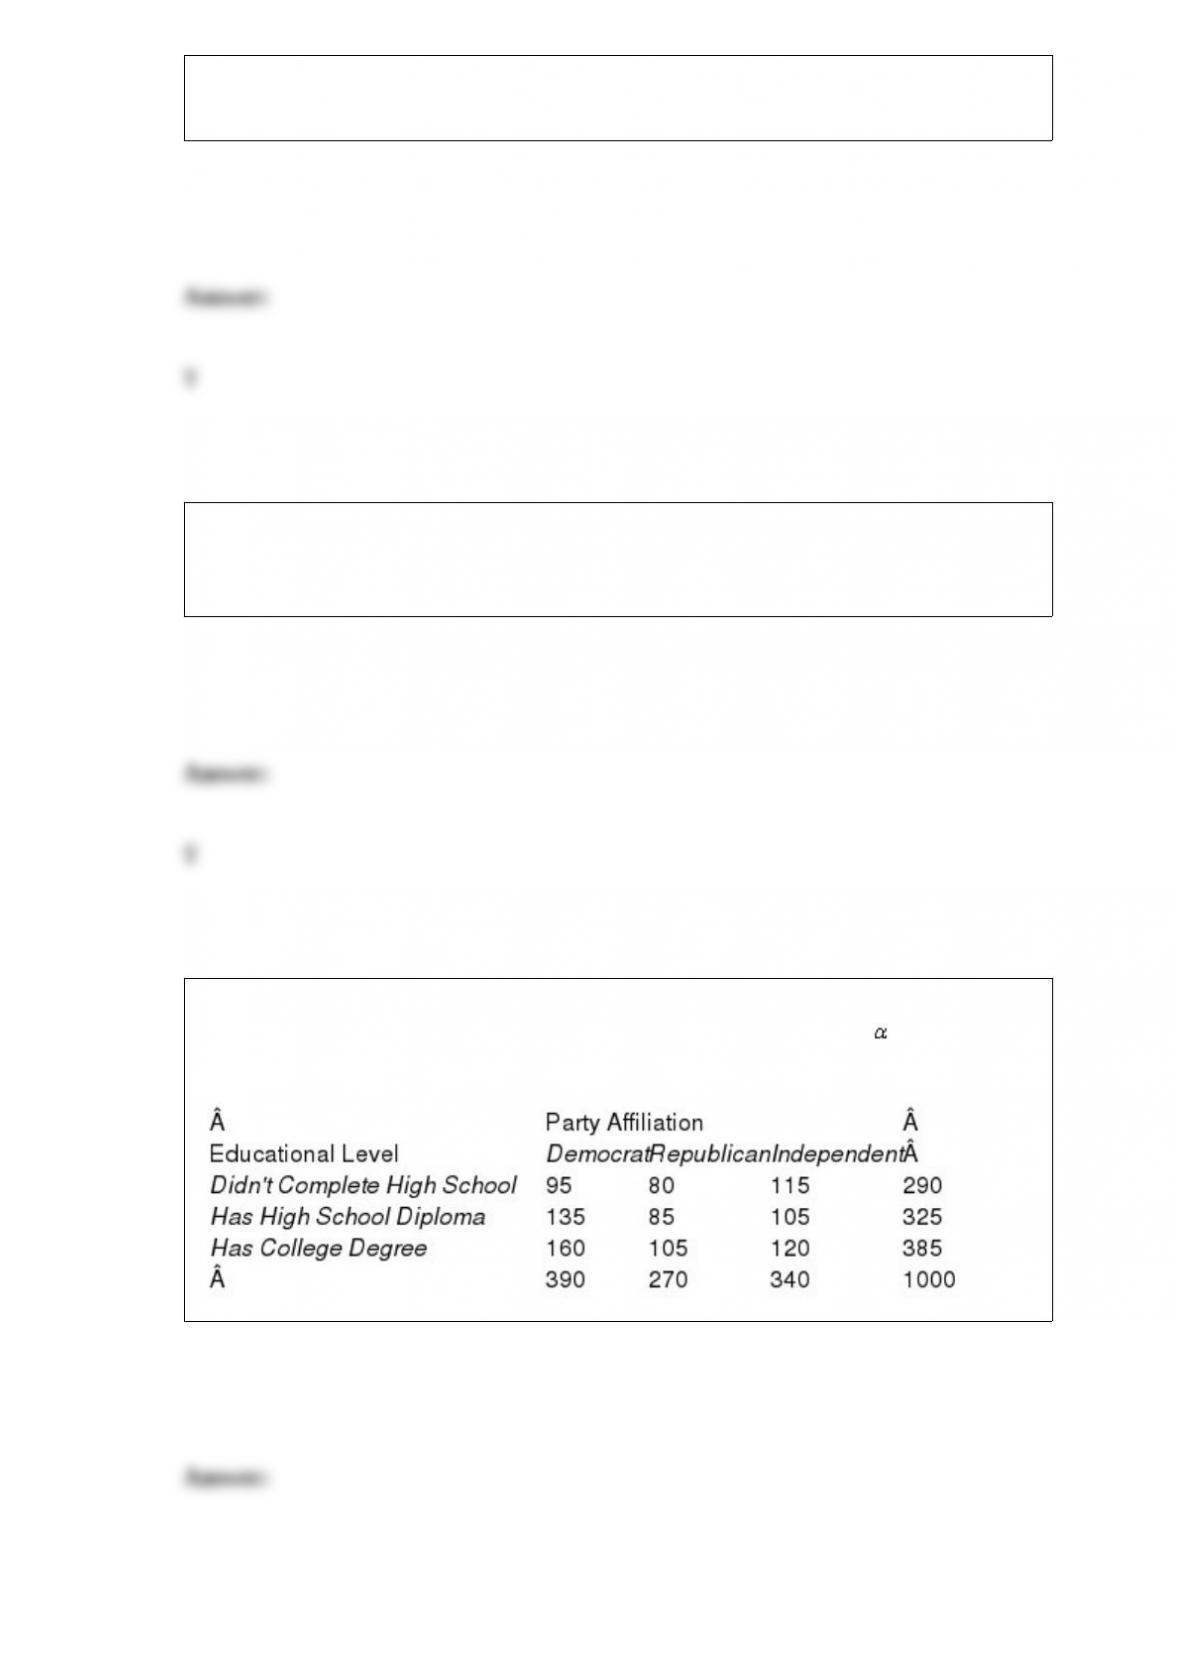
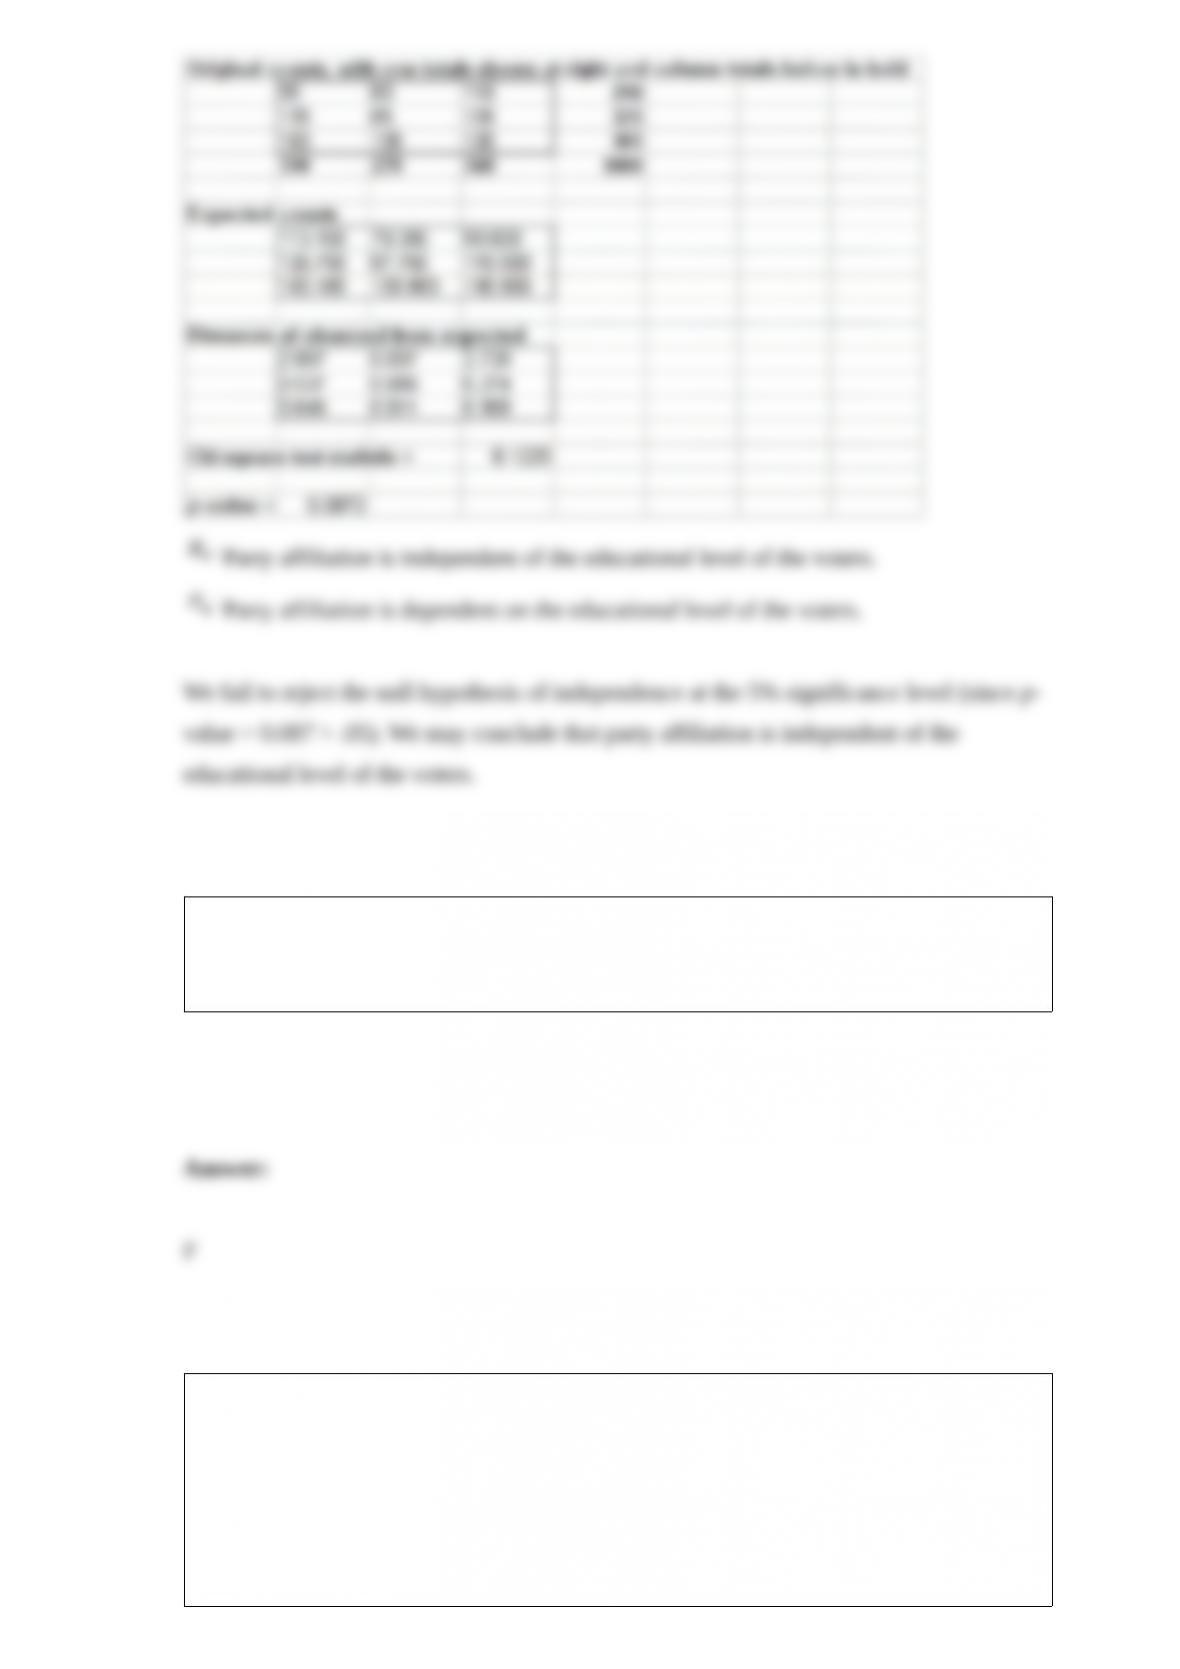
A recent study of educational levels of 1000 voters and their political party affiliations
in a Midwestern state showed the results given in the table below. Use = .10 and test
to determine if party affiliation is independent of the educational level of the voters.
The flows in a general minimum cost network flow model (MCNFM) do all necessarily
have to be from “left to right”; that is, from supply points to demand points.
NARRBEGIN: SA_86_89
A buyer for a large sporting goods store chain must place orders for professional
footballs with the football manufacturer six months prior to the time the footballs will
be sold in the stores. The buyer must decide in November how many footballs to order
for sale during the upcoming late summer and fall months. Assume that each football
costs the chain $45. Furthermore, assume that each pair can be sold for a retail price of
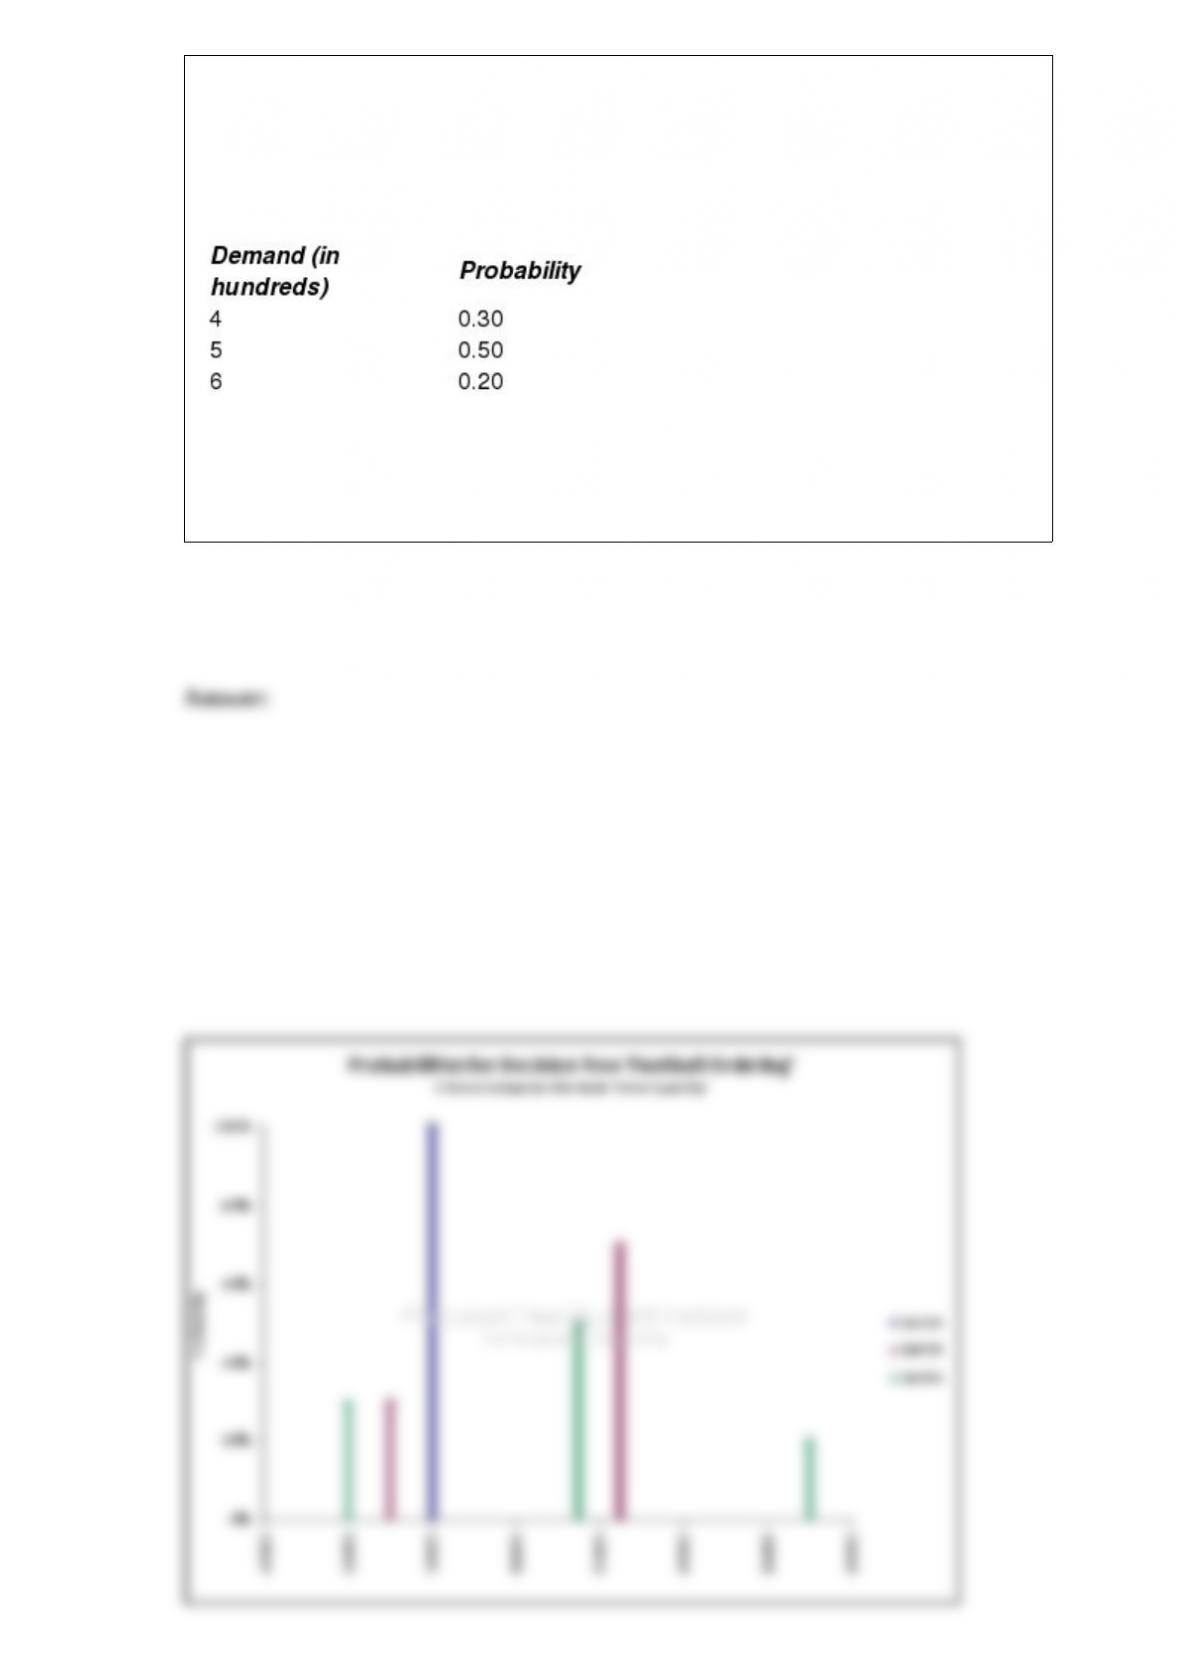
$90. If the footballs are still on the shelves after next Christmas, they can be discounted
and sold for $35 each. The probability distribution of consumer demand for these
footballs (in hundreds) during the upcoming season has been assessed by the market
research specialists and is presented below. Finally, assume that the sporting goods store
chain must purchase the footballs in lots of 100 units.
NARREND
Generate a risk profile for each possible decision in this problem. Would this have any
impact on your decision?
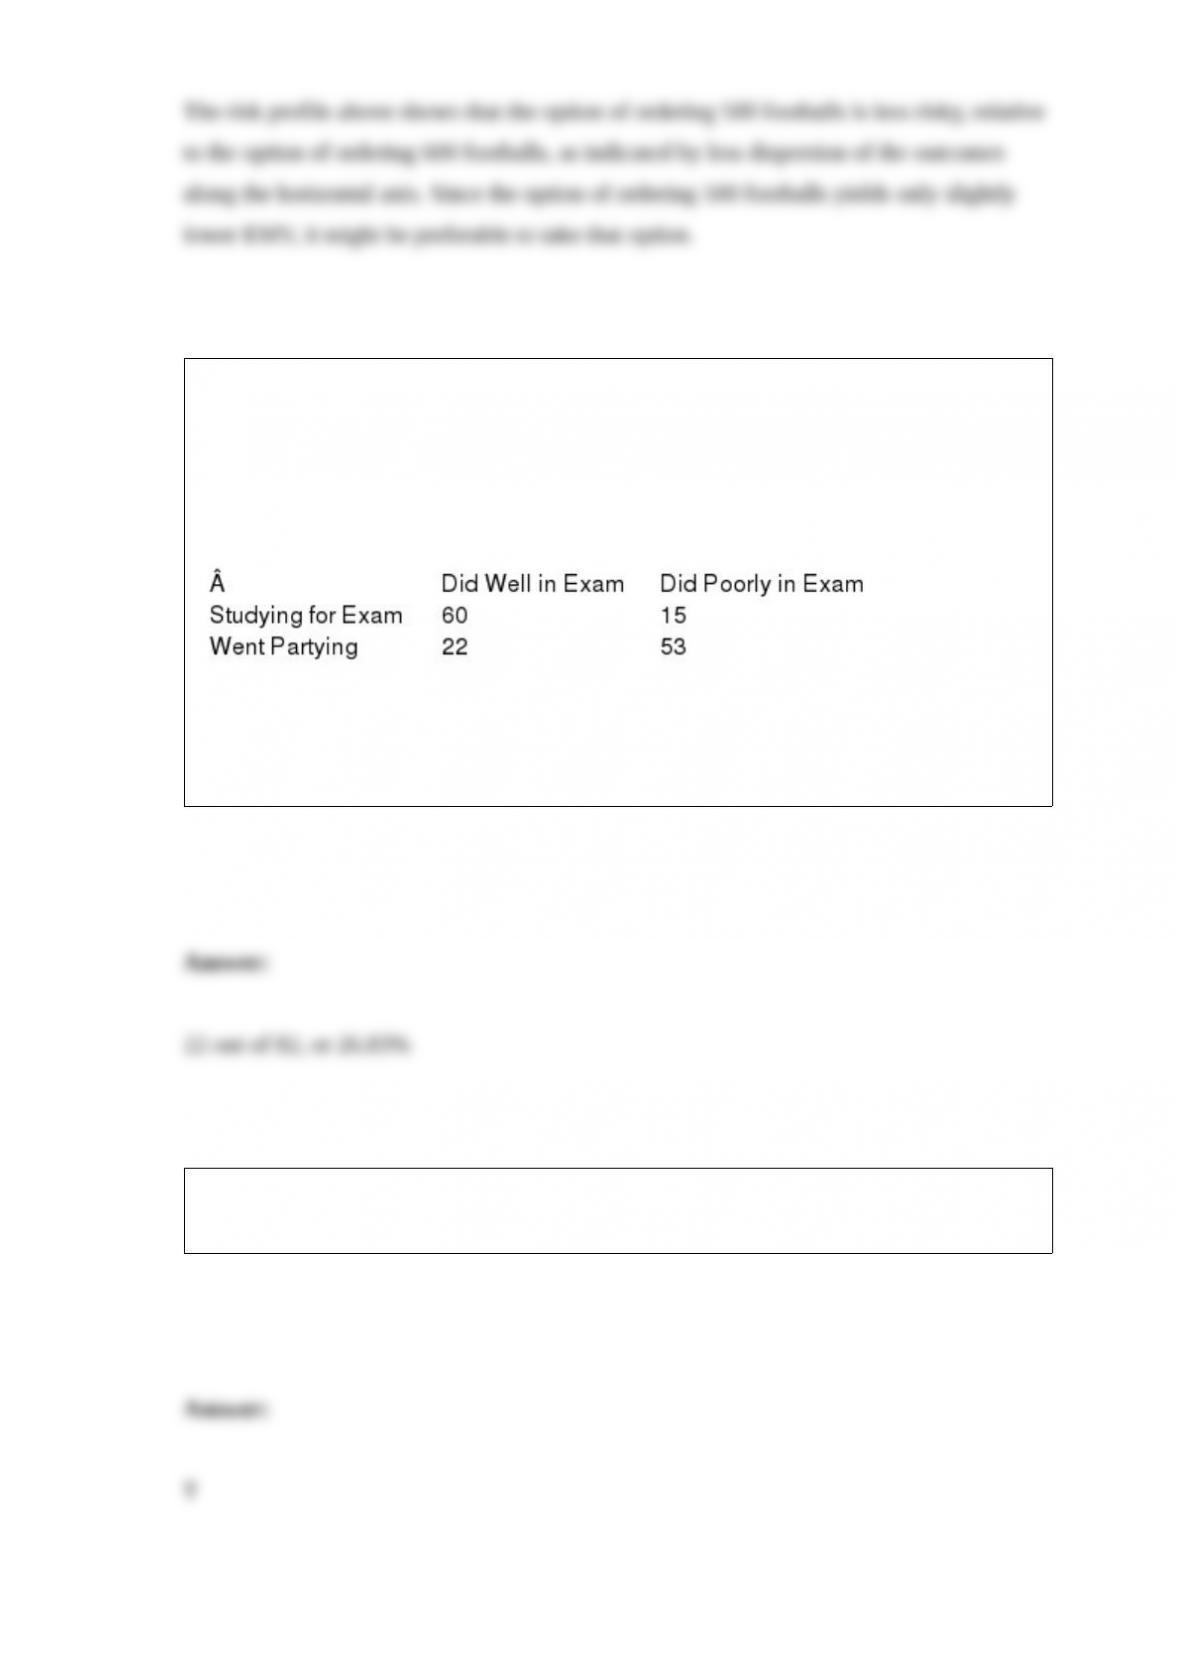
NARRBEGIN: SA_58_67
A sample of 150 students at a State University was taken after the final business
statistics exam to ask them whether they went partying the weekend before the final or
spent the weekend studying, and whether they did well or poorly on the final. The
following table contains the result.
NARREND
Of those in the sample who did well on the final exam, what percentage of them went
partying the weekend before the exam?
The number of people entering a shopping mall on a given day is an example of a
discrete random variable.