If the partial F test indicates that a group of variables is significant, it also implies that
each variable in the group is significant.
NARRBEGIN: SA_116_118
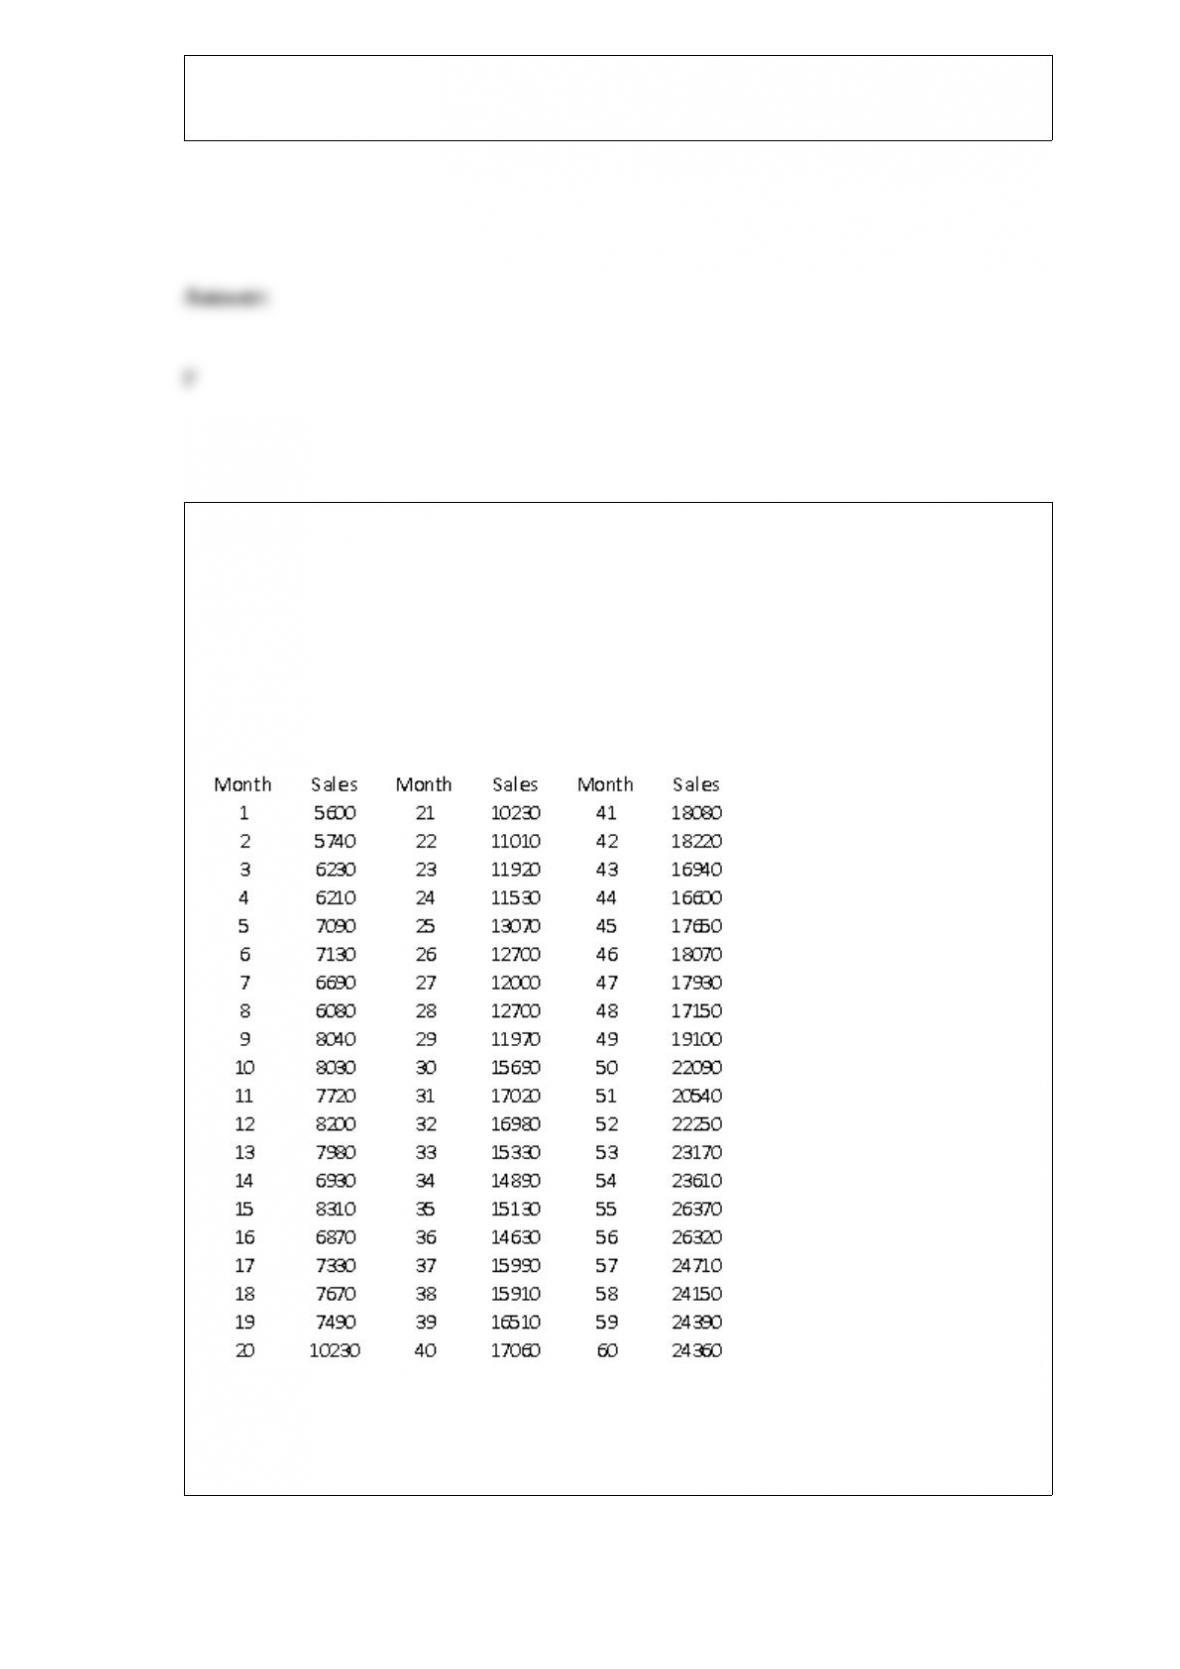
The table below contains 5 years of monthly data on sales (number of units sold) for a
particular company, in addition to extra columns containing information needed to
answer some of the questions. The company suspects that except for random noise, its
sales are growing by a constant percentage each month and that they will continue to do
so for at least the near future.
NARREND
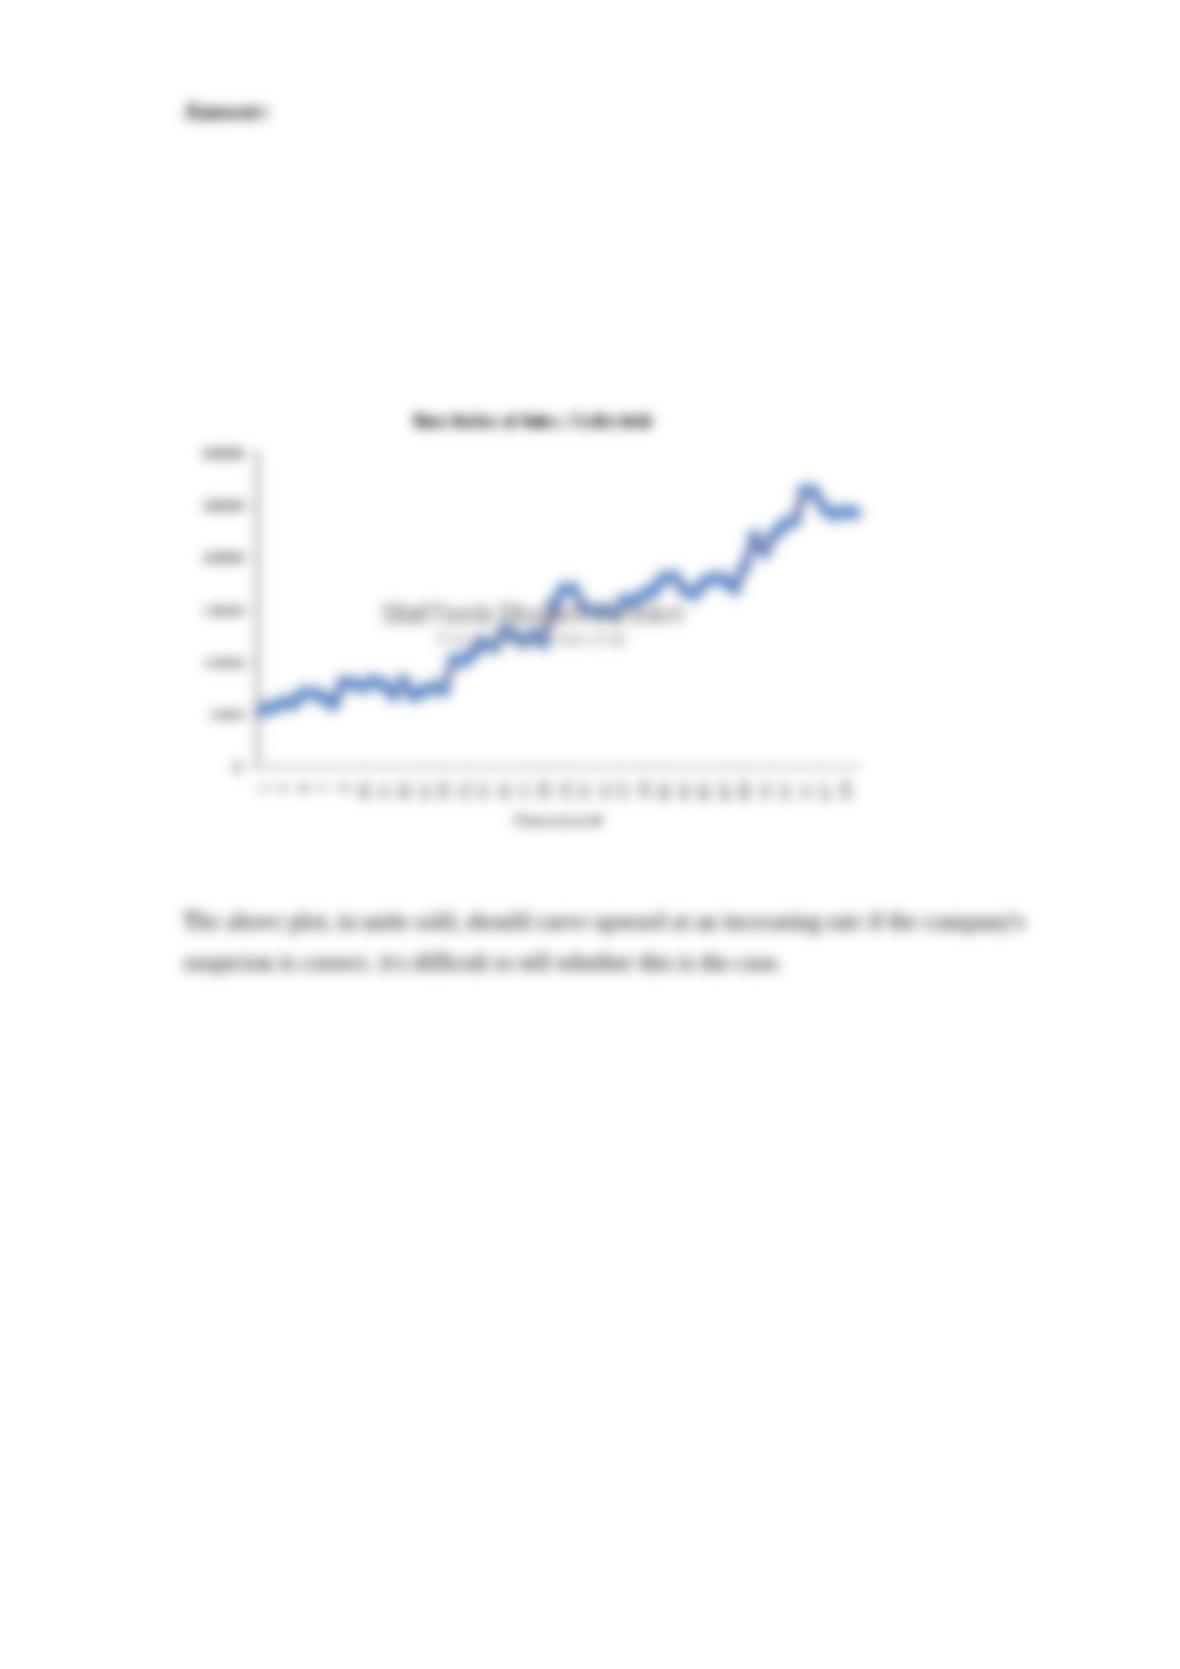
Explain briefly whether the plot of the series visually supports the company’s suspicion.
NARRBEGIN: SA_51_56
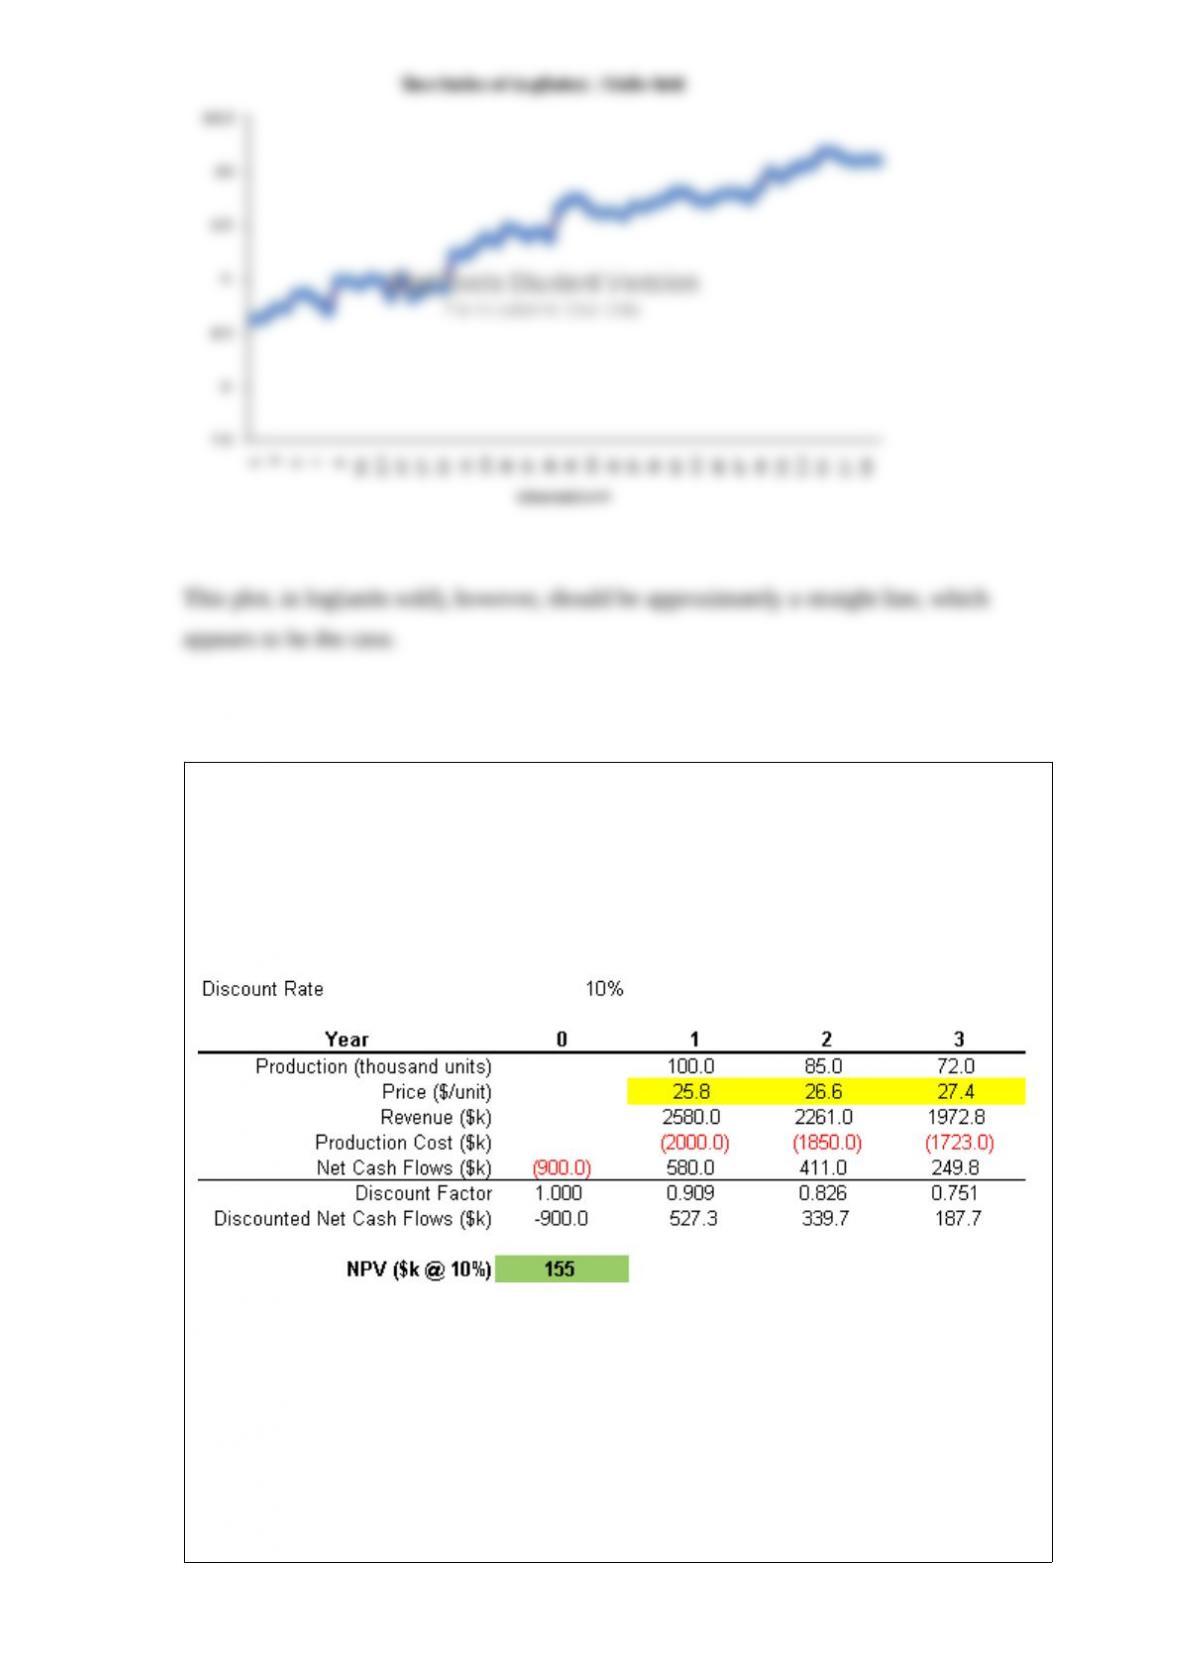
A firm is considering investing $0.9M in a typical industrial manufacturing application
with a three year production planning cycle under a forecasted market price
environment. A simple three-period project pro forma cash flow sheet for this project is
shown below:
In the pro forma, the production and price forecast in each period translate to revenue,
which can then be netted of production costs to arrive at the expected cash flow in each
period. The cash flows are then be discounted at a rate that is commensurate with the
riskiness of the project (here, assumed to be 10%).
NARREND
What is the standard deviation of the NPV? What does it indicate?

The number of car insurance policy holders is an example of a discrete random variable
NARRBEGIN: SA_107_111
Suppose that the number of customers arriving each hour at the only checkout counter
at a local convenience store is approximately Poisson distributed with an expected
arrival rate of 30 customers per hour. Let X represent the number of customers arriving
per hour. The probabilities associated with X are shown below.
P(X < 5) = 0.0000, P(X < 10) = 0.0000, P(X < 15) = 0.0009,
P(X < 20) = 0.0219, P(X < 25) = 0.1572, P(X < 30) = 0.4757
P(X = 30) = 0.0726, P(X = 31) = 0.0703, P(X = 32) = 0.0659,
P(X = 33) = 0.0599, P(X = 34) = 0.0529, P(X = 35) = 0.0453
NARREND
What is the probability that the number of customers who arrive at this checkout
counter in a given hour will be greater than 35?

Approximate the percentage of these internet users who are women in the 30-43 age
group.
NARRBEGIN: SA_108_112
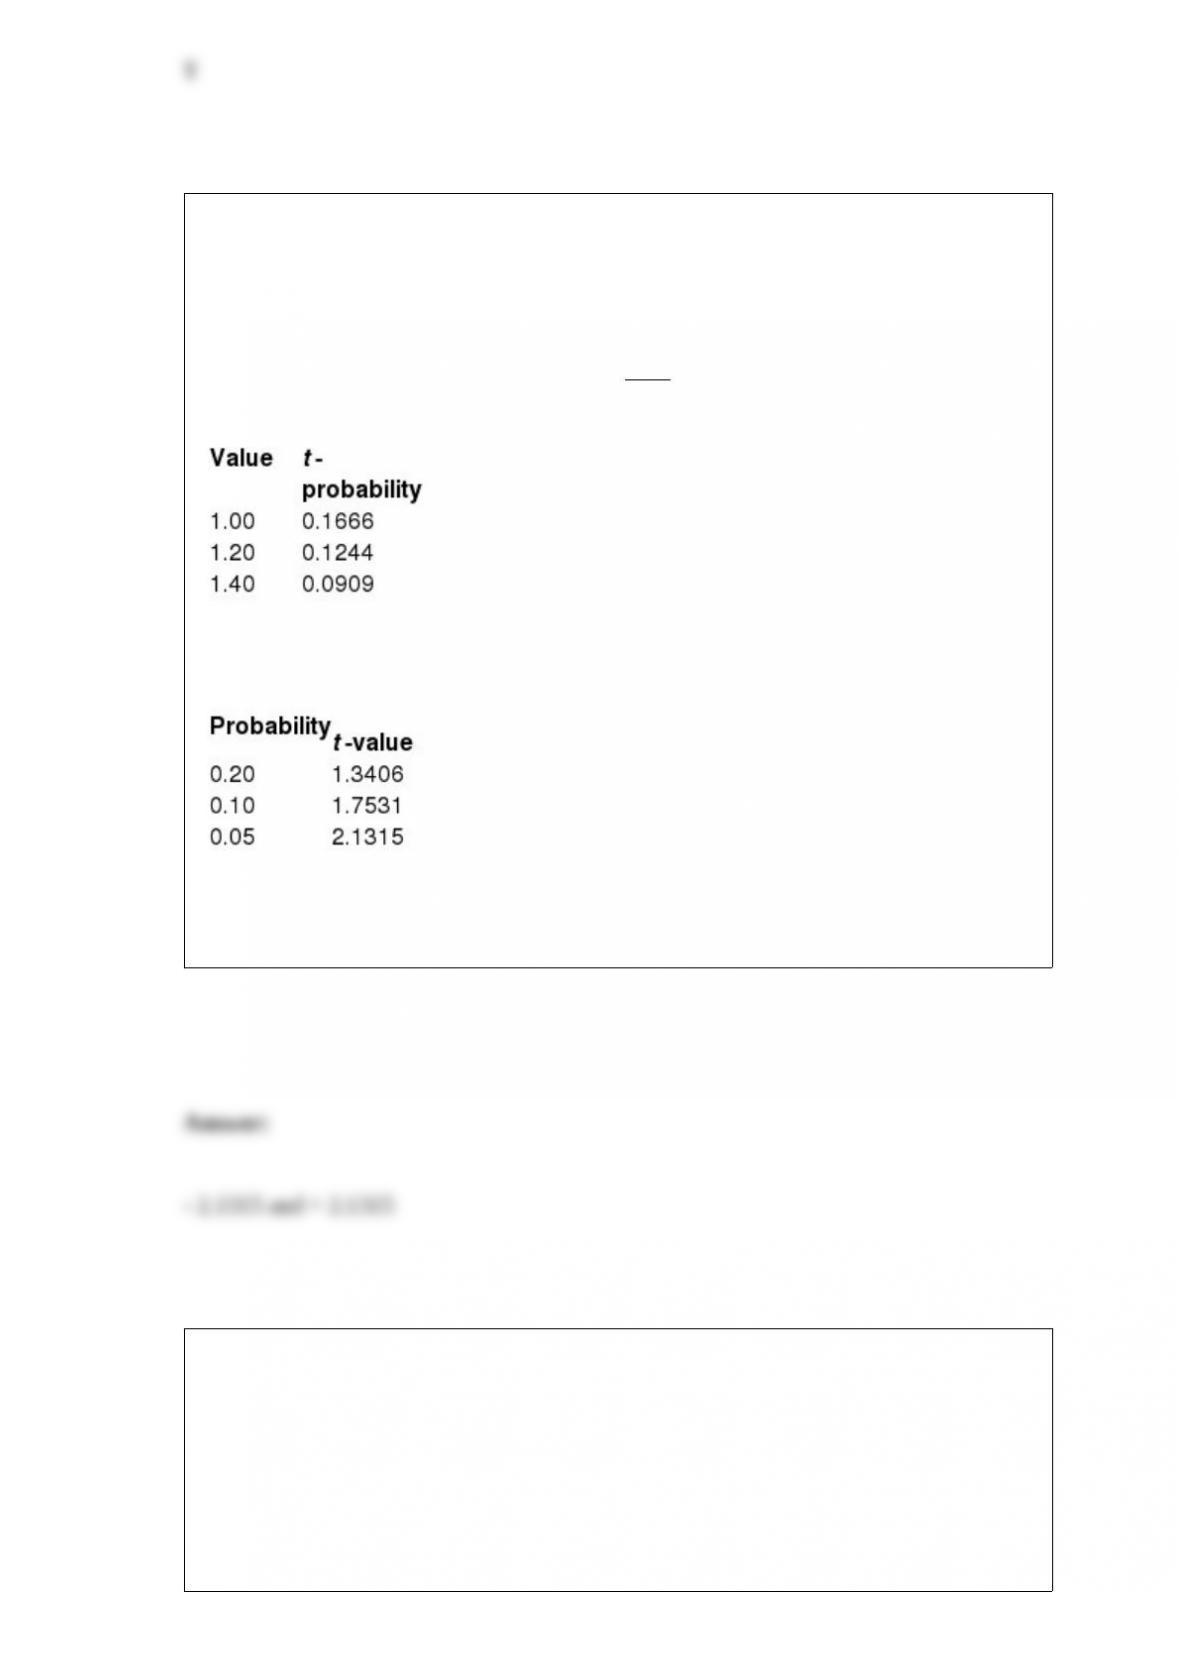
The following values have been calculated using the TDIST and TINV functions in
Excel. These values come from a t- distribution with 15 degrees of freedom.
These values represent the probability to the right of the given positive values.
These values represent the positive t- value for a given probability in both tails (sum of
both tails).
NARREND
In past years, approximately 25% of all U.S. families purchased potato chips at least
once a month. We are interested in determining the fraction of all U.S. families that
currently purchase potato chips at least once a month. How many families must we
survey if we want to be 99% sure that our estimate of the fraction of U.S. families
currently purchasing potato chips at least once a month is accurate within 2%?

NARRBEGIN: SA_68_73
Suppose that GM earns a $4000 profit each time a person buys a car. We want to
determine how the expected profit earned from a customer depends on the quality of
GM’s cars. The customer is assumed to buy a new car every five years, for a total of 10
cars through her lifetime. The customer will keep buying GM cars so long as they are
satisfied with them. The probability that the customer will be satisfied with her GM car
is 80%. If she is not satisfied with her GM car, she will buy another brand (we”ll call all
other brands cumulatively “Toyota”). The probability that she is satisfied with “Toyota”
is 85%.
NARREND
Using your answers to Questions 69 and 70, and without simulating the model again,
estimate how much an extra 5% customer satisfaction is worth to GM.
@Risk introduces uncertainty explicitly into a spreadsheet model by allowing several
inputs to have probability distributions and then enabling the simulation of random
values from these inputs.
NARRBEGIN: SA_108_112
The following values have been calculated using the TDIST and TINV functions in
Excel. These values come from a t- distribution with 15 degrees of freedom.
These values represent the probability to the right of the given positive values.
These values represent the positive t- value for a given probability in both tails (sum of
both tails).
NARREND
What would be the t-values where 0.95 of the values would fall within this interval?
NARRBEGIN: SA_79_90
The service manager for a new appliances store reviewed sales records of the past 20
sales of new microwaves to determine the number of warranty repairs he will be called
on to perform in the next 90 days. Corporate reports indicate that the probability any
one of their new microwaves needs a warranty repair in the first 90 days is 0.05. The
manager assumes that calls for warranty repair are independent of one another and is
interested in predicting the number of warranty repairs he will be called on to perform

in the next 90 days for this batch of 20 new microwaves sold.
NARREND
What is the standard deviation of the number of the new microwaves sold that will
require a warranty repair in the first 90 days?
Infeasibility refers to the situation in which there are no feasible solutions to the LP
model
Do you think this model proves the agency’s point about maintenance? Explain your
answer.

NARRBEGIN: SA_83_85
A department store in a small town is in the process of budget planning and will be
building a decision tree to select the best option among its available marketing
channels. To estimate the probabilities it will need, it considers a customer base of 1500
individuals, 700 of which are women. Data shows that 240 of the women in this
population earn at least $50,000 per year and 300 of the men earn at least $50,000 per
year.
NARREND
If a randomly selected individual is observed to earn less than $50,000 per year, what is
the probability that this person is a woman?
The time series component that reflects a wavelike pattern describing a long-term trend
that is generally apparent over a number of years is called cyclical.
Forecasting software packages typically report several summary measures of the
forecasting error. The most important of these are MAE (mean absolute error), RMSE
(root mean square error), and MAPE (mean absolute percentage error).

Simple random samples are typically used in real applications.