1. Civil engineers use statistical models to study the reliability of construction materials and
structures and to design for flood control and water supply management.
a. True
b. False
2. Manufacturing engineers use statistics for quality control assurance of the products they
produce.
a. True
b. False
3. In probability, each time you repeat an experiment is called a
a. trial
b. test run
c. measurement
d. guess
4. In probability, the result of an experiment is called
a. the end product
b. an outcome
c. the answer
d. the product
5. In probability, a random experiment is one that has random outcomes that cannot be predicted
exactly.
a. True
b. False
6. This question has four possible answers listed below and only one of them is correct. If you
select one at random, what is the probability that you pick the correct answer?
a. 0.75
b. 0.50
c. 0.25
d. 0.10
7. This question has four possible answers listed below and only one of them is correct. If you
select one at random, what are the odds that you pick the correct answer?
a. 1:2
b. 1:3
c. 1:4
d. 1:5
8. There are 20 red marbles and 10 blue marbles mixed together in a cloth bag. If you reach in
and pull out a marble, without looking, what is the probability of selecting a blue marble?
a. 0.75
b. 0.50
c. 0.25
d. 0.33
9. There are 20 red marbles and 10 blue marbles mixed together in a cloth bag. If you reach in
and pull out a marble, without looking, what are the odds of selecting a blue marble?
a. 1:2
b. 1:3
c. 1:4
d. 1:5

10. That area of science that deals with collection, organization, analysis, and interpretation of
data is known as
a. probability
b. statics
c. statistics
d. mathematics
11. Statistics deals with methods and techniques that can be used to draw conclusions about the
characteristics of something with a large number of data points sing a smaller portion of the
entire data.
a. True
b. False
12. In statistics, something with a large number of data points is commonly called a
a. population
b. group
c. data set
d. sample
13. In statistics, smaller portion of the entire data or population is commonly called a
a. subset
b. group
c. data set
d. sample
14. One simple way of organizing the data better would be to identify the lowest and the highest
values, and then group the data into equal intervals or ranges:
Test Bank Engineering Fundamentals, 5th ed. Chapter 19
a. True
b. False
15. In statistics, one way of showing the range of values and their frequency is by showing a
mean value.
a. True
b. False
16. A histogram is a way to show the range of data and their frequency. The height of the bars
shows the frequency of the data within the given ranges.
a. True
b. False
17. The cumulative frequency does not show the cumulative number of data with values up to
and including those in the given range.
a. True
b. False
18. There are basically two types of observation errors:
a. personal and professional.
b. systemic and random.
c. partial and complete.
d. visual and measured.
19. Systemic errors are errors
a. that occur throughout the entire system.
Test Bank Engineering Fundamentals, 5th ed. Chapter 19
b. that occur on a frequent basis.
c. associated with using an inaccurate instrument.
d. associated with the design and setup of the experiment.
20. Random errors
a. can be detected and avoided by properly calibrating instruments.
b. are generated by a number of unpredictable variations.
c. rarely occur in a properly designed experiment.
d. can be removed from the data set through proper statistical analysis.
21. The arithmetic average of a list of numbers is known as the
a. median
b. mode
c. mean
d. root mean squared
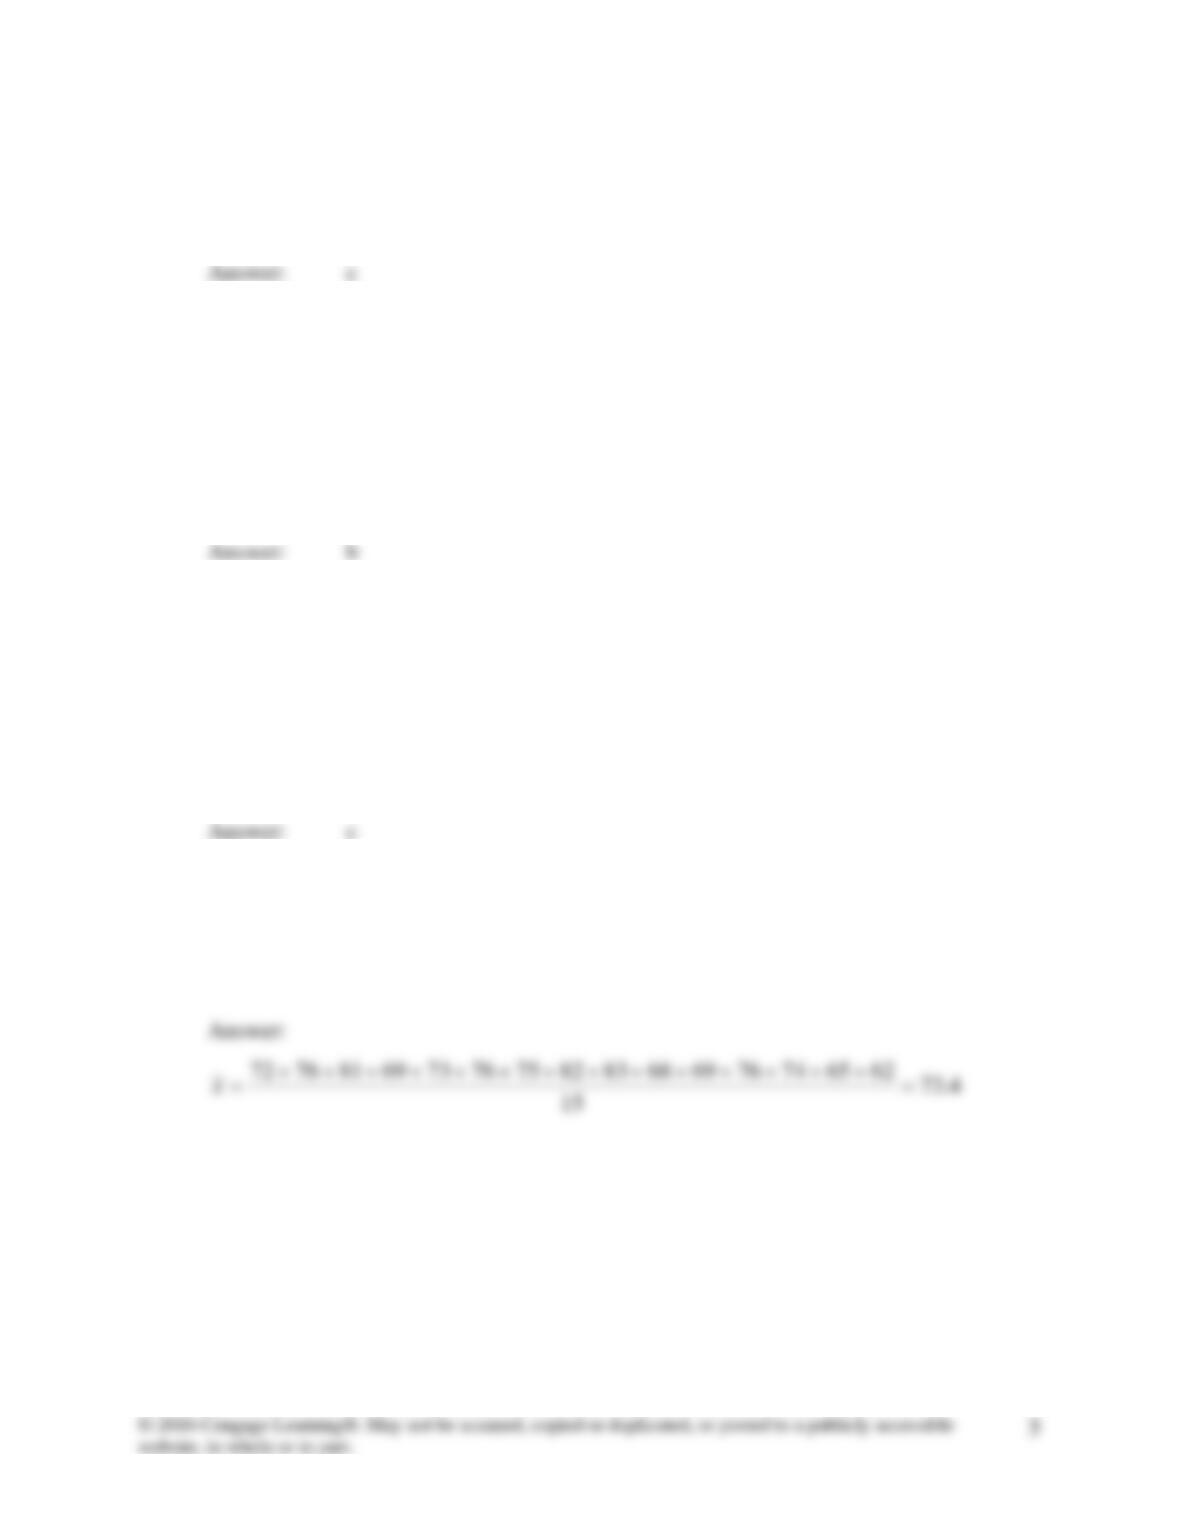
22. A list of temperature readings (in degrees Fahrenheit) is shown below. Calculate the mean
temperature:
72, 76, 81, 69, 73, 76, 75, 82, 83, 68, 69, 76, 74, 65, 62
23. Median is the value in the middle of a data. It is that value that separates the higher half of
the data from its lower half.
a. True
b. False
24. A list of temperature readings (in degrees Fahrenheit) is shown below. Calculate the median
temperature:
72, 76, 81, 69, 73, 76, 75, 82, 83, 68, 69, 76, 74, 65, 62
25. A common way of measuring the dispersion of data is by calculating the
a. spread
b. scattering
c. mode
d. variance
26. The standard deviation is
a. the square root of the variance.
b. the square of the variance.
c. the root mean squared of the variance.
d. the absolute value of the variance.
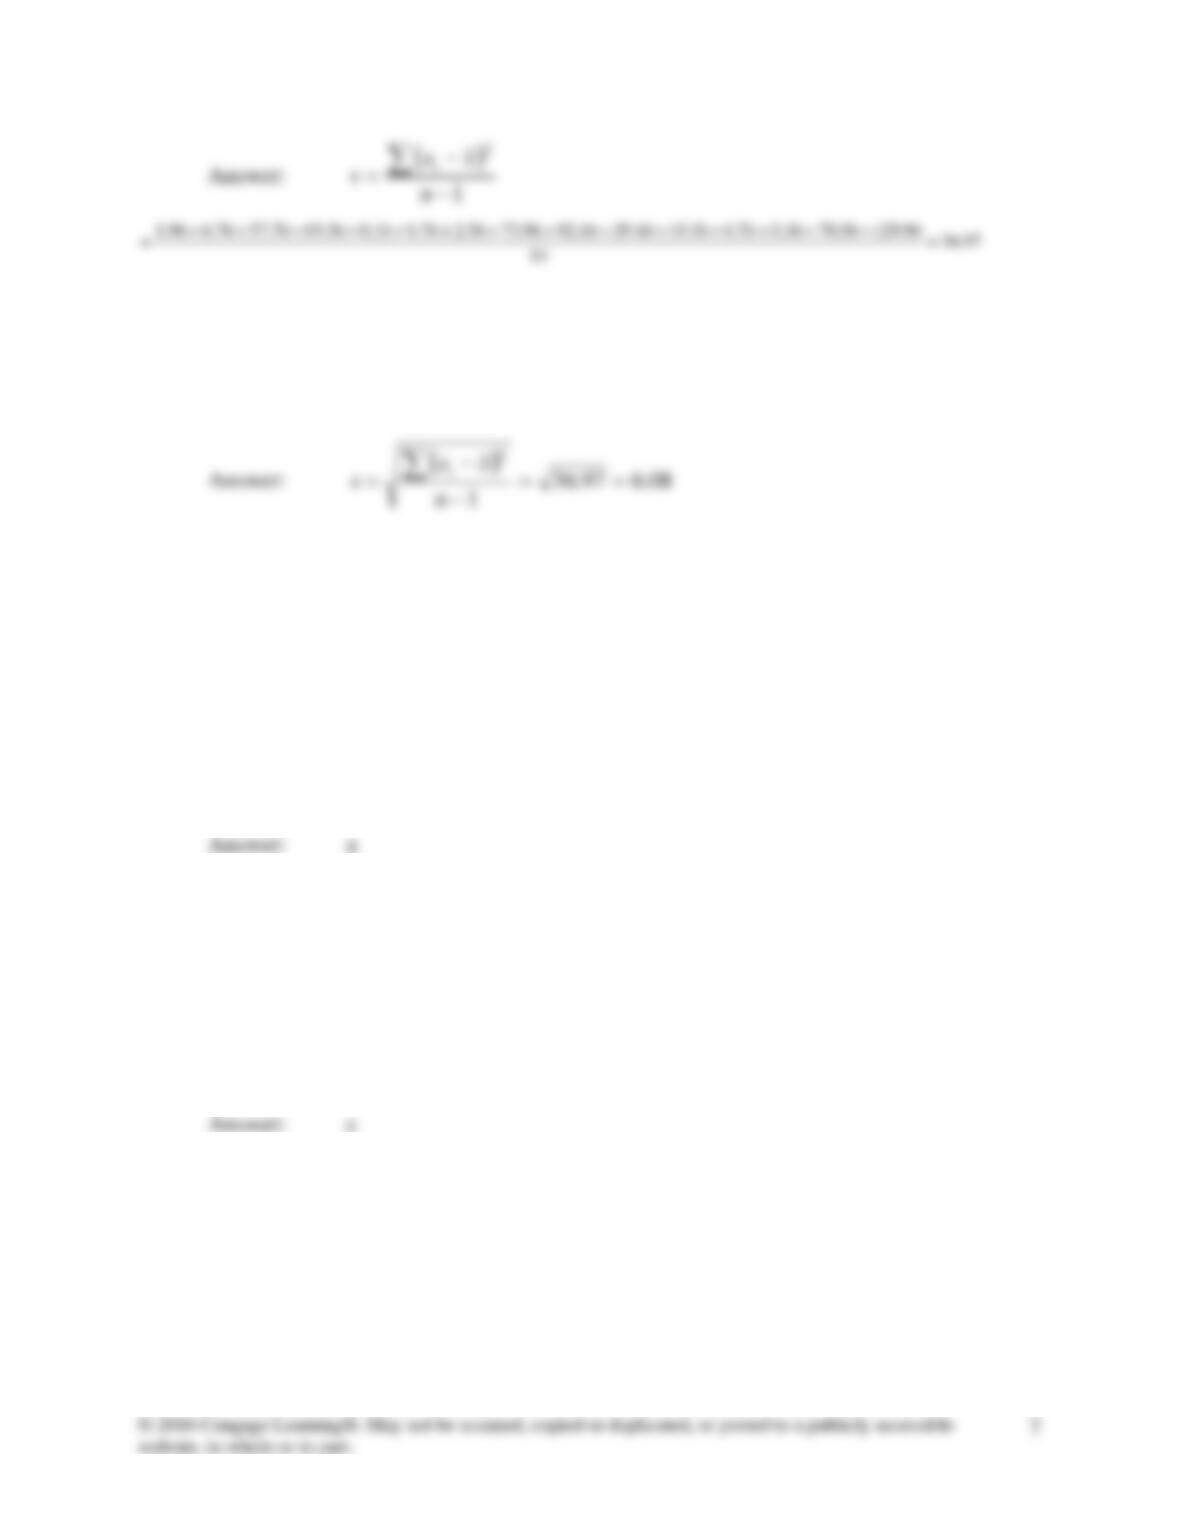
27. A list of temperature readings (in degrees Fahrenheit) is shown below. Calculate the
variance for these data:
72, 76, 81, 69, 73, 76, 75, 82, 83, 68, 69, 76, 74, 65, 62
Test Bank Engineering Fundamentals, 5th ed. Chapter 19
28. A list of temperature readings (in degrees Fahrenheit) is shown below. Calculate the
standard deviation for these data:
72, 76, 81, 69, 73, 76, 75, 82, 83, 68, 69, 76, 74, 65, 62
29. A probability distribution shows the probability values for the occurrence of the outcomes of
an experiment. A probability distribution that has a bell-shaped curve is called a normal
distribution.
a. True
b. False
30. For any probability distribution, the sum of probabilities is always
a. 0
b. 0.5
c. 1
d. equal to the standard deviation.
31. The probability distribution for many engineering experiments is approximated by
a. the average (mean) value of the data.
b. a normal distribution.
c. the standard deviation.
d. none of the above.
Test Bank Engineering Fundamentals, 5th ed. Chapter 19
32. The detailed shape of a normal-distribution curve is determined by its mean and standard
deviation values. An experiment with a small standard deviation will produce a tall, narrow
curve; whereas a large standard deviation will result in a short, wide curve.
a. True
b. False
33. The area under a normal distribution curve should always be equal to
a. 1
b. 0
c. the standard deviation.
d. the arithmetic mean.
34. In statistics, it is customary to normalize the mean and the standard deviation values of an
experiment and work with what is called the standard normal distribution, which has a mean
value of zero and a standard deviation value of 1.
a. True
b. False
35. For normal distribution, what percentage of the data will fall in the interval of one standard
deviation above and below the mean?
a. 50%
b. 65%
c. 68%
d. 95%

36. For normal distribution, what percentage of the data will fall in the interval of two standard
deviations above and below the mean?
a. 50%
b. 65%
c. 68%
d. 95%