The test statistic in a hypothesis test for a population proportion is
a. t-value calculated from the sample
b. z-value calculated from the sample
c. F-value calculated from the sample
d. the sample proportion
NARRBEGIN: SA_100_102
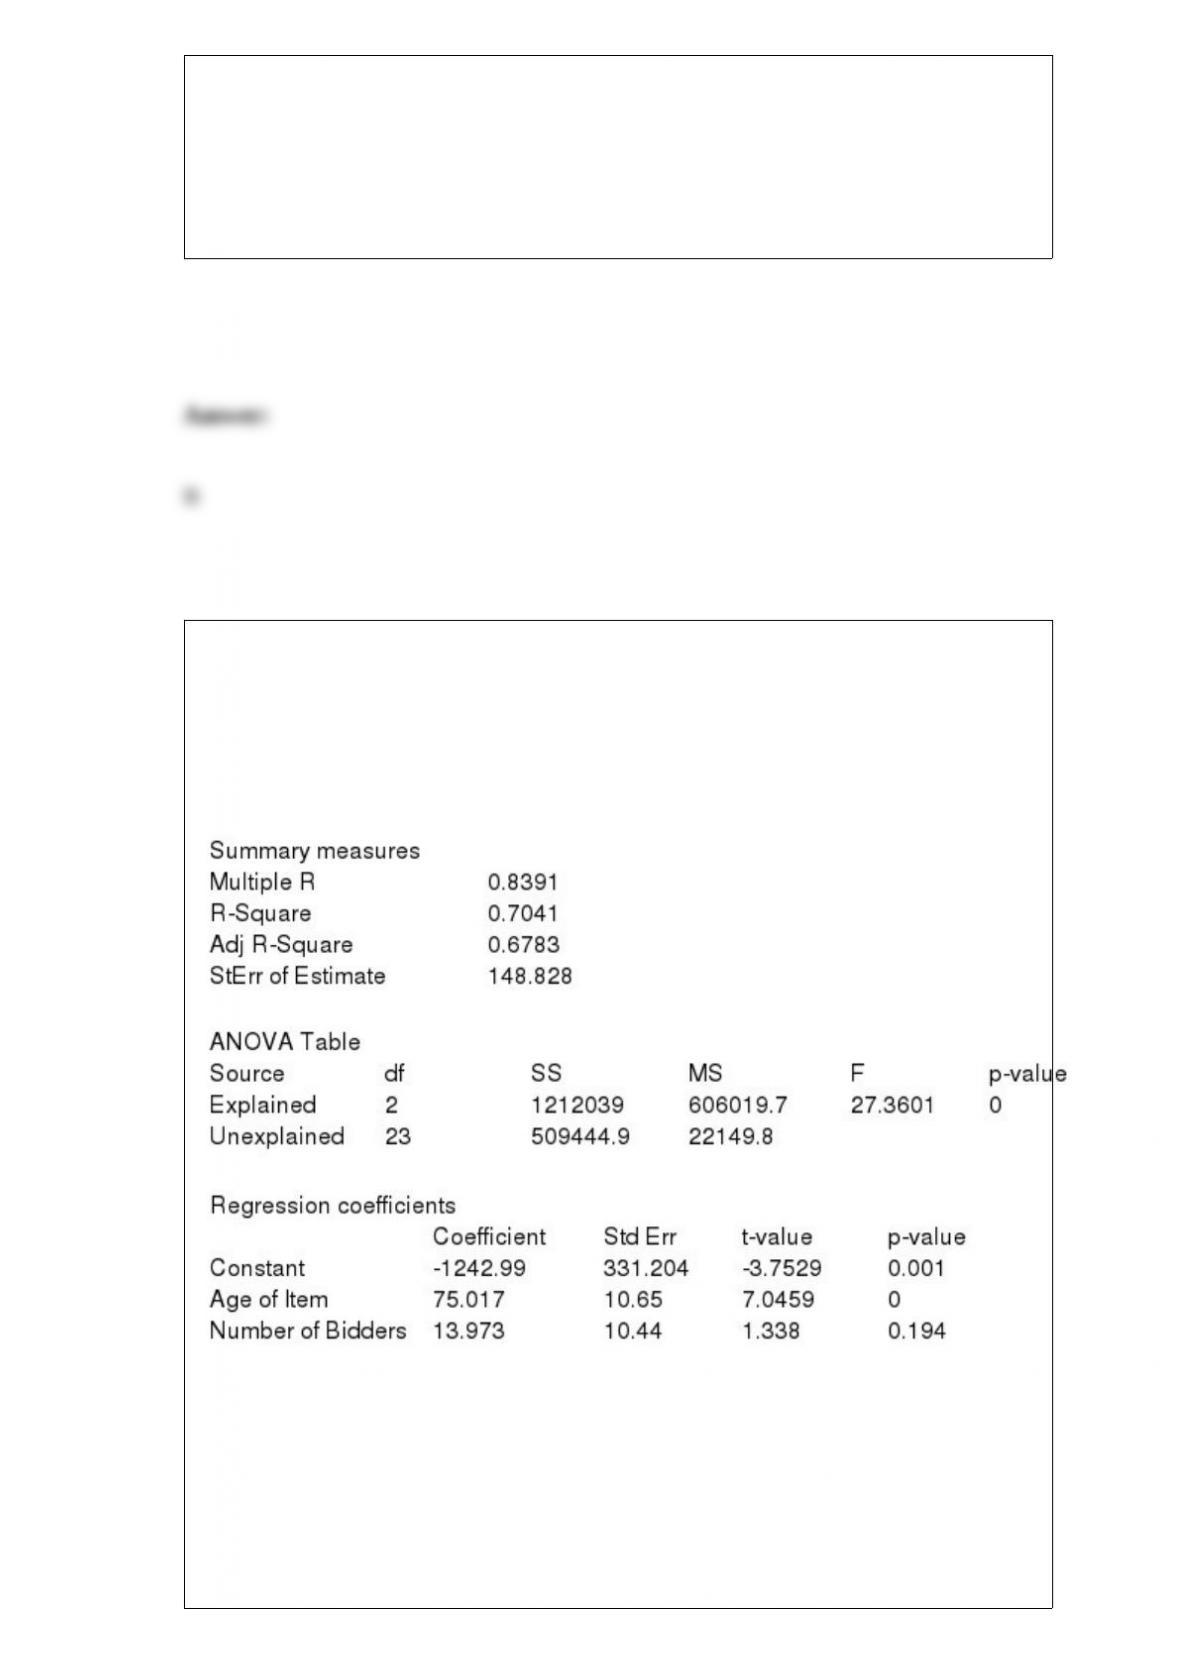
A new online auction site specializes in selling automotive parts for classic cars. The
founder of the company believes that the price received for a particular item increases
with its age (i.e., the age of the car on which the item can be used in years) and with the
number of bidders. The Excel multiple regression output is shown below.
NARREND
(A) Estimate a multiple regression model for the data.
(B) Which of the variables in this model have regression coefficients that are
statistically different from 0 at the 5% significance level?
(C) Given your findings in (B), which variables, if any, would you choose to remove
from the model estimated in (A)? Explain your decision.
Which of the following definitions best describes parsimony?
a. Explaining the most with the least
b. Explaining the least with the most
c. Being able to explain all of the change in the response variable
d. Being able to predict the value of the response variable far into the future

The most common form of autocorrelation is positive autocorrelation, in which:
a. large observations tend to follow both large and small observations
b. small observations tend to follow both large and small observations
c. large observations tend to follow large observations and small observations tend to
follow small observations
d. large observations tend to follow small observations and small observations tend to
follow large observations
In linear regression, we fit the least squares line to a set of values (or points on a
scatterplot). The distance from the line to a point is called the:
a. fitted value
b. residual
c. correlation
d. covariance
e. None of these options
NARRBEGIN: SA_96_100
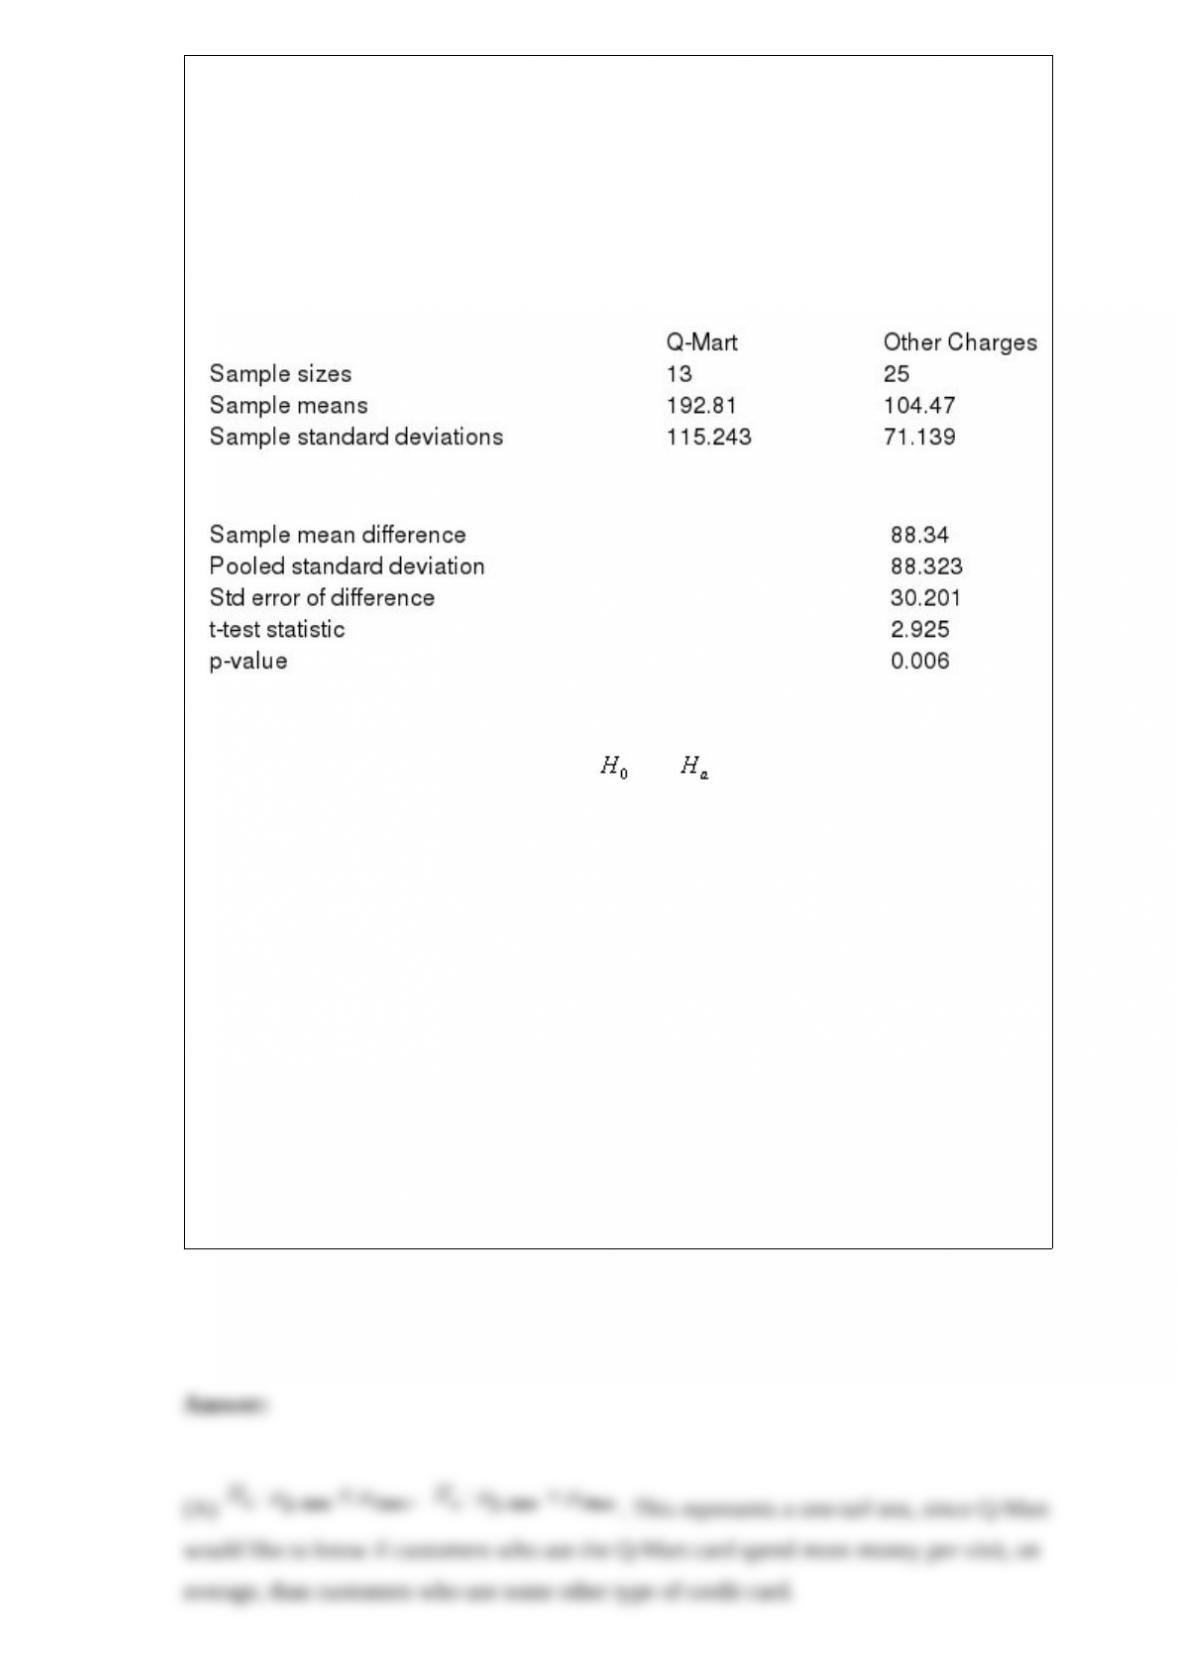
Q-Mart is interested in comparing customers who used its own charge card with those
who use other types of credit cards. Q-Mart would like to know if customers who use
the Q-Mart card spend more money per visit, on average, than customers who use some
other type of credit card. They have collected information on a random sample of 38
charge customers and the data is presented below. On average, the person using a
Q-Mart card spends $192.81 per visit and customers using another type of card spend
$104.47 per visit.
Summary statistics for two samples
Test of difference = 0
NARREND
(A) Given the information above, what is and for this comparison? Also, does
this represent a one-tailed or a two-tailed test? Explain your answer.
(B) What are the degrees of freedom for the t-statistic in this calculation? Explain how
you would calculate the degrees of freedom in this case.
(C) What is the assumption in this case that allows you to use the pooled standard
deviation for this test?
(D) Using a 5% level of significance, is there sufficient evidence for Q-Mart to
conclude that customers who use the Q-Mart card charge, on average, more than those
who use another charge card? Explain your answer.
(E) Using a 1% level of significance, is there sufficient evidence for Q-Mart to
conclude that customers who use the Q-Mart card charge, on average, more than those
who use another charge card? Explain your answer.
NARRBEGIN: SA_84_87
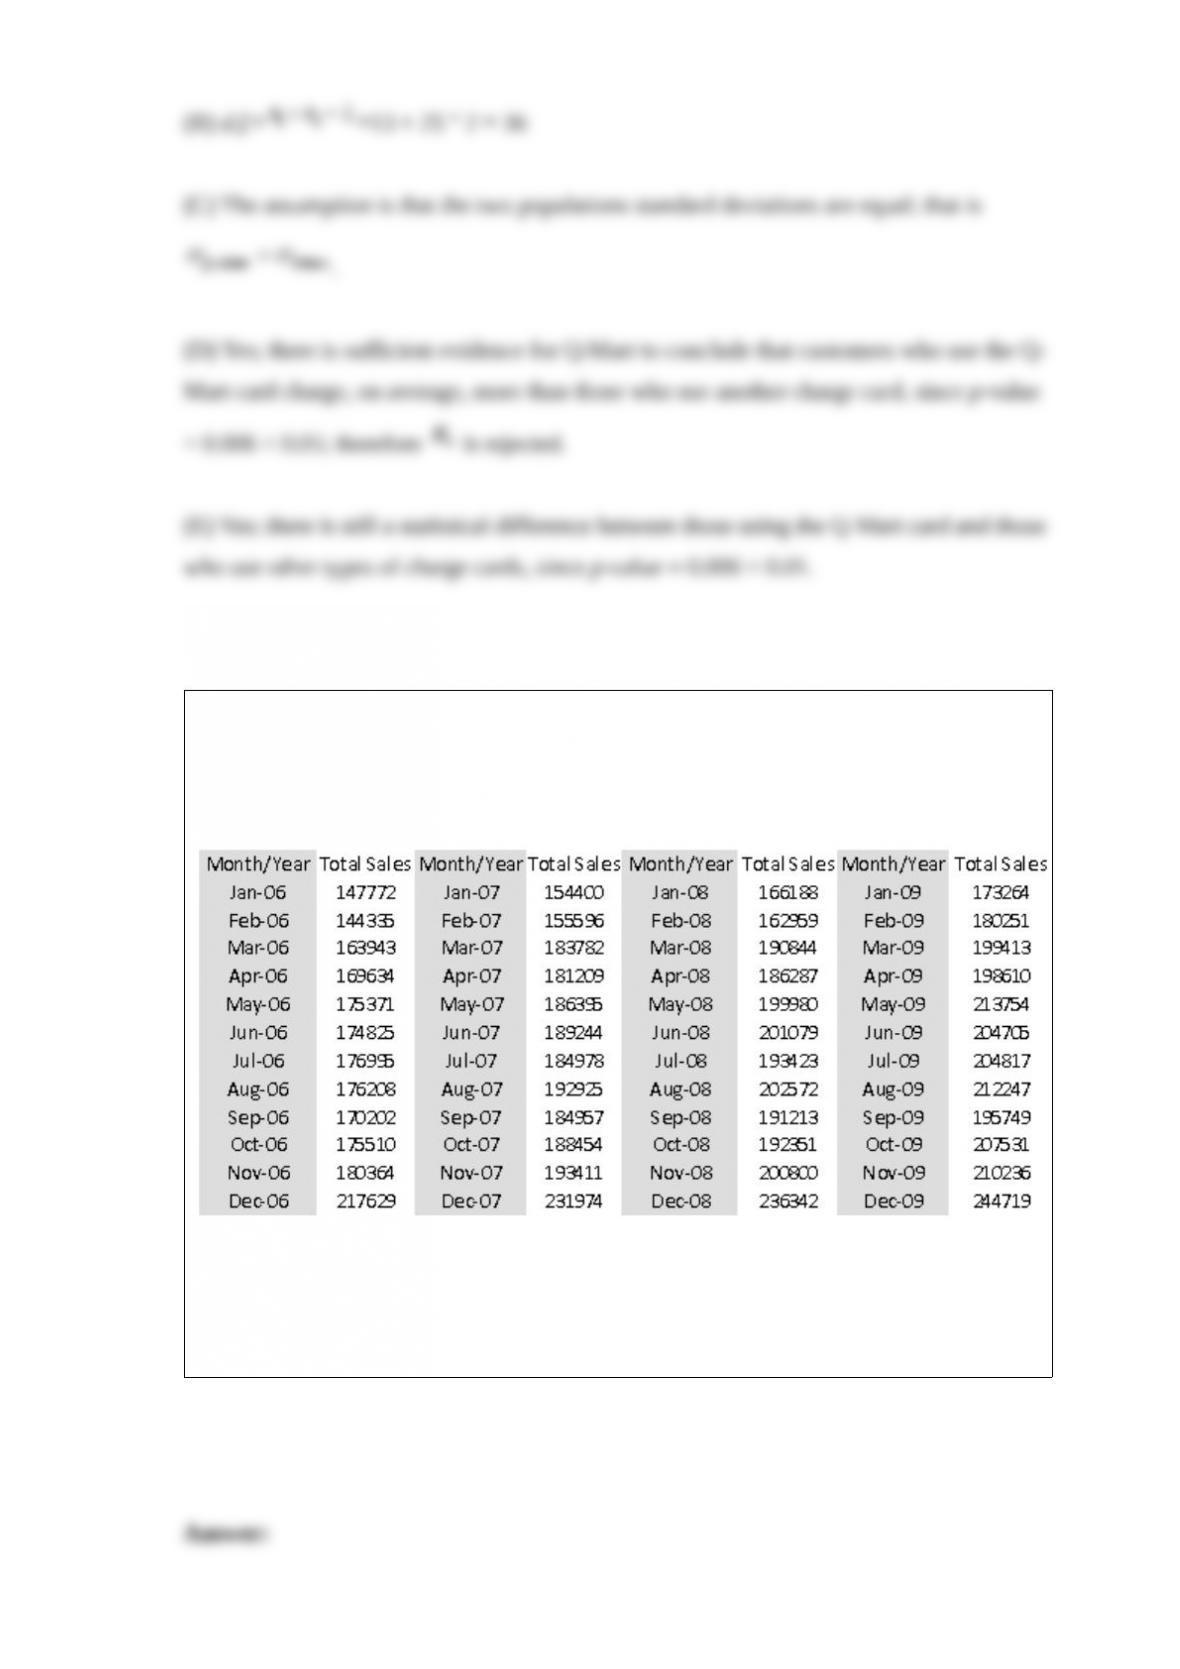
The data shown below contains total monthly retail sales (in dollars) a small sporting
goods store for the years 2006-2008.
NARREND
Obtain a time series graph of the data. If you will be using a moving average model of
the data, what information does this graph provide to help specify such a model?

NARRBEGIN: SA_112_116
Suppose that the average weekly earnings for employees in general automotive repair
shops is $450, and that the standard deviation for the weekly earnings for such
employees is $50. A sample of 100 such employees is selected at random.
NARREND
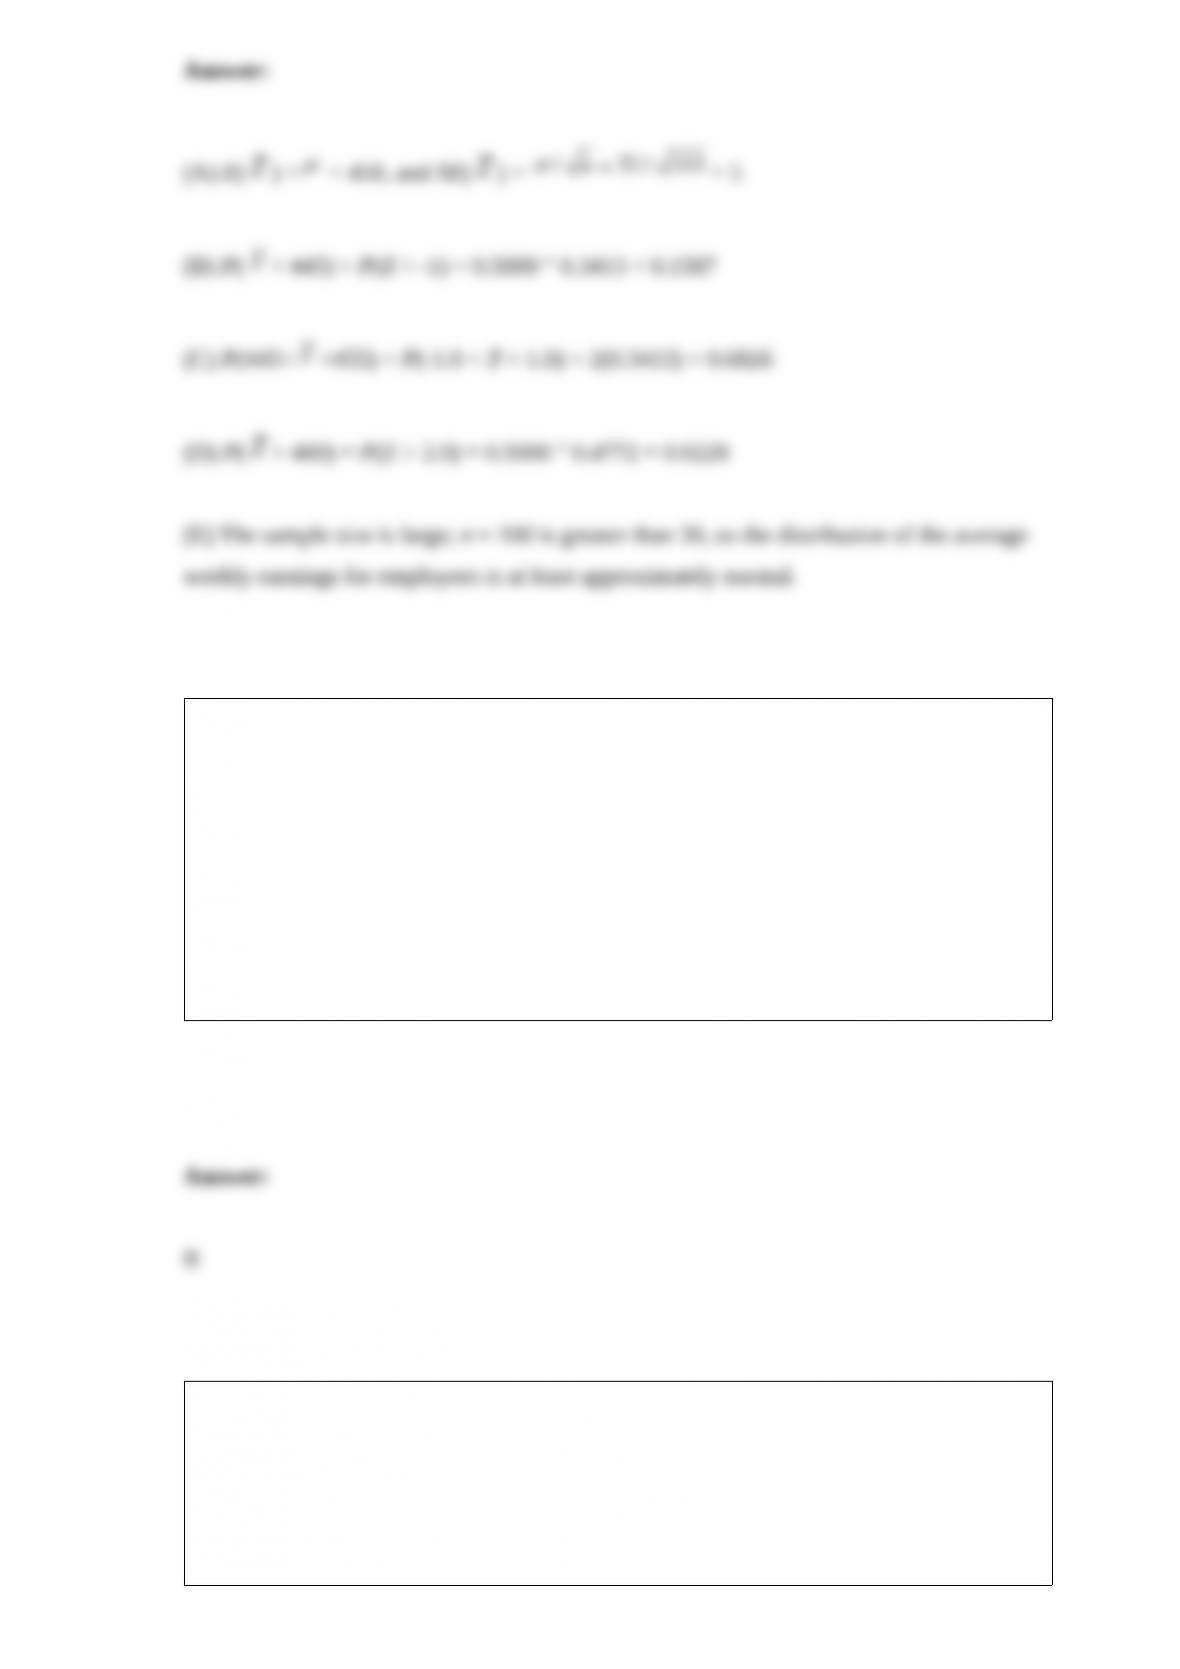
(A) Find the mean and standard deviation of the sampling distribution of the average
weekly earnings in the sample.
(B) Find probability that the mean of the sample is less than $445.
(C) Find the probability that the mean of the sample is between $445 and $455.
(D) Find the probability that the mean of the sample is greater than $460.
(E) Explain why the assumption of normality about the distribution of the average
weekly earnings for employees was not involved in the answers to (A) through (D).
Which of the following distributions is most likely to be used to develop a simulation
model for estimating the time until failure of a product in a simulation model?
a. Binomial
b. Gamma
c. Normal
d. Chi-square
A perfect straight line sloping downward would produce a correlation coefficient equal
to
a. +1
b. “1

c. 0
d. +2
e. “2
The general form of a confidence interval is:
a. Point Estimate = Multiple Standard Error
b. Point Estimate = Multiple +Standard Error
c. Point Estimate Multiple Standard Error
d. Point Estimate = Multiple Standard Error
Which of the following is not one of the summary measures for forecast errors that is
commonly used?
a. MAE (mean absolute error)
b. MFE (mean forecast error)
c. RMSE (root mean square error)
d. MAPE (mean absolute percentage error)

When using exponential smoothing, a smoothing constant must be used. The value
for :
a. ranges between 0 and 1
b. ranges between “1 and +1
c. equals the largest observed value in the series
d. represents the strength of the association between the forecasted and observed values
The mean of a probability distribution is a:
a. measure of variability of the distribution
b. measure of central location
c. measure of relative likelihood
d. measure of skewness of the distribution
We sometimes use discrete distributions in place of continuous distributions:
a. because they are more accurate.
b. because they are more simple.
c. when we don”t know the mean and variance of the distribution.
d. when we need to generate a histogram
One-tailed alternatives are phrased in terms of:
a.
b. < or >
c. =
d.
In linear regression, the fitted value is the:
a. predicted value of the dependent variable
b. predicted value of the independent value

c. predicted value of the slope
d. predicted value of the intercept
e. None of these options
Correlation is a summary measure that indicates:
a. a curved relationship among the variables
b. the rate of change in Y for a one unit change in X
c. the strength of the linear relationship between pairs of variables
d. the magnitude of difference between two variables
A continuous probability distribution is characterized by a:
a. mean and a standard deviation.
b. mean and a variance.
c. density function.
d. histogram

Many organizations must determine how to schedule employees to provide adequate
service. If we assume that an organization faces the same situation each week, this is
referred to as
a. static scheduling problem
b. dynamic scheduling problem
c. transportation scheduling problem
d. All of these options
NARRBEGIN: SA_84_86
An oil company produces oil at two wells. Well 1 can produce up to 150,000 barrels per
day, and well 2 can produce up to 200,000 barrels per day. It is possible to ship oil
directly from the wells to customers in Los Angeles and New York. Alternatively, the
company could transport oil to the ports of Mobile and Galveston and then ship it by
tanker to New York or Los Angeles. Los Angeles requires 160,000 barrels per day, and
New York requires 140,000 barrels per day. The costs (in dollars) of shipping 1000
barrels between various locations are shown below:
NARREND
(A) Assume that before being shipped to Los Angeles or New York, all oil produced at
the wells must be refined at either Mobile or Galveston. To refine 10000 barrels of oil
costs $12 at Mobile and $10 at Galveston. Assuming that both Mobile and Galveston
have infinite refinery capacity, determine how to minimize the daily cost of transporting
and refining the oil requirements of Los Angeles and New York.
(B) Rework (A) under the assumption that Galveston has a refinery capacity of 150,000
barrels per day, and Mobile has a refinery capacity of 180,000 barrels per day.
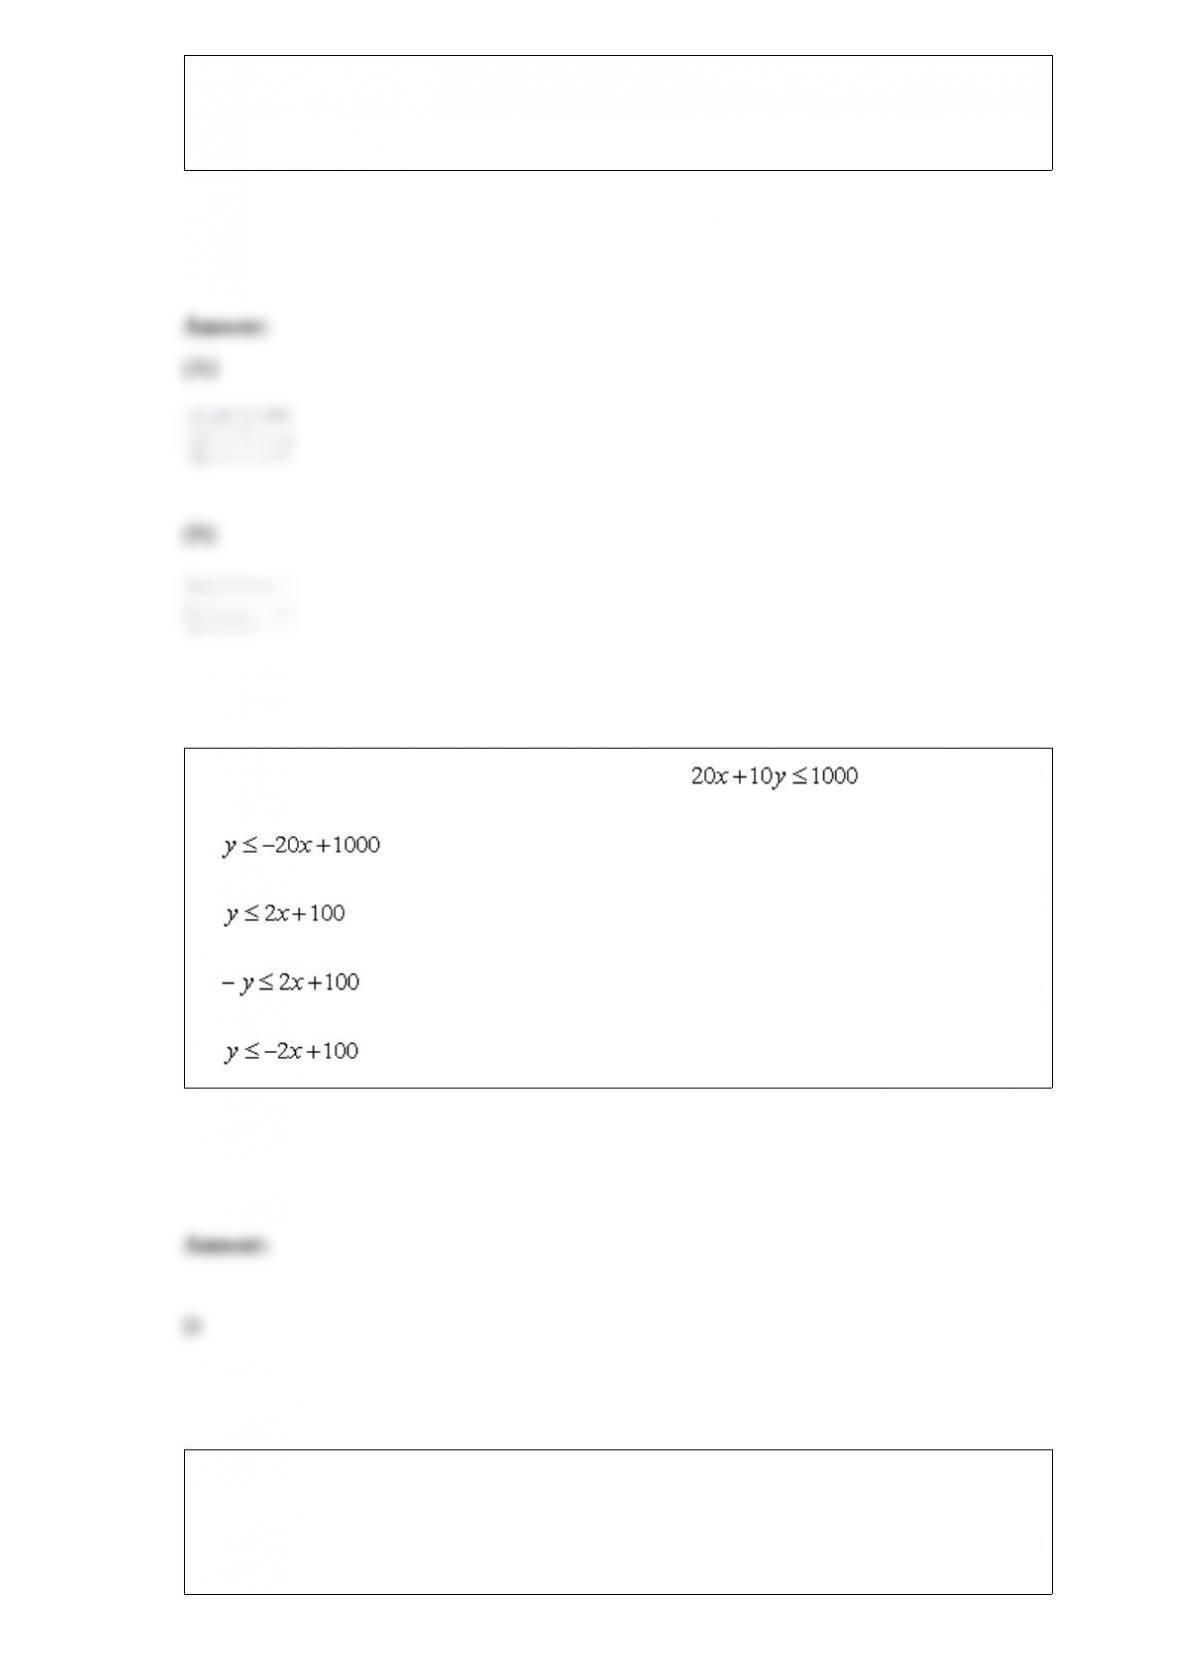
The equation of the line representing the constraint is:
a.
b.
c.
d.
Related to the runs test, if T is reasonably large (T > 20 is suggested), then the statistic
can be used to perform this test.
a. F

b. t
c. Z
d.
The idea behind the runs test is that a random number series should have a number of
runs that is:
a. large
b. small
c. not large or small
d. constant
Which probability distribution applies to the number of events occurring within a
specified period of time or space
a. Binomial distribution
b. Poisson distribution
c. Any discrete probability distribution
d. Any continuous probability distribution
Simulation models are particularly useful for:
a. forecasting.
b. obtaining deterministic outputs.
c. evaluating constraints.
d. asking what-if questions.
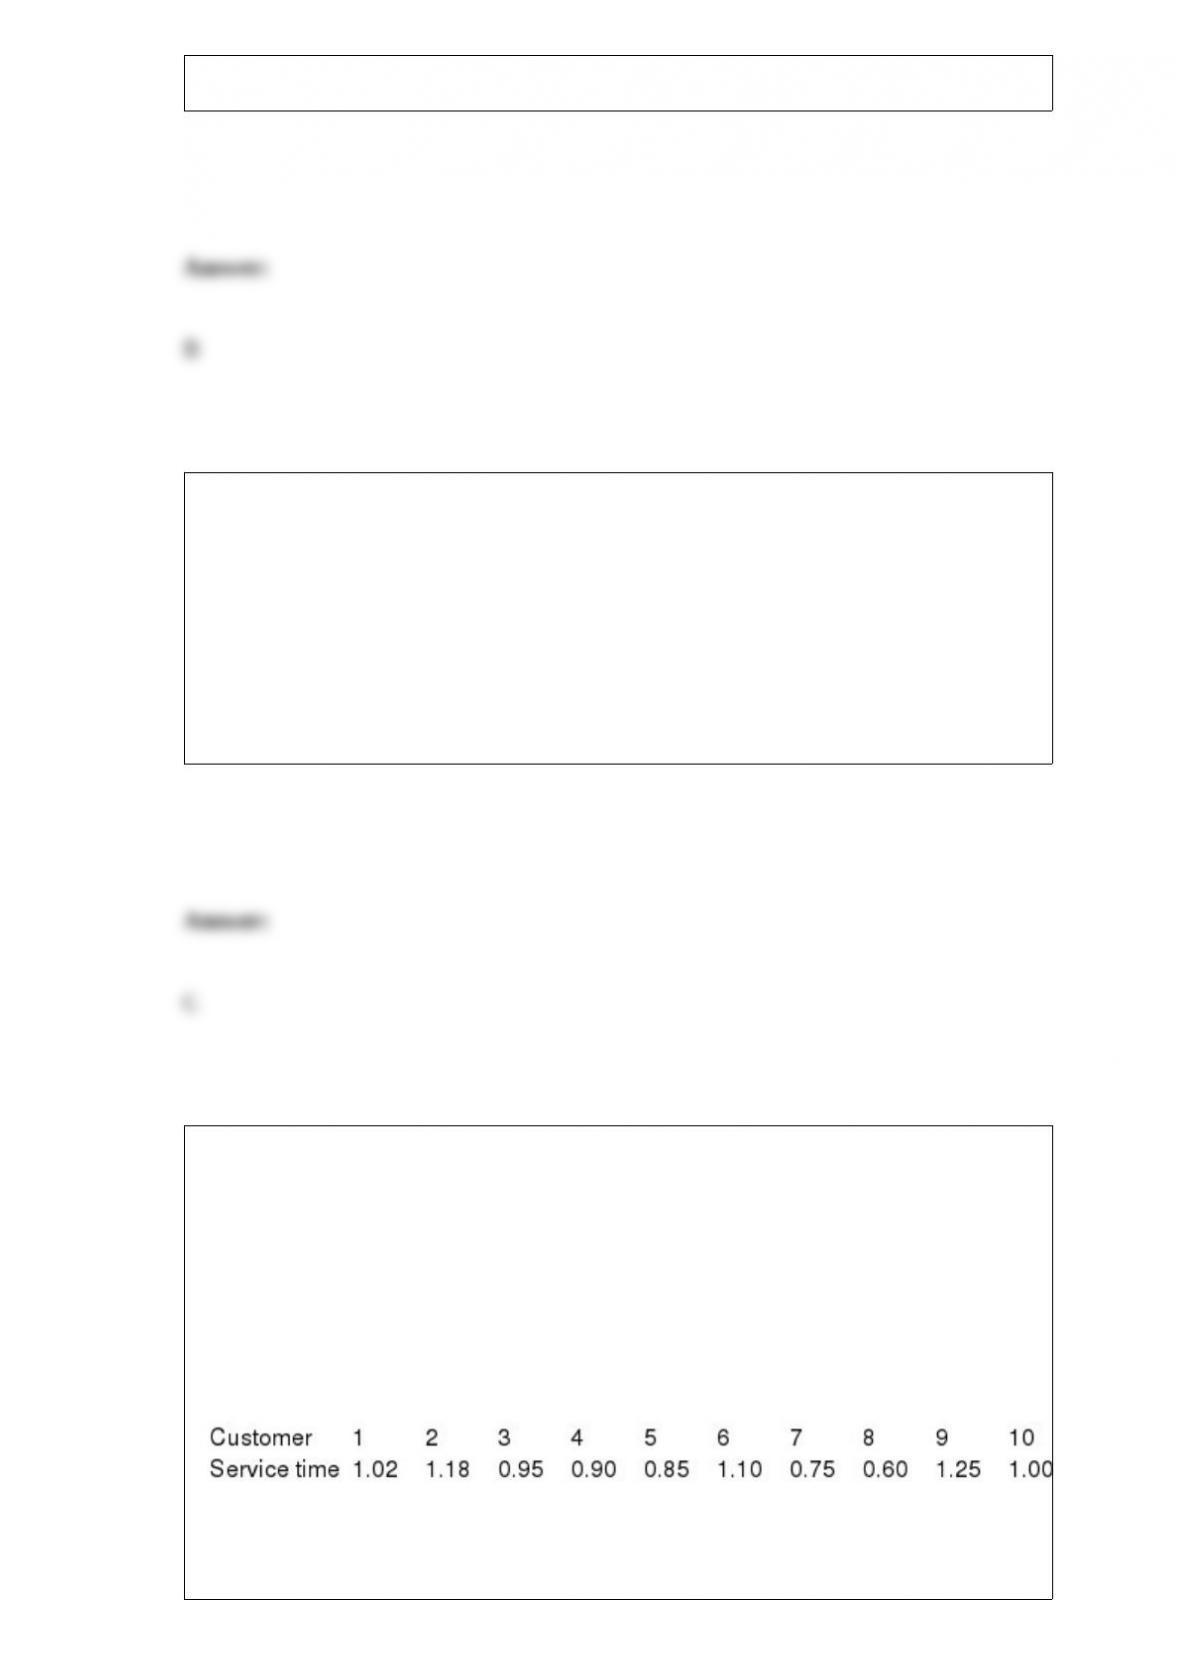
NARRBEGIN: SA_106_109
The manager of a local fast-food restaurant is interested in improving service provided
to customers who use the restaurant’s drive-up window. As a first step in the process,
the manager asks his assistant to record the time (in minutes) it takes to serve a large
number of customers at the final window in the facility’s drive-up system. The given
frame in this case is 200 customer service times observed during the busiest hour of the
day for this fast-food restaurant. The frame of 200 service times yielded a mean of
0.881. A simple random sample of 10 from this frame is presented below.
NARREND
(A) Compute the point estimate of the population mean from the sample above. What is

the sampling error in this case? Assume that the population consists of the given 200
customer service times.
(B) Compute the point estimate of the population standard deviation from the sample
above.
(C) Should you use the finite population correction (fpc) factor to estimate the standard
error of ? Explain. If your answer is yes, what is the value of the fpc?
(D) Determine a good approximation to the standard error of the mean in this case.
Many organizations must determine how to schedule employees to provide adequate
service. If we assume that an organization faces the same situation each week, this is
referred to as
a. static scheduling problem
b. dynamic scheduling problem
c. transportation scheduling problem
d. All of these options
If data is stored in a database package, which of the following terms are typically used?
a. Fields and records
b. Cases and columns
c. Variables and samples
d. Variables and observations
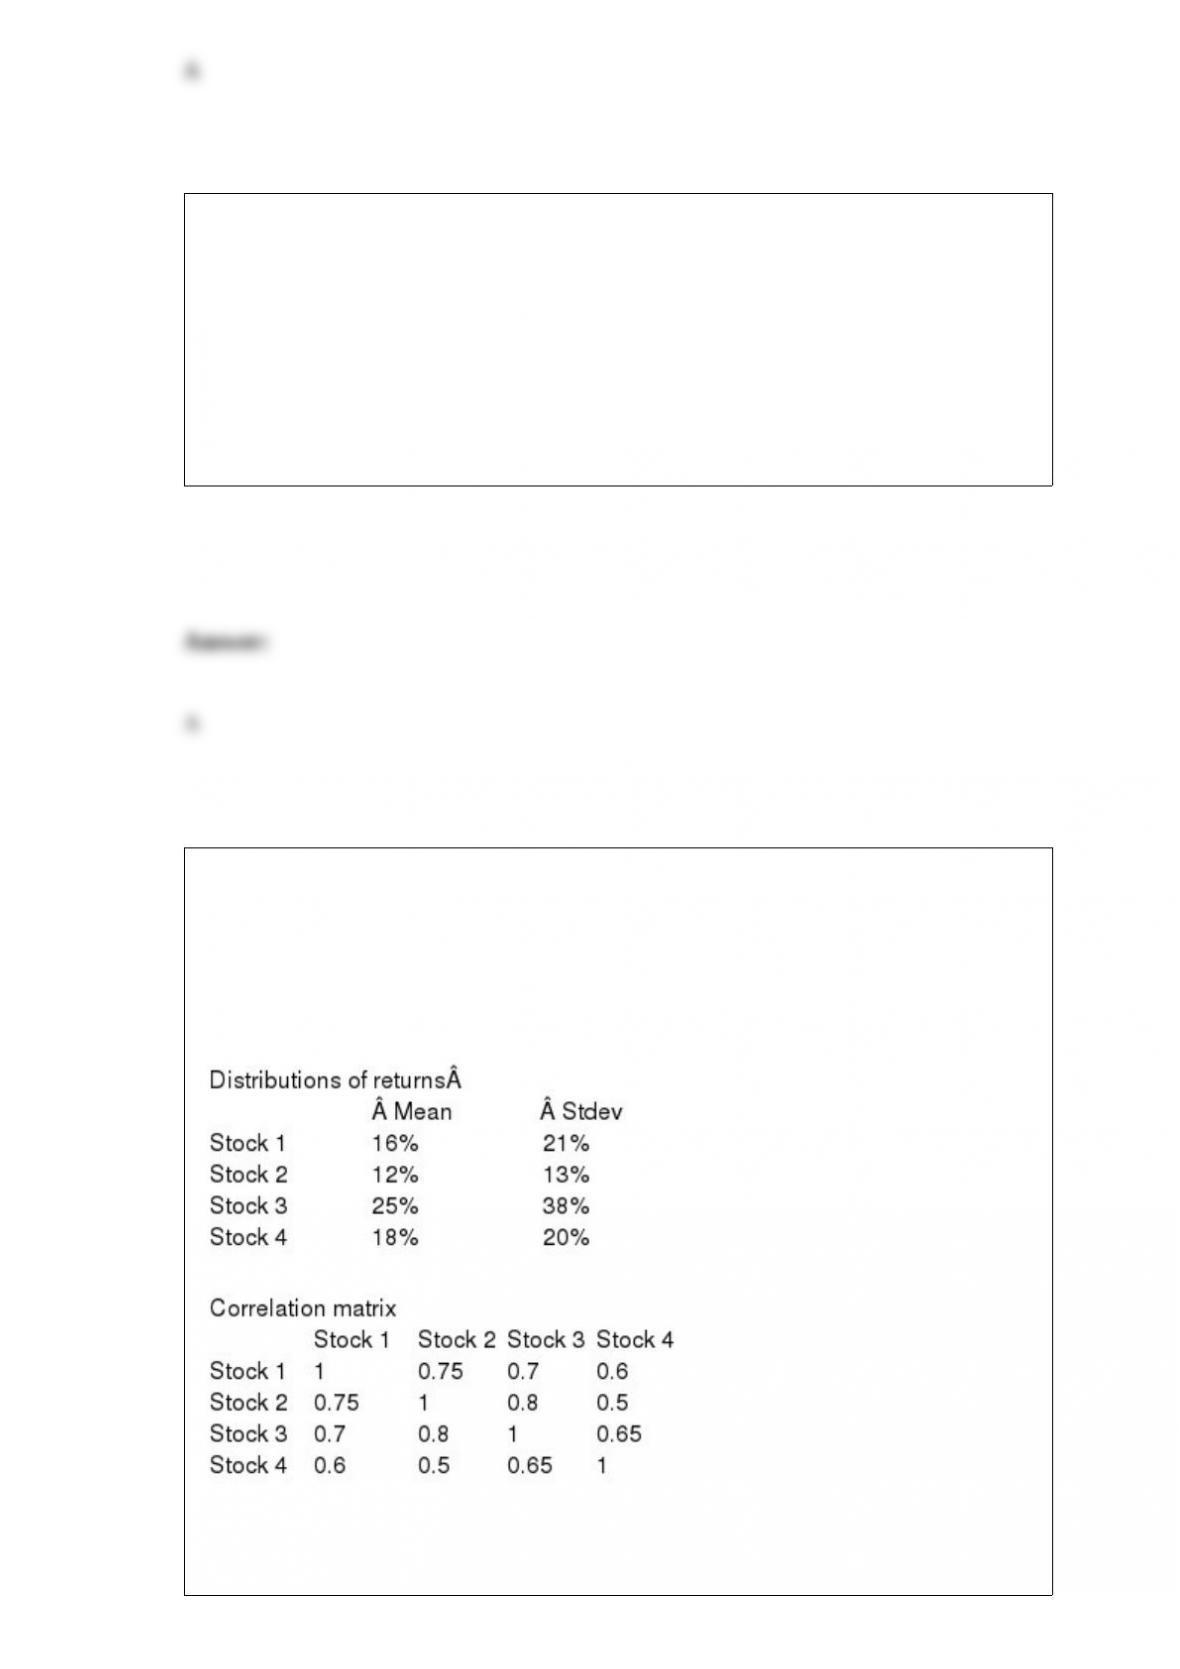
NARRBEGIN: SA_89_92
Suppose that Mrs. Smart invested 25% of her portfolio in four different stocks. The
mean and standard deviation of the annual return on each stock are shown in the first
table below. The correlations between the annual returns on the four stocks are shown
in the second table below.
NARREND
(A) Use @Risk with 100 replications, provide a summary statistics of portfolio return;
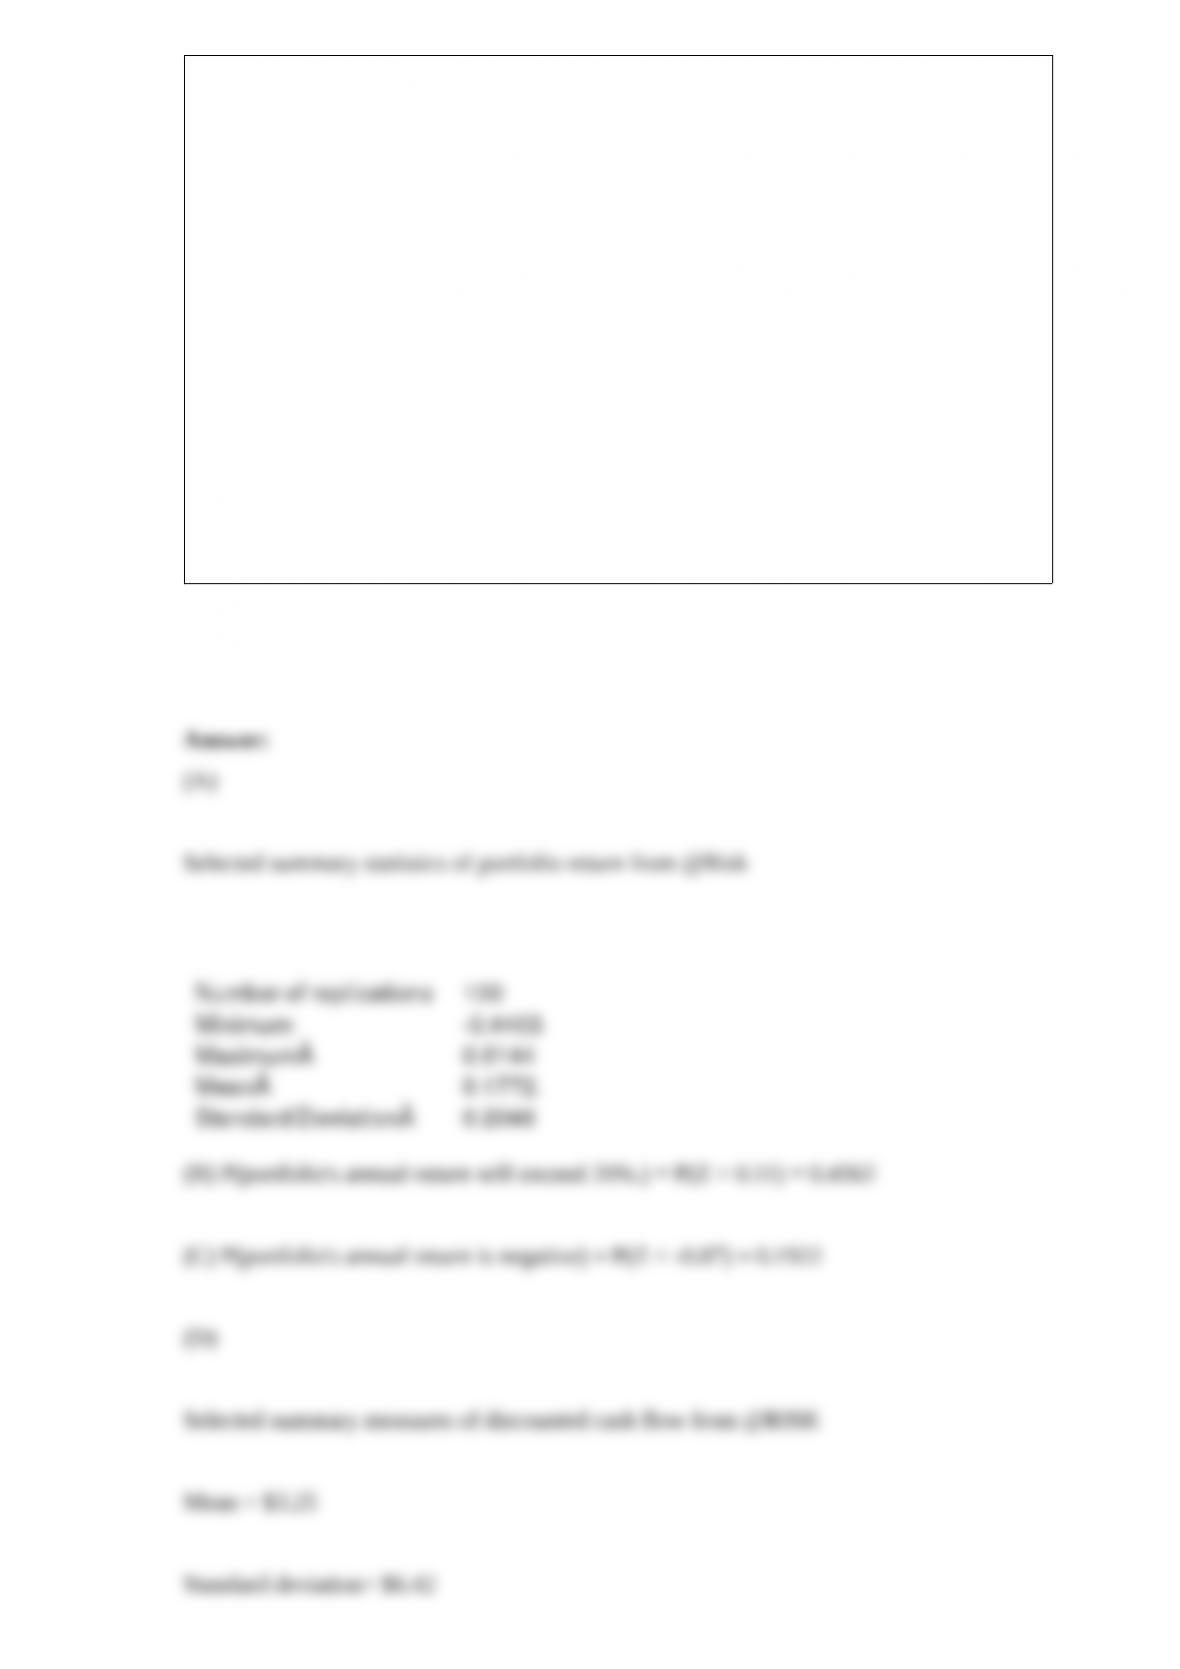
namely, minimum, maximum, mean, and standard deviation.
(B) Use your answers to (A) to estimate the probability that Mrs. Smart’s portfolio’s
annual return will exceed 20%.
(C) Use your answers to (A) to estimate the probability that Mrs. Smart’s portfolio will
lose money during the course of a year.
(D) Suppose that the current price of each stock is as follows: stock 1: $16; stock 2:
$18; stock 3: $20; and stock 4: $22. Mrs. Smart has just bought an option involving
these four stocks. If the price of stock 1, six months from now are is $18 or more, the
option enables Mrs. Smart to buy, if she desires, one share of each stock for $20 six
months from now. Otherwise the option is worthless. For example, if the stock prices
six months from now are: stock 1: $18; stock 2: $20; stock 3: $21; and stock 4: $24,
then Mrs. Smart would exercise her option to buy stocks 3 and 4 and receive (21- 20) +
(24-20) = $5 in each cash flow. How much is this option worth if the risk-free rate is
8%?

In a minimum cost network flow model, the flow balance constraint for each
demandnode takes the form
a. Flow out Flow in + Net supply
b. Flow in Flow out + Net demand
c. Flow in = Flow out
d. Flow in Flow out + Net demand
e. Flow out Flow in + Net demand
The opportunity for sampling error is decreased by:
a. larger sample sizes
b. smaller sample sizes
c. affluent samples
d. educated samples
NARRBEGIN: SA_110_111
A university bookstore manager is mildly concerned about the number of textbooks that
were under-ordered and thus unavailable two days after the beginning of classes. The
manager instructs an employee to pick a random number, go to the place where that
number book is shelved, examine the next 50 titles, and record how many titles are
unavailable.
NARREND
(A) Technically, this process does not yield a random sample of the books in the store.
Why not?
(B) How could a truly random sample be obtained?
The percentage of variation (R2) ranges from
a. 0 to +1
b. “1 to +1
c. “2 to +2
d. “1 to 0

Sampling done withoutreplacement means that
a. only certain members of the population can be sampled
b. each member of the population can be sampled repeatedly
c. each member of the population can be sampled only once
d. each member of the population can be sampled twice
NARRBEGIN: SA_72_81
A recent survey data collected from 1000 randomly selected Internet users. The
characteristics of the users include their gender, age, education, marital status and
annual income. Using Excel, the following pivot tables were produced.
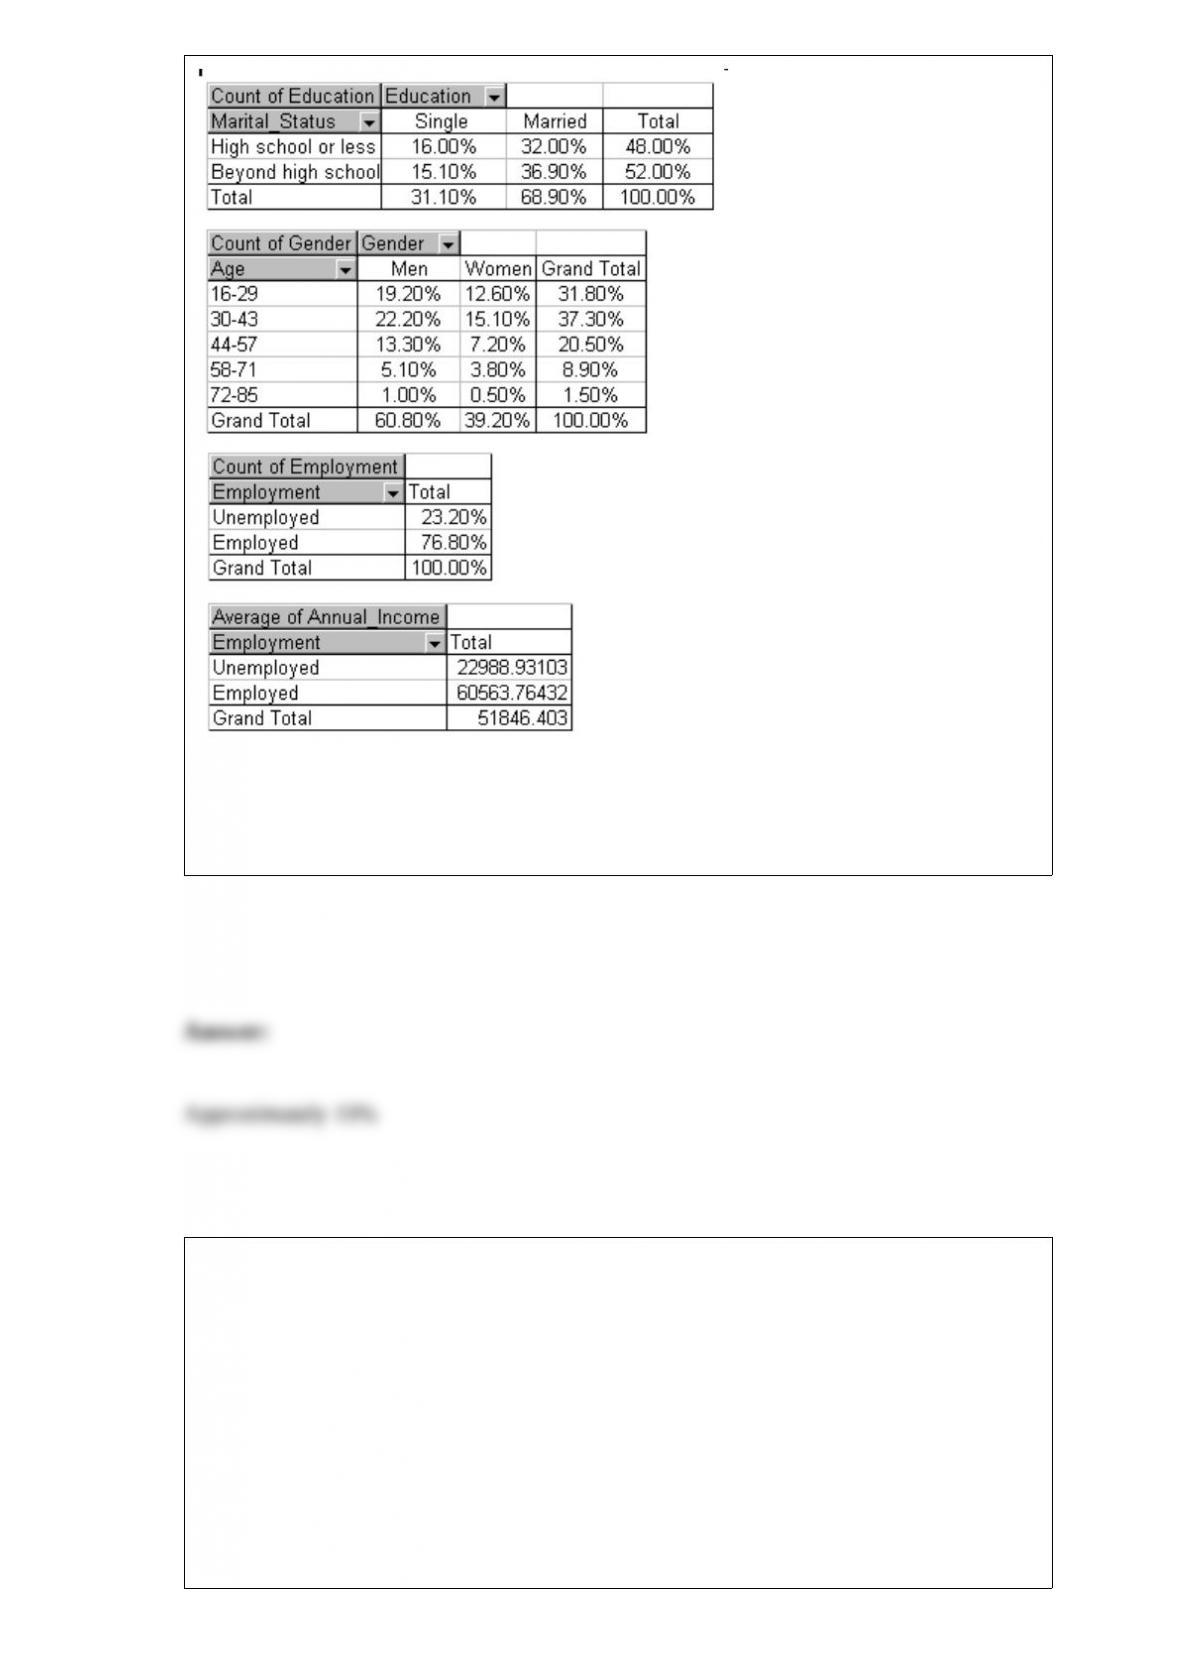
NARREND
Approximate the percentage of these Internet users who are men under the age of 30.
A company has daily staffing requirements for two types of jobs, cleaning and customer
service persons. The minimum numbers of workers required each day for each type of
job are shown in the table below. To meet these requirements, the company can employ
three types of workers: those who clean only, those who can perform customer service
only, and those who are able to do both. In each of these three categories, the company
wants to meet its daily requirements using only full-time workers. A full-time worker
must work five consecutive days with two days off. Workers who are able to perform
only one type of work (cleaning or customer service) earn $50 per day. Those who are
able to perform both types of work earn $60 per day. As a matter of policy, the company
wants to ensure that at least 20% of its total hours are staffed by “swing workers”; those
who can do both types of jobs. The company wants to find a staffing policy that covers
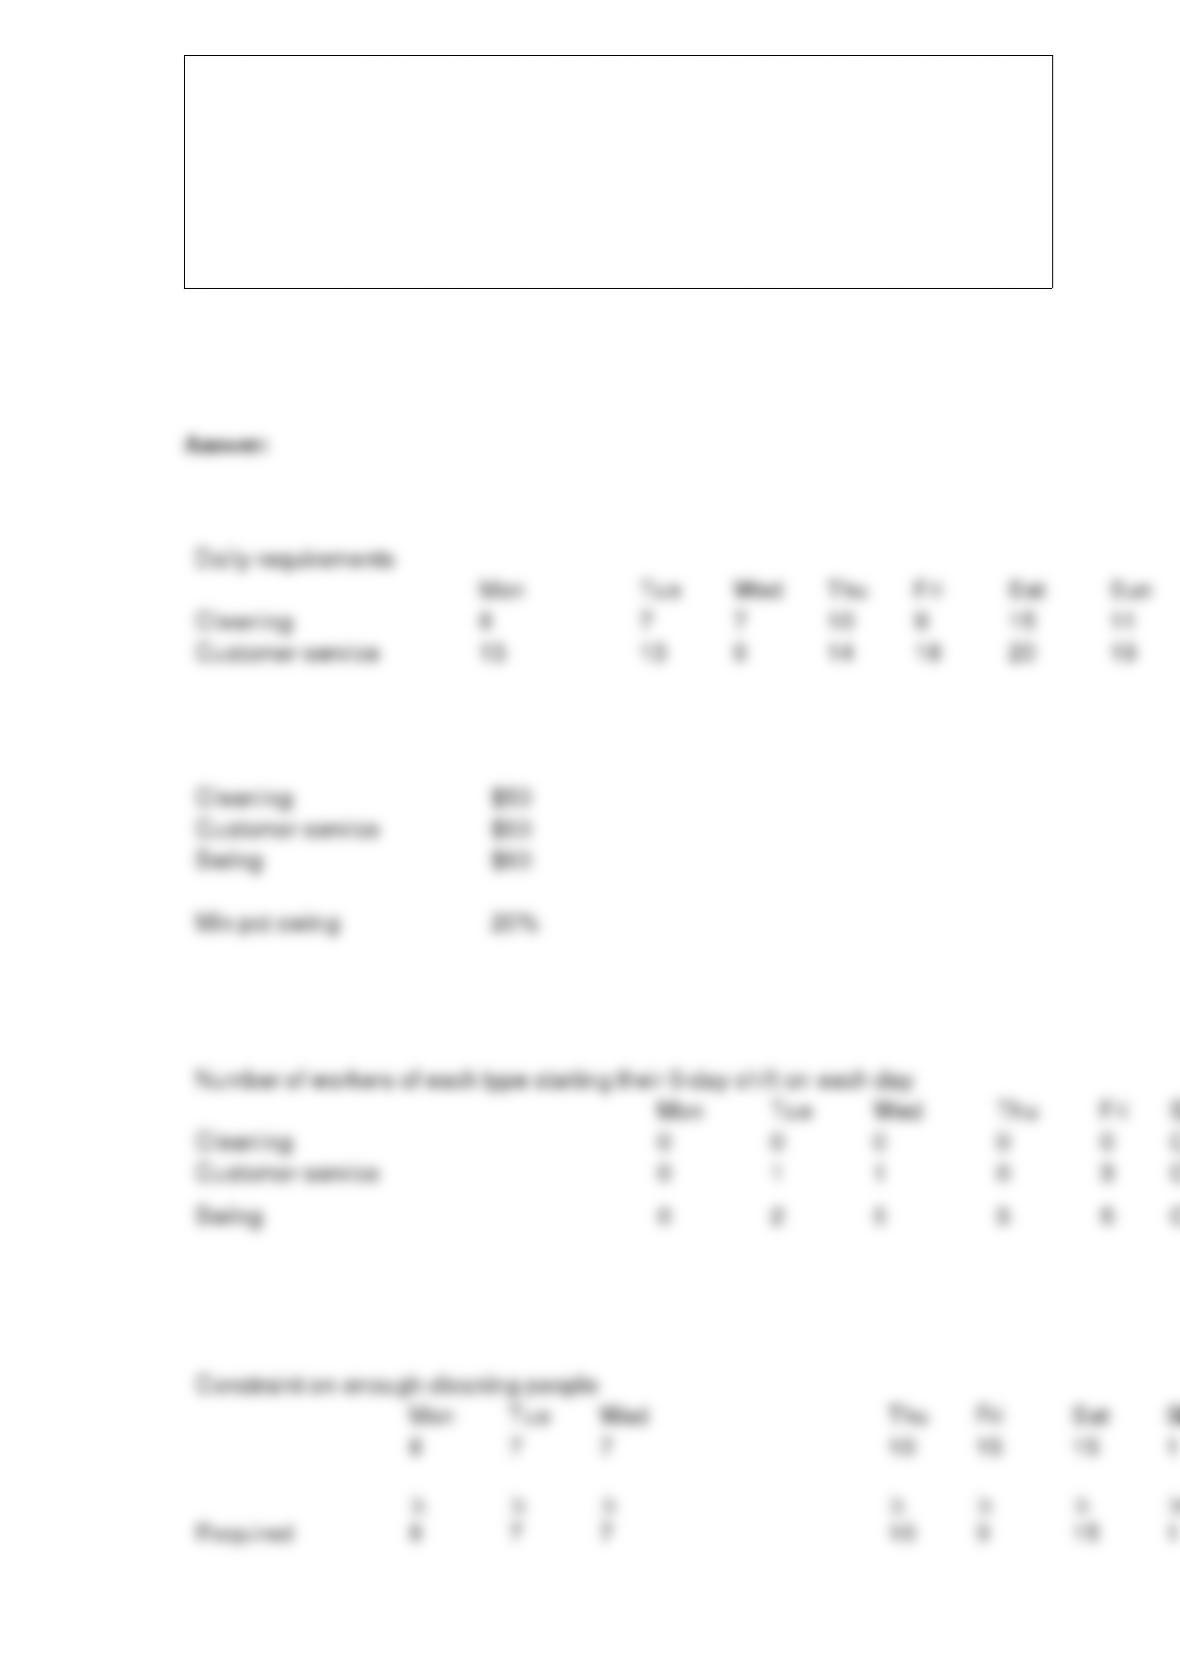
the daily worker requirements at minimum total costs per week. Use solver to formulate
and solve the company’s problem.
Type of job Mon Tue Wed Thu Fri Sat Sun
Cleaning 8 7 7 10 9 15 11
Customer service 13 13 9 14 18 20 19
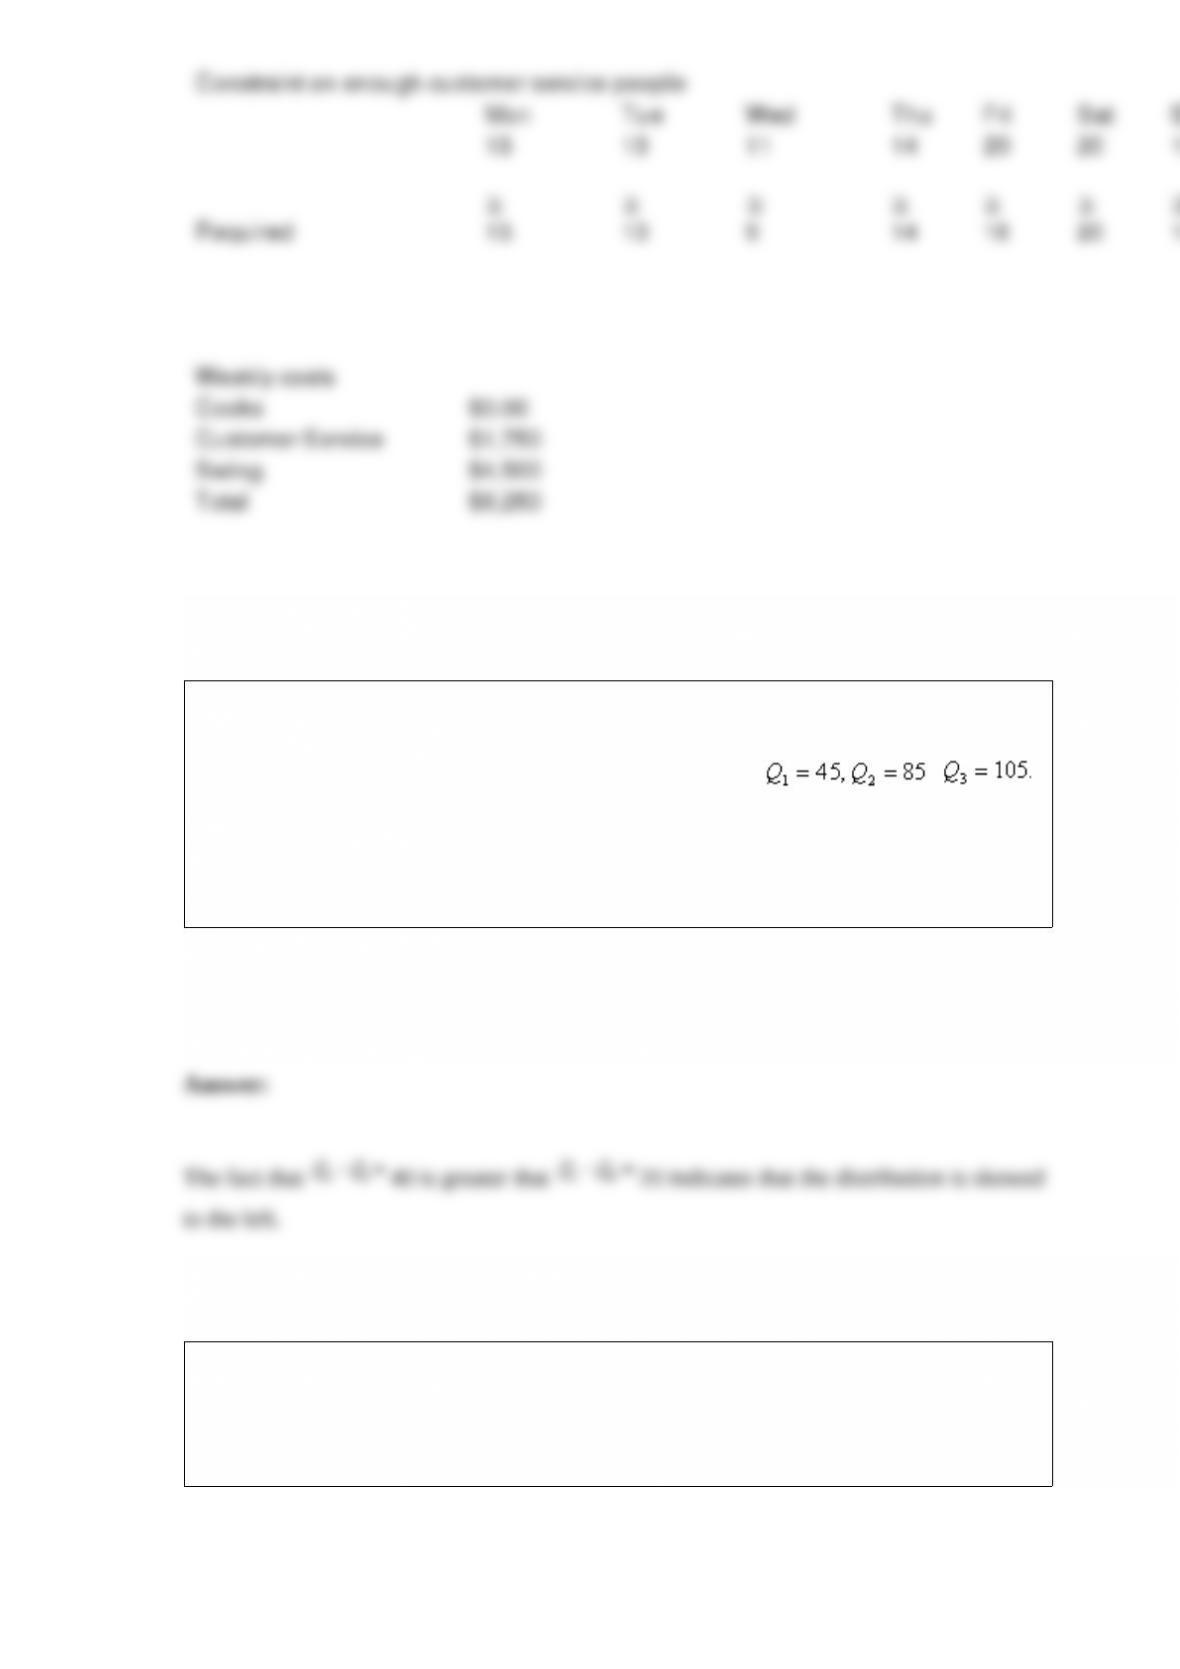
NARRBEGIN: SA_86_88
Suppose that an analysis of a set of test scores reveals that: ,
NARREND
What do these statistics tell you about the shape of the distribution?
In multiple regressions, a large value of the test statistic F indicates that most of the
variation in Y is unexplained by the regression equation and that the model is useless. A
small value of F indicates that most of the variation in Y is explained by the regression
equation and that the model is useful.

NARRBEGIN: SA_78_85
Suppose we want to choose capacity for a plant that will produce a new drug. In
particular, we want to choose the capacity that maximizes discounted expected profit
over the next 10 years. We have the following information:
Demand for the drug is expected to be normally distributed ~ Normal (50,000, 12,000).
A unit of capacity costs $16 to build.
The number of units produced will equal the demand, up to capacity limits.
The revenue per unit is $3.70 and the cost per unit is $0.20 (variable cost).
The maintenance cost per unit of capacity is $0.40 (fixed cost).
The discount rate is 10%.
NARREND
Are there any simulations which indicated there was a chance of getting negative NPV?
Briefly explain in one sentence.
The Central Limit Theorem (CLT) says that as long as the sample size is reasonably
large, there is about a 95% chance that the magnitude of the sampling error for the
mean will be no more than two standard errors.

Samples of exam scores for employees before and after a training class would be
examples of paired data
NARRBEGIN: SA_86_91
In this example we are estimating the net present value of introducing a new drug to
market. We have the following information about the market:
The market size is 1,000,000 and is projected to grow at an average 5%, with a standard
deviation of 1%, over the next ten years.
The market share captured at entry is projected to be between 20% and 70%, with most
likely value 40%.
Three competitors may enter the market in the future, with each one having a 40%
probability of entry per year.
For each new competitor per year, the market share goes down by 20%.
The marginal profit per unit is $1.80.
We want to evaluate the project over ten years, using a discount rate of 10%.
NARREND
What is the appropriate distribution for initial market size?

For each simulation what is the probability of exceeding $75,000 in NPV (approximate
these numbers as closely as possible from the data given in the above table). Please put
your answer in the following table:
The difference between the point estimate and the true value of the population
parameter being estimated is called the estimation error.
What is the average annual salary of the employed Internet users in this sample?
In marketing models of customer loyalty, we are typically interested in modeling the
rate of customer retention, called churn.
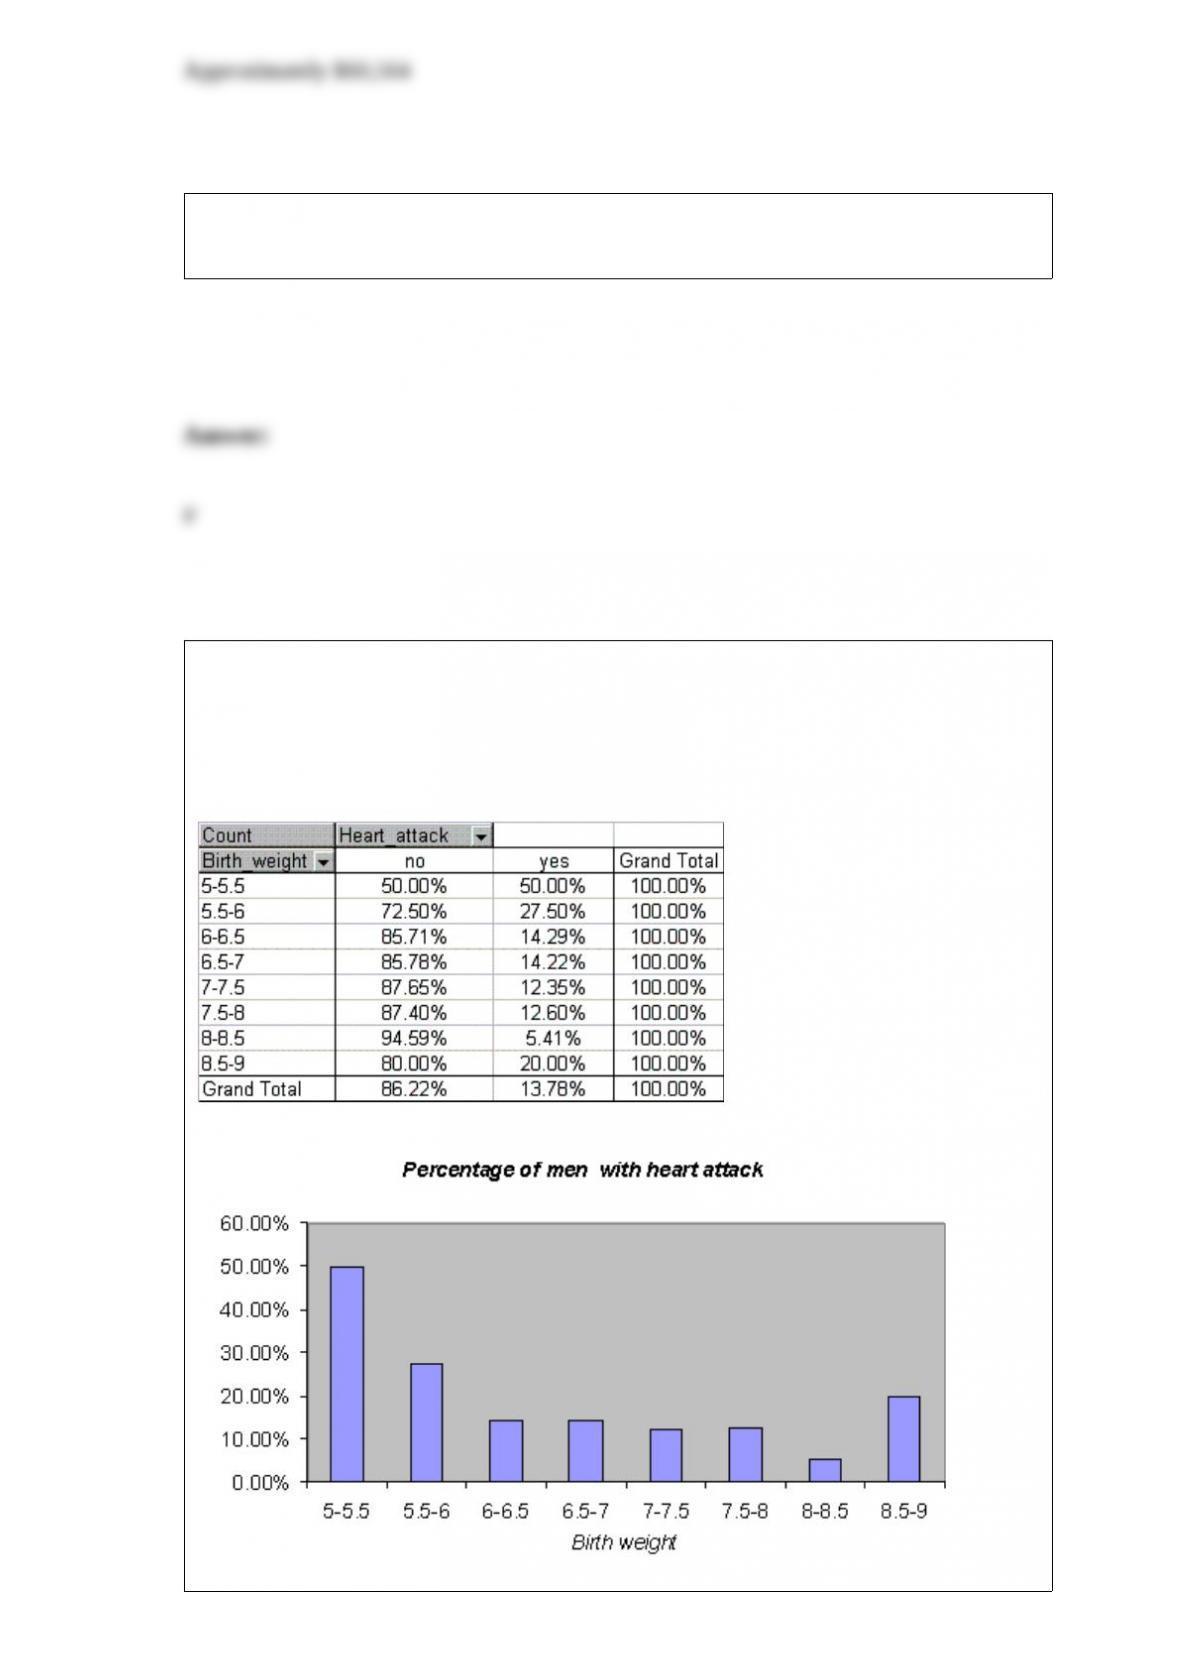
A health magazine reported that a man’s weight at birth has a significant impact on the
chance that the man will suffer a heart attack during his life. A statistician analyzed a
data set for a sample of 798 men, and produced the pivot table and histogram shown
below. Determine how birth weight influences the chances that a man will have a heart
attack.
The confidence interval for the population standard deviation s is centered at the point
estimate, the sample standard deviation s.
The Poisson distribution is applied to events for which the probability of occurrence
over a given span of time, space, or distance is very small.